
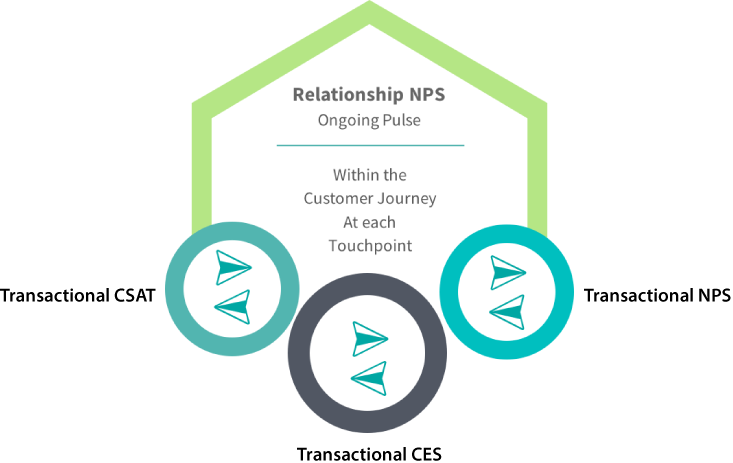
In the world of customer experience (CX), the CES survey is a transactional survey, meaning it gauges the distinct experiences customers have with a particular business. CES surveys are triggered upon specific interactions and processes between a customer and a business.
CES Benefits
More Predictive of Customer Loyalty
The Customer Effort Score (CES) is a customer experience metric that Matt Dixon, a senior leader then at the prestigious Corporate Executive Board (CEB) consulting firm, introduced in 2008.
In 2003, Fred Reichheld introduced the Net Promoter Score (NPS) at Bain & Company in order to come up with a metric with more predictive power over customer loyalty than the pervasive CSAT (Customer Satisfaction) score. The Corporate Executive Board introduced the CES with a similar motive.
Through their research, the CEB found that reducing customer friction is actually a better driver of customer loyalty than creating exceptional experiences at single customer touchpoints. Given our brain’s negative bias, this notion seems pretty intuitive. Yet Dixon observed that companies have been obsessing over creating exceptional individual experiences at a very high cost with no ROI for that extra investment. According to the CEB analysis, Customer Effort Score (CES) predicts customer loyalty 1.8x better than customer satisfaction scores.
The CES’ claim to fame—similar to NPS—was significantly boosted after Dixon and his colleagues at CEB published their findings in a 2010 Harvard Business Review article. At the time, they were going against the pervasive and accepted trend of creating amazing experiences and moments of delight for customers.
“Our research shows, loyalty has a lot more to do with how well companies deliver on their basic, even plain-vanilla promises than on how dazzling the service experience might be” — Stop trying to delight your customers HBR, July 2010
Like other customer experience metrics, the correlation between loyalty and the CX metric is stronger at the extreme. As CEB points out, 96% of customers who are forced to exert a lot of effort in service interactions are more disloyal than those who don’t have to.
WHITE PAPER
Effort & Ease in Customer Experience
Read more about customer effort and ease questions and best practices for implementing them in surveys—and how to take action on their insights!
ROI of Effortless Experience
The CEB published a few statistics to explain the ROI of reducing customer effort. Here is a summary of their findings:
Positive Impact:
- 94% of customers going through an effortless experience are likely to repurchase vs. only 4% of those went through a high level of effort
- 88% of customer going through an effortless experience are likely to spend more vs. only 4% of those went through a high level of effort
Negative Impact:
- 96% of customers going through a high level of effort are likely to churn vs. only 9% of those those who went through an effortless experience
- 81% of customers going through a high level of effort are likely to share their bad experience with friends vs. only 1% of those those who went through an effortless experience
In addition, the CEB findings show that the cost to serve a customer decreases by 37% when going from a high to low level of effort experience¹.
CES Calculation
Customer Effort Score is calculated by averaging all of the individual responses submitted through a CES survey question. …Read More
Customer Effort Score Use Cases
In customer support/service, in e-commerce check-out, in onboarding etc. Read More
What is a good Customer Effort Score?
The higher a company’s CES, the happier their customers will be. According to CEB, moving a customer from a 1 to a 5 boosts their loyalty by 22%. Though moving someone from a 5 to a 7 increases their loyalty by only 2%.
¹ the CEB does not provide in the study the Customer Effort Score point differential around this 37% cost decrease.


See ROI in Half the Time
InMoment’s integrated CX approach increases customer lifetime value and bottom line performance in just 12 months, significantly faster than the industry average of 25 months!

Estimated ROI (payback period in months)