
Net Promoter Score works best as a metric to track your customer loyalty, so you can see, in real-time, how your decisions affect customer satisfaction and success. It’s a tool intended to fuel continuous improvement.
Whatever your starting score is – and no matter what your industry benchmark NPS may be – your focus should be on raising your number.
That said, we understand that there’s a lot of curiosity around evaluating your score against the competition and industry standards. So, we’ll go into how NPS is calculated and where you can find the most up-to-date benchmark numbers.
Calculating NPS for the Uninitiated
Here’s the quick n’ dirty on calculating NPS: Subtract the percentage of promoters from the percentage of detractors. BOOM.
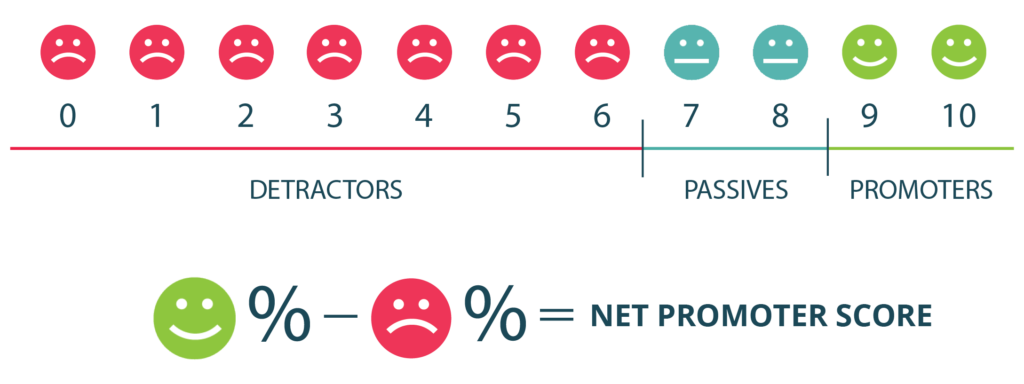
Your Net Promoter Score can range from negative 100 to 100 ( -100 to +100).
At -100, every single person who responds is a detractor. They would not recommend you, and they’re likely to leave bad reviews of your product or service.
At “Zero” NPS, everyone is either passive (not a detractor, but not a promoter either), or you have equal numbers of promoters and detractors, essentially canceling each other out.
If 30% of your customers say they’d be happy to recommend you, but 5% would absolutely not, your NPS is 30-5=25.
An NPS of 50 means that at least 50% of your respondents are promoters, and fewer than 50% detractors. To put it another way, an NPS of 50 can result from any of the scenarios below.
And yes, you ignore the passives entirely in the NPS calculation.
| % Promoters | % Detractors |
|---|---|
| 50% | 0% |
| 60% | 10% |
| 70% | 20% |
| 80% | 30% |
| 90% | 40% |
| 100% | 50% |

E-BOOK
The Modern Guide to Winning Customers with Net Promoter Score
8 Ways to Modernise Your NPS program and Create a Culture of Customer Happiness
So, what’s a good NPS?
Okay, let’s get one thing straight first. You don’t say “NPS score” because “score” is what the “S” in “NPS” stands for. It’s like saying “chai tea” when chai means tea (yes, it really does).
Now the answer: It depends on…
Your industry
A good net promoter score depends on your industry. Some industries (looking at you banking and healthcare) have a very tough time getting numbers above +30. Digital marketing averages around +61 according to recent survey results from Temkin.
For SaaS businesses, we typically like to see an NPS of +50 or more — that’s a healthy starting goal. But, as long as your numbers are moving in a positive direction, you are strengthening your business.
Cultural differences
If you’re a global company, and you notice that your net promoter score is great in the US, but take a dive in France, that may be due to cultural differences. Some cultures are less likely to use the top of *any* scale. Like that college professor who refuses to give an “A”, so even the best student gets a B+.
Survey methodology and channel
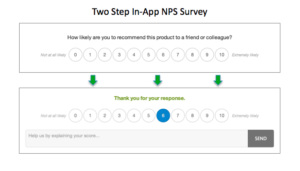
Where and how you deliver your NPS survey can impact your results. To control for that, think about where your customers expect to hear from you. Keep in mind in-app surveys tend to get higher response rates, but people who respond to email as more likely to leave comments that explain their score.
Niche expectations
Every customer niche has a set of preconceived notions and expectations, so keep your customer base in mind. In the B2B sector, you may find that marketers are generally more enthusiastic than, say, engineers. Interestingly, net promoter scores have been slowly lowering over time because all customer expectations for service have been rising, but some niches have higher expectations than others!
Resources for NPS benchmarks by industry
- Forrester’s 2020 report of 260 organisations across 16 industries
- Satmetrix published B2C and B2B NPS benchmark reports
Remember: NPS is a tool, not a judgment. So use whatever number you have as the foundation for a healthier, more productive, more successful relationship with your customers.


See ROI in Half the Time
InMoment’s integrated CX approach increases customer lifetime value and bottom line performance in just 12 months, significantly faster than the industry average of 25 months!
