Table of Contents
InMoment Release Notes: Q1 2023
The Latest Innovations for Improving Customer Experiences
XI Platform Introduces Powerful Integrated CX Technology
We’re excited to bring you a new release of the XI Platform. Our Q1 2023 update features innovative product enhancements to help organizations use XI to its fullest and is a part of a continued effort to build products that leverage an integrated approach to improving customer experiences.
To access the following features, please contact your dedicated Customer Success Manager, who will be more than happy to help get them configured for you.
Feature #1
Deploy Multi-language Surveys
Customer Challenge Addressed: Self-serve surveys, supported in English only, limit businesses to targeting one segment of their customer base. As a result, feedback and insights are restricted in scope and exclude additional demographics that could influence and shape a company’s CX strategy.
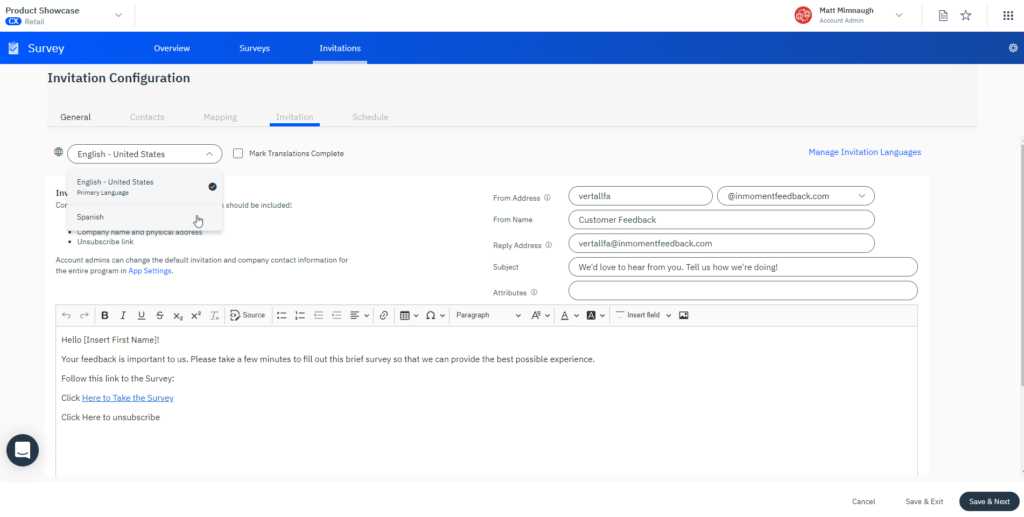
What It Is: Access additional multi-language collection capabilities for location-specific intelligence when building and deploying surveys. New functionality includes adding, visualizing, exporting, and importing languages in Survey. Languages available in an invitation will be determined by the languages made available in the survey.
Where It’s Located: Survey
Value Points :
- Complete audience view regardless of language to better understand various markets
- Efficient customer research to increase completion rates and customer loyalty
- Improve product adoption by personalizing respondent’s experience
Use Cases: “As a program owner, I want to be able to perform ad hoc research in non-English-speaking targeted segments to reach multiple markets and audiences so that I can design, measure, and improve the experiences we deliver globally.”
Import and Export Languages to Specifically Translate Survey Inputs
![]()
Build Multilingual Invitations to Support Global Campaigns
Feature #2
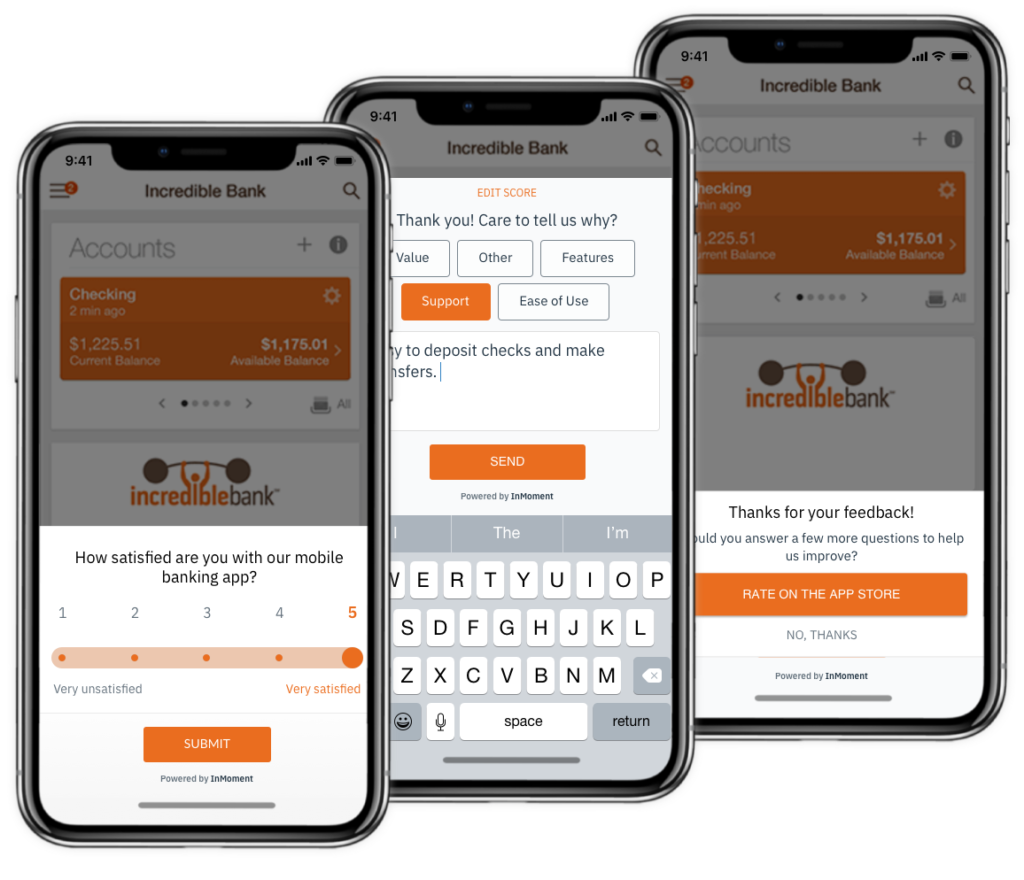
Connect User Feedback to App Store Reviews
Challenge Addressed: Mobile application teams lack the insights to elevate mobile experiences and increase scores in the digital marketplace.
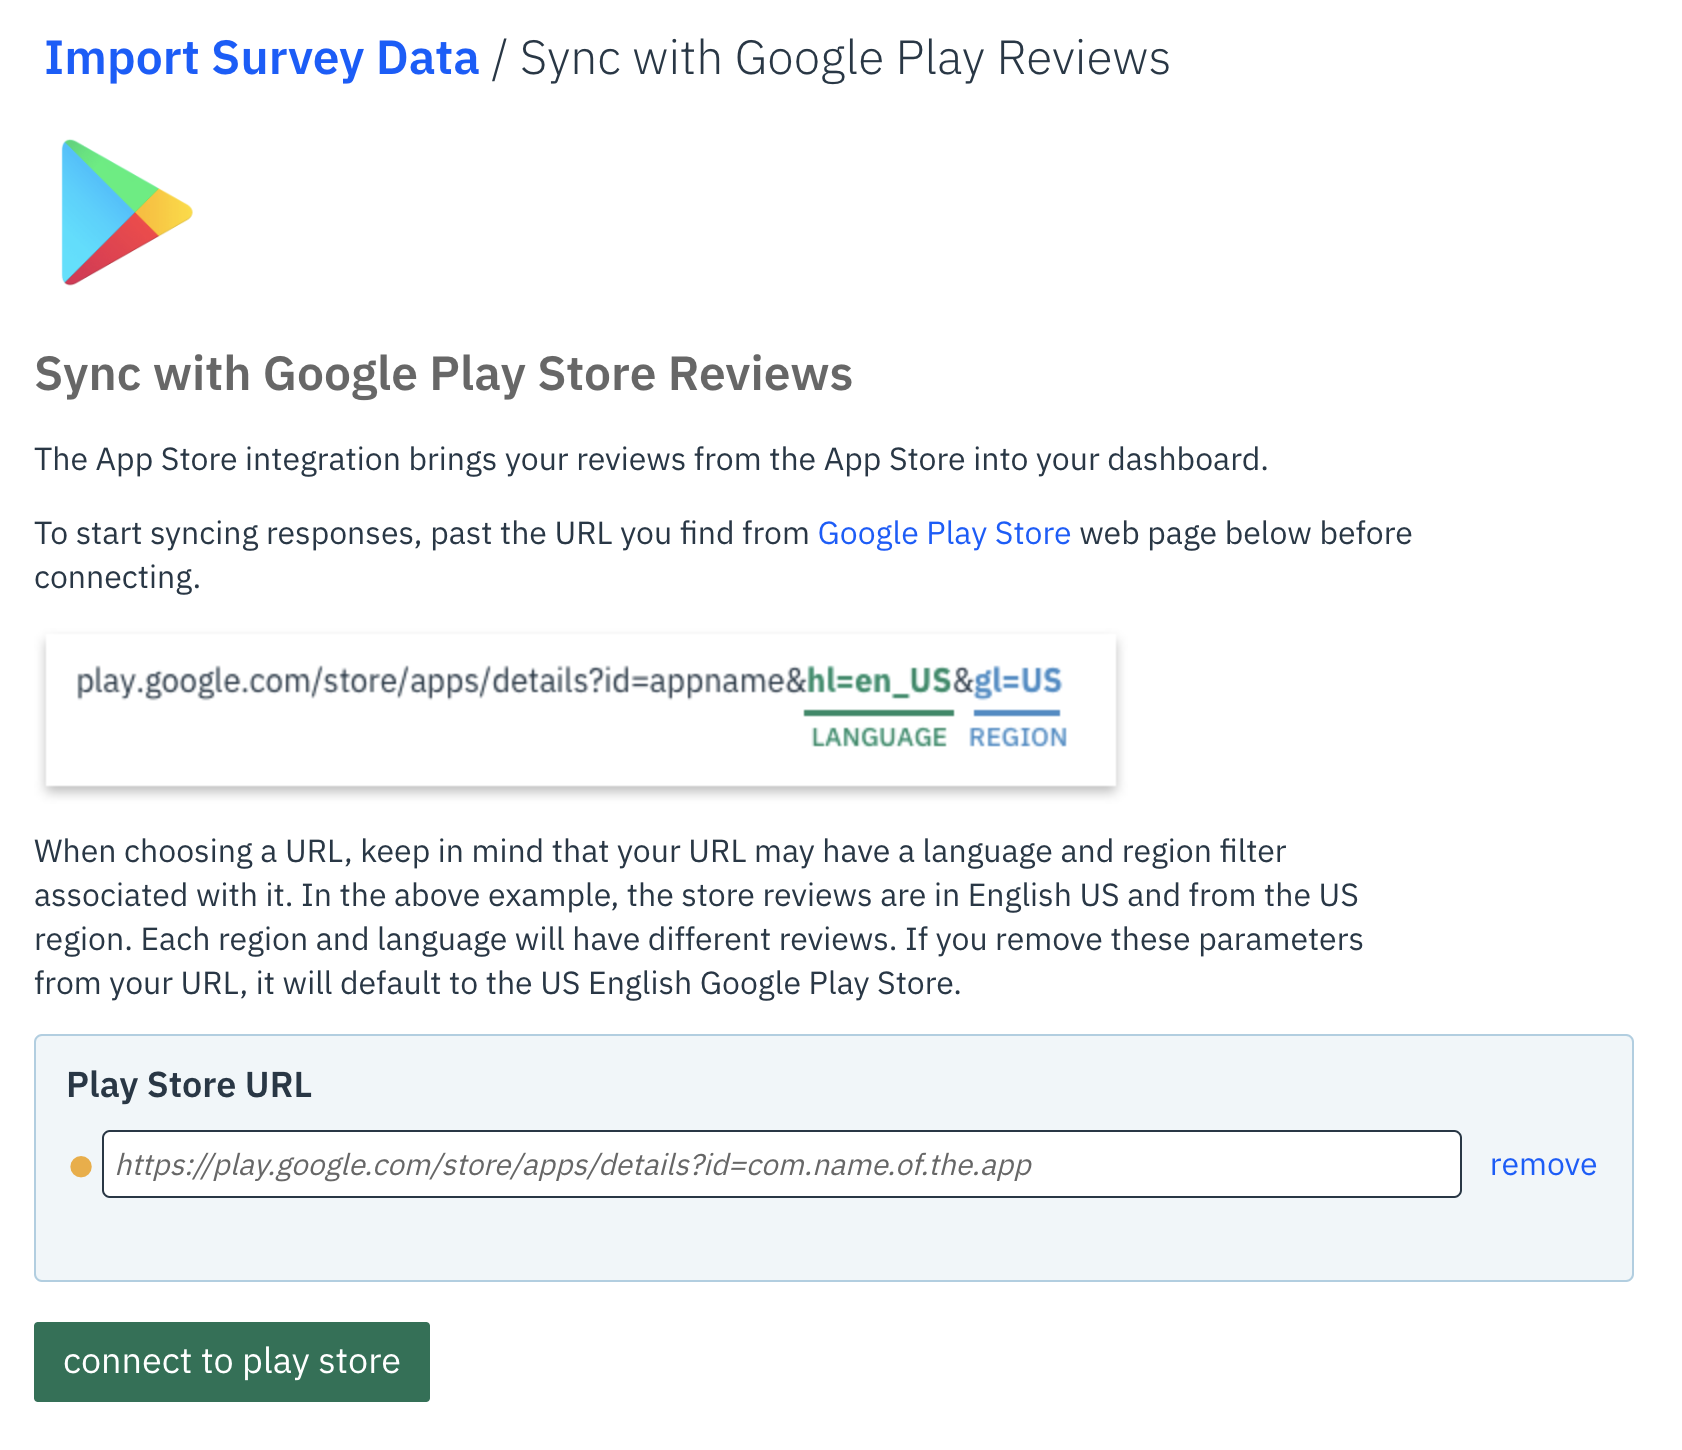
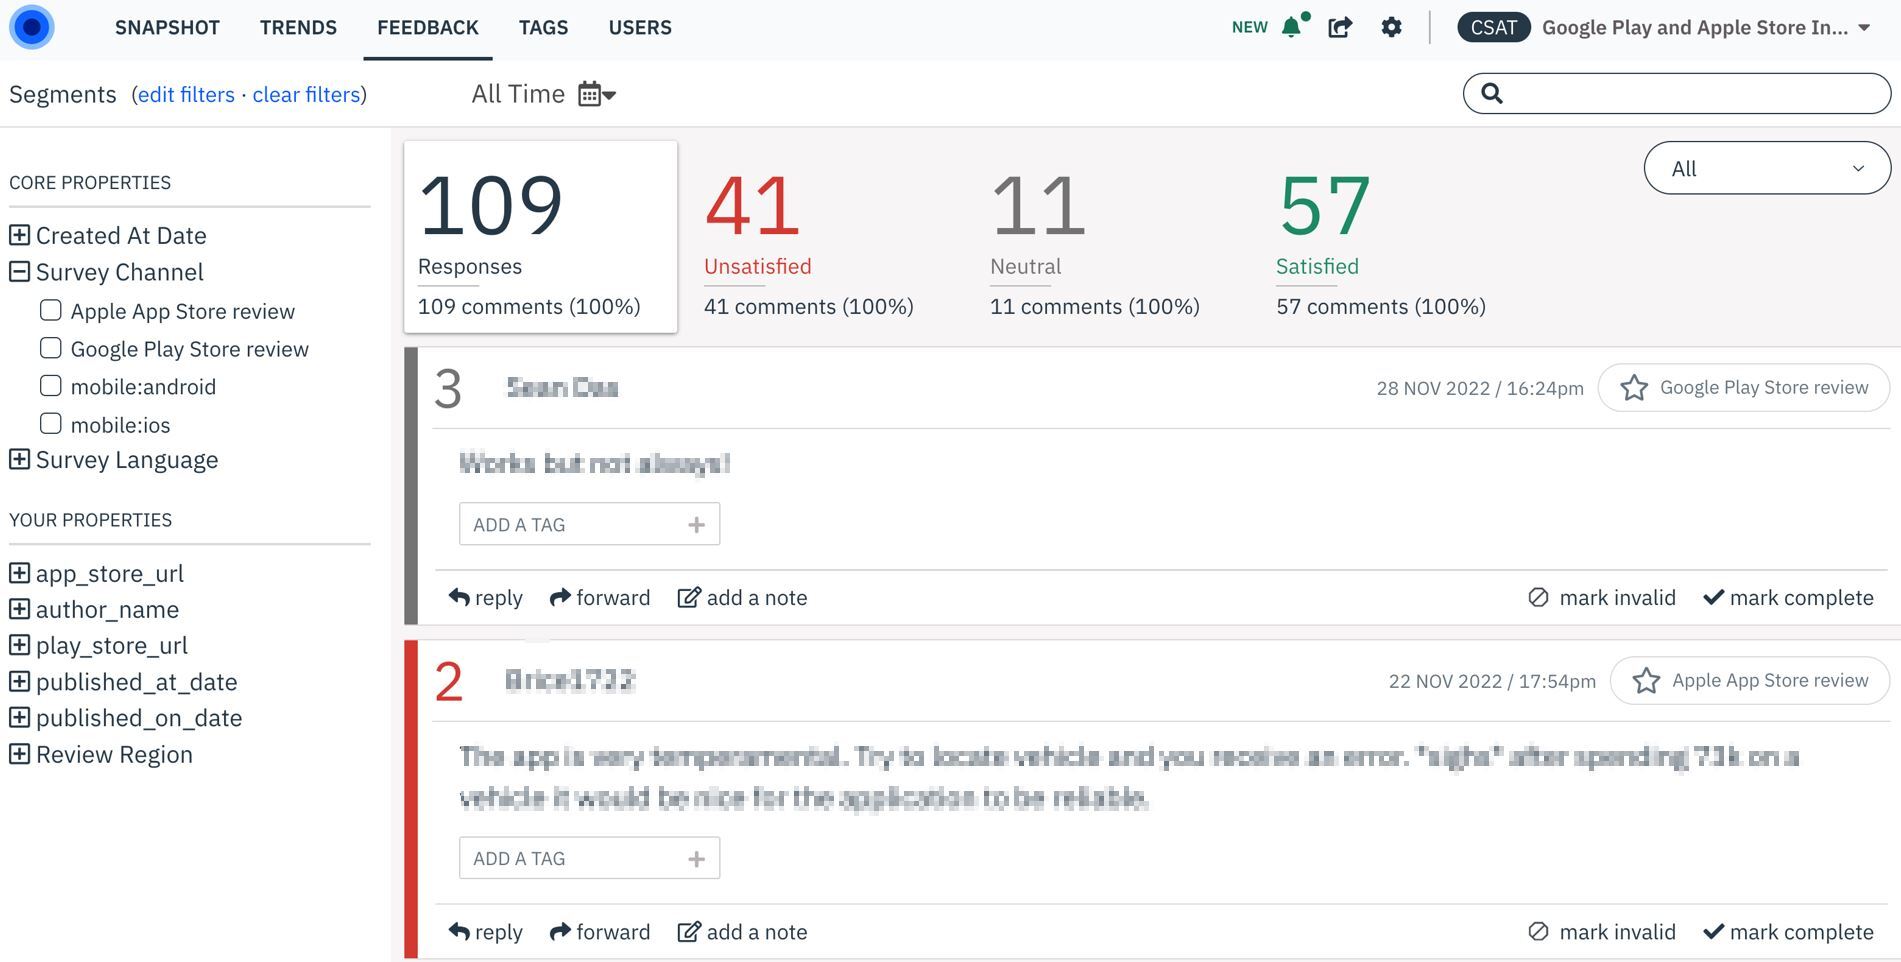
What It Is: Integrate Google Play and Apple Store reviews with digital feedback in one seamless reporting experience to drive mobile application improvements.
Where It’s Located: Microsurvey
Value Points:
- Proactively identify issues early before losing customers
- Drive acquisition of mobile app
- Optimize mobile app feedback to provide a better app experience to customers
- Capacity to focus on improvements that boost app store scores and make the app an invaluable part of the customer experience.
- Customize a product roadmap based on standardized feedback
Use Case: “As a mobile app team, I need to be able to see an aggregate view of my app reviews and digital feedback so that I can improve user experience and increase downloads.”
Proactively Gather Feedback from Google and Apple Stores
Visualize Feedback from Multiple Channels in One Platform
Feature #3
Deeper Digital Insights with Driver Picklist Options
Challenge Addressed: Organizations may have limited context on critical journey points and desire a structure in their feedback to future-proof the business and stay ahead of the competition.
What It Is: New question type allows users to add a closed-ended question with up to five close-ended selections. Selections appear as a picklist with the ability to single-select or multi-select.
Where It’s Located: Microsurvey
Value Points:
- Quicker and easier to identify potential issues
- Easy to deploy in self-serve interface
- Ability to prompt and test drivers
Use Cases: “As a program owner, I am looking to conduct quick two-question surveys across my customers’ digital products and journeys and get selective feedback on areas that the organization needs to take action on.”
Selections to Make it Even Quicker and Easier for Customers to Identify Potential Issues
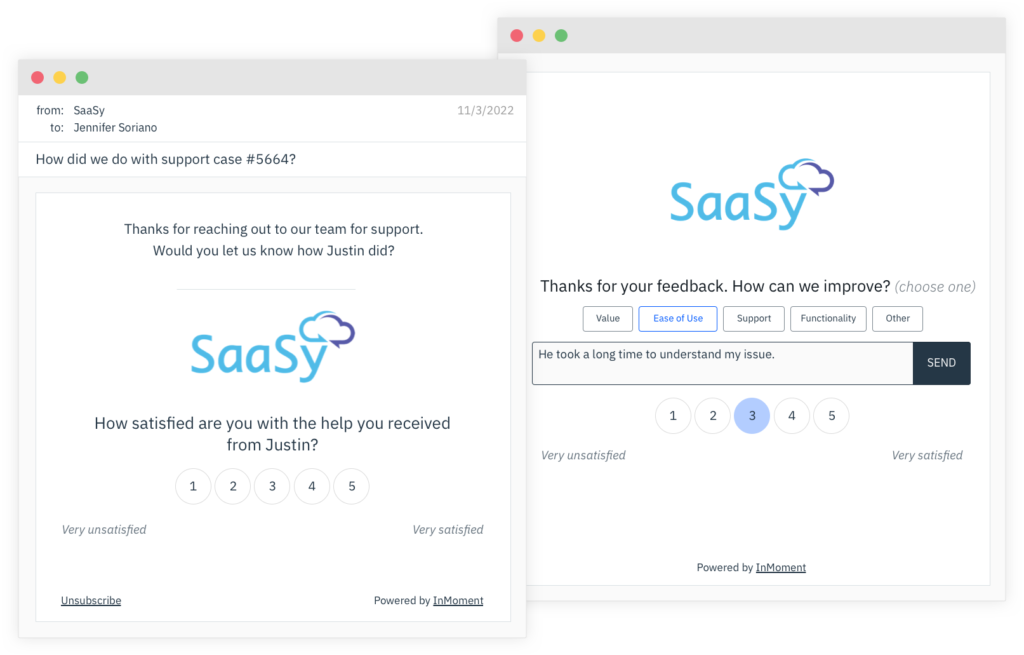
Get a Deeper and Immediate Understanding of What Customers Are Trying to Communicate
Feature #4
Prioritize Highest Impact CX Initiatives
Challenge Addressed: Users struggle to understand where to focus their efforts to improve their experience score. They need a way to drill into feedback data to understand what components of the business are creating positive and negative customer experiences so they can replicate the good and remedy the bad.
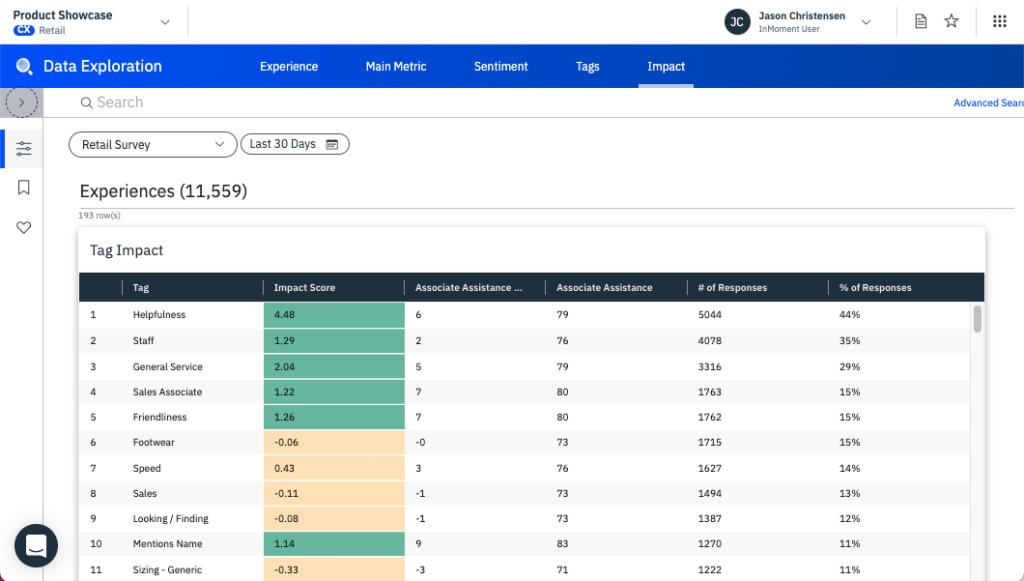
What It Is: Provides insights and visuals into top tags within a text analytics model including the top positive (5) and negative (5) tags impacting a main metric (NPS, CSAT, OSAT, Sentiment Score, etc.) with a tabular view.
Where It’s Located: Data Exploration
Value Points:
- Understanding at a glance where to focus
- Quicker time to value with less time mining data
- Higher ROI from prioritizing high-impact areas on your main metric
Use Cases: “As an experience program owner/head office analyst, I need to be able to identify what is affecting my main metric (NPS, CSAT, OSAT, Sentiment scores) both positively and negatively to focus my efforts on the highest impact areas.”
Understand the Top 5 and Bottom 5 Tags Impacting a Main Metric
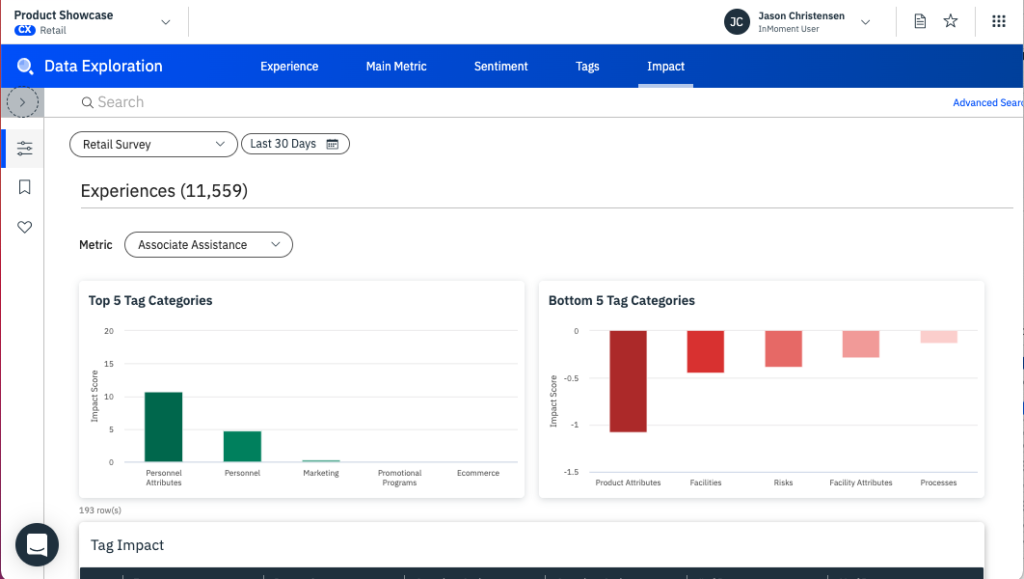
Access Assigned Tag Impact Scores with Associated Breakdowns
Feature #5
Uncover and Predict Customer Intent
Challenge Addressed: Organizations often lack a method for predicting a customer’s next move. This leaves them vulnerable to unexpected churn and undetected issues, as well as unable to prevent negative outcomes at scale based on the experiences their organization delivers.
What It Is: Be more proactive in uncovering what a customer intends to do next leveraging advanced AI within this text analytics model. Intent appears as complaint, praise, suggestion, inquiry, purchase, will return, comparison, requested help, recommend, not recommend, and churn. Take things a step further by filtering and analyzing customer segments based on a customer’s next actions.
Where It’s Located: Spotlight, Data Exploration*
Value Points:
- Ability to predict and preempt customer churn to recover potential revenue loss
- Understand customer intent over time to detect if experiences are improving
- Determine if a customer intends to purchase to predict potential future revenue stream
- Curve negative market feedback with a proactive approach when addressing whether or not a customer intends to recommend or not recommend
- Prepare for and manage evolving customer expectations as new customer suggestions filter in
Use Cases: “As an experience program owner, I want to understand what customers intend to do next in order to prevent negative business and customer impact, as well as promote positive outcomes.”
*Premium add-on
Proactively Surface What Customers Will Do Next
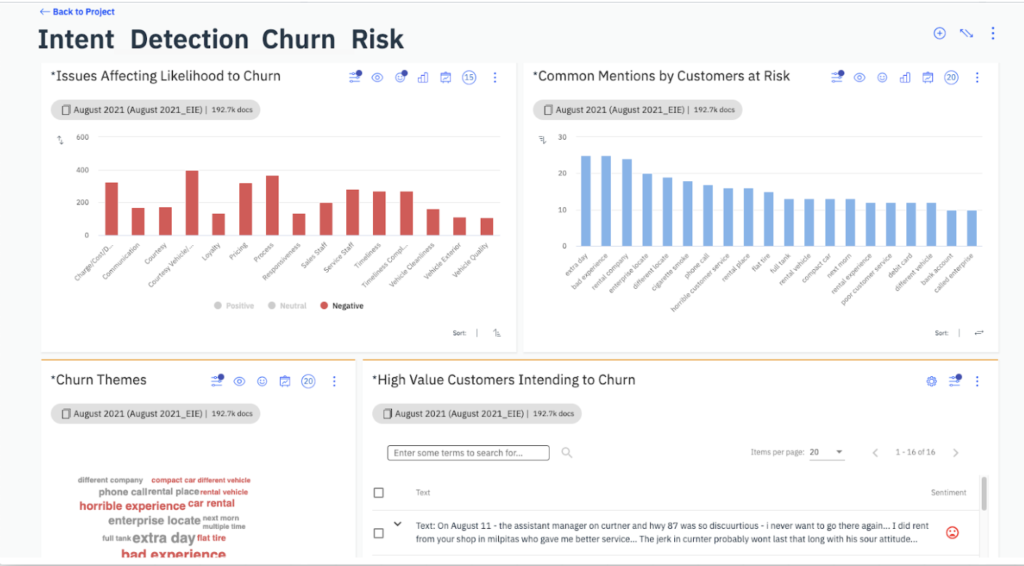
Identify Intent Within a Verbatim
Feature #6
Increase Empathy with Emotion Analysis
Challenge Addressed: Program owners often find it difficult to understand the true meaning behind what their customers are telling them. They lack a method to identify exactly how their customers feel about the experiences they deliver. Sentiment is limited in its actionability. Emotion analysis is required to respond with empathy and drive deeper brand loyalty.
What It Is: Detect emotion within a verbatim with this text analytics model and display findings within experience cards found in the feedback feed. Take things a step further by filtering and analyzing customer segments based on how a customer feels. Emotions captured within feedback data include anger, anticipation, disgust, fear, happiness, sadness, surprise, and trust.
Where It’s Located: Spotlight, Data Exploration*
Value Points:
- Improve interaction process between the customer and business
- Focus on customers’ most extreme emotions
- Build frictionless experiences in customer journeys
- Understand how to shift customers from one emotion to another empathetically
- Create emotional connections with customers
- Avoid experience troughs, end on a high note, and engineer positive moments through the journey to make the greatest impact
Use Cases: “As a frontline employee, I need to understand the emotion behind customer feedback so I can close the loop with a deeper level of empathy.”
*Premium add-on
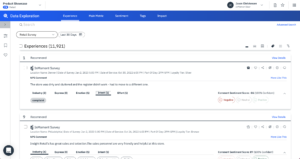
Surface Topics that Have Extreme Emotions Associated
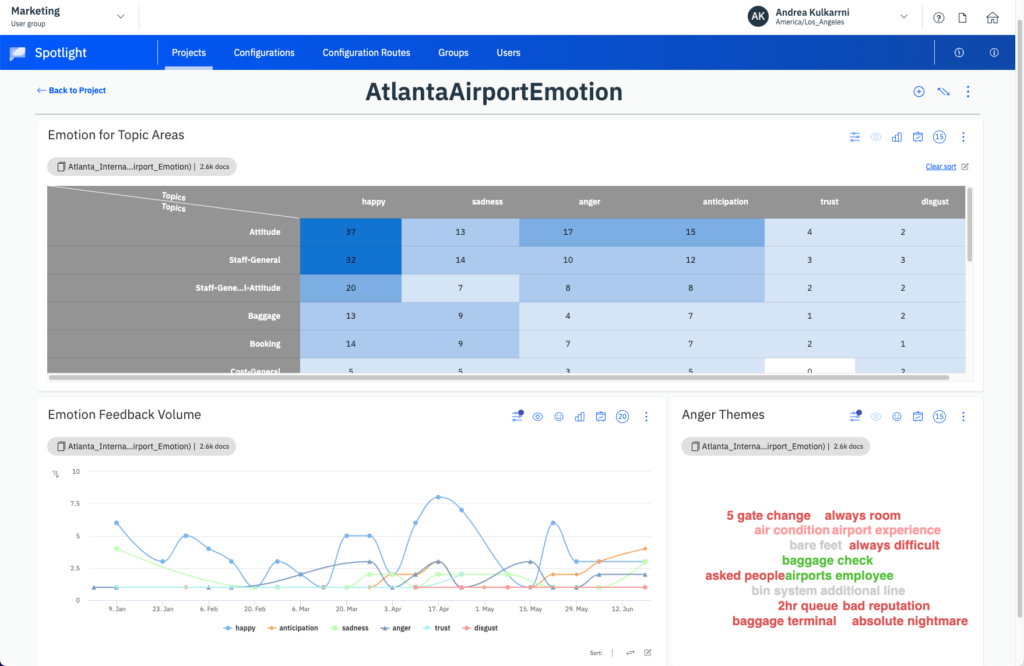
Identify Emotion Within a Verbatim
Feature #7
Discover Customer Journey Friction Points
Challenge Addressed: Understanding customer effort has been hard to measure and improve without a quantifiable CES score. This led product leaders to struggle to measure and monitor a task’s difficulty and address segments where friction points appear in the customer journey.
What It Is: A text analytics model that determines the amount of effort required (high, low, some, or none) to accomplish a given task. Using natural language processing, the effort model helps users understand the level of effort associated with a particular topic when looking at social data, call scripts, complaints, and more.
Where It’s Located: Spotlight, Data Exploration*
Value Points:
- Ability to understand how customer effort impacts main metrics from unstructured data
- Measures the effort your customers require to complete a transaction
- Measures the effort required by a customer to resolve a support issue
Use Cases: “As an experience program owner, I want to gain insight into touchpoints where customers experience difficulties to break bottlenecks and improve experiences.
*Premium add-on
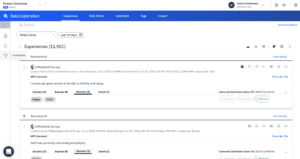
Detect Experience Difficulties Within a Customer Journey
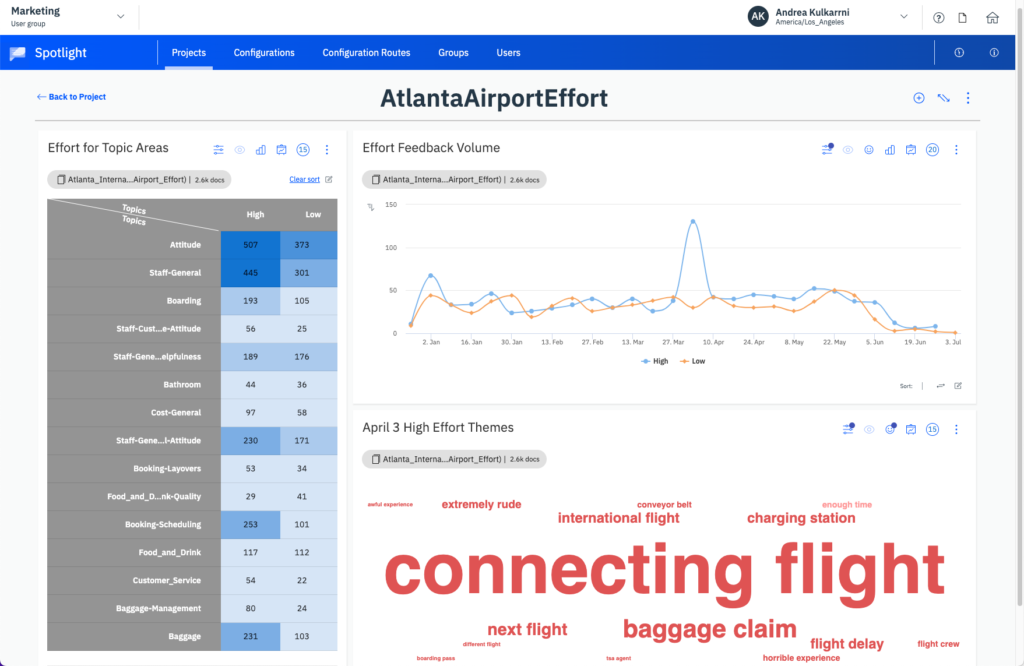
Identify Effort Within a Verbatim
Feature #8
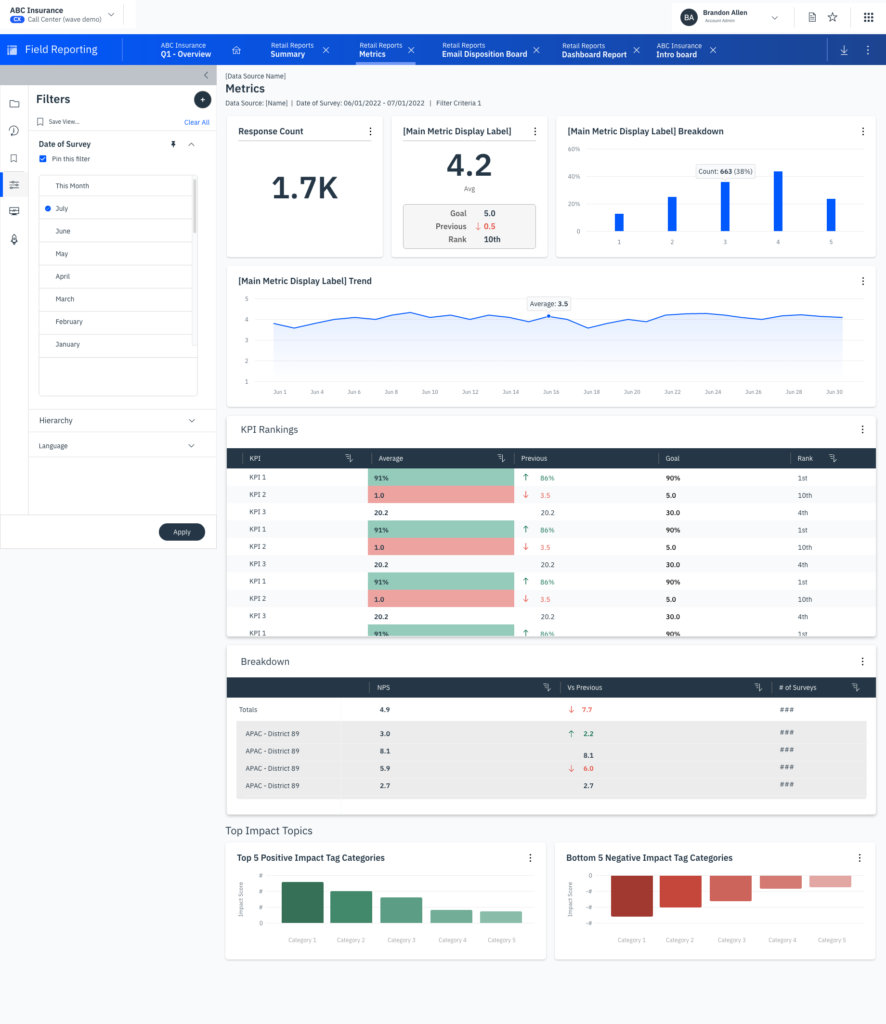
Create Your Own Reports and Dashboards
Challenge Addressed: CX program owners and analysts want quick access to self-serve options to create reports and visuals that depict a combination of response-level data, trending scores, KPIs, and goals that are customized to their business needs and requirements.
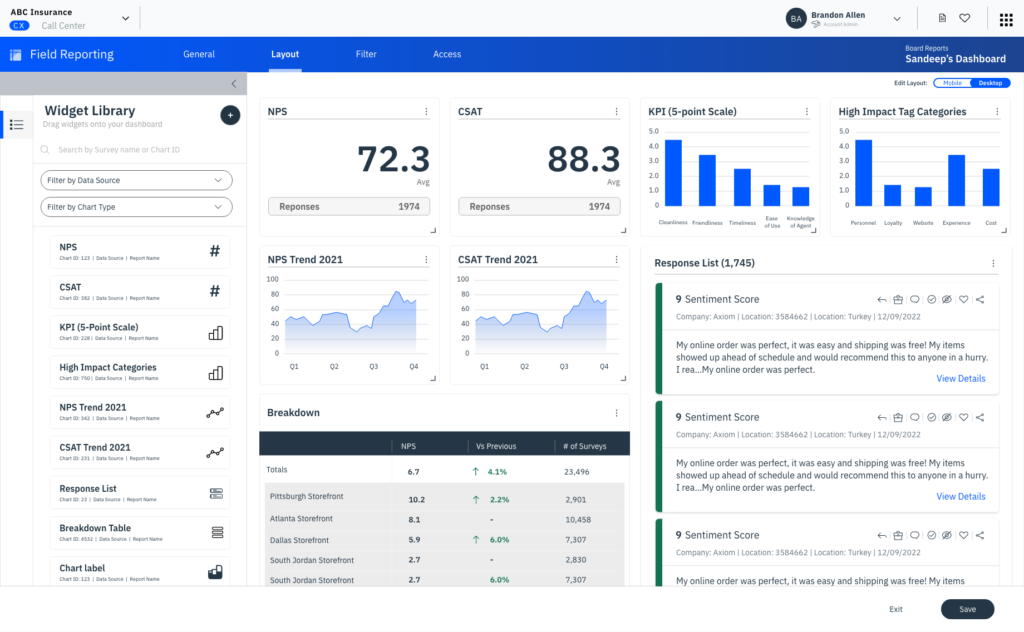
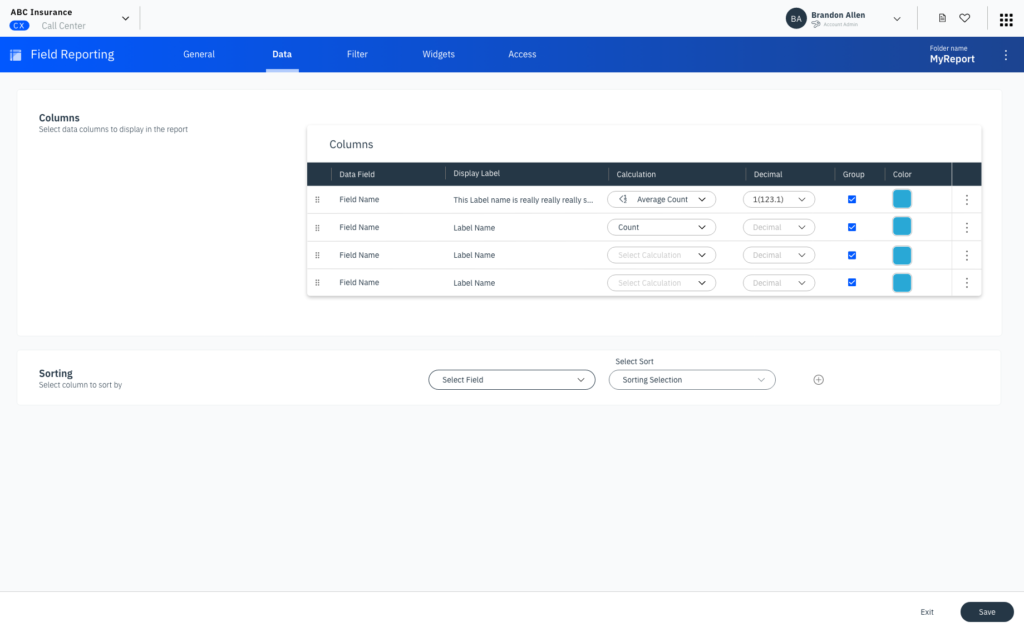
What It Is: New self-serve capabilities within Field Reporting make it easy to deliver tailored insights on program performance with an intuitive report-builder interface. This includes self-serve reporting that enables users to create configurable tables of aggregated or response-level data that can be used to build visualizations. These reports can then be displayed as widgets within a dashboard. Once a widget has been created, it is saved in a library for future use and quick dashboard setup.
Self-serve dashboards enable users to take report learnings and display them in an easy-to-digest format. A dashboard wizard guides users through the setup process and provides drag-and-drop options for total insights customization. Users can also link widgets to original reports, allowing them to drill deeper for additional information straight from a dashboard.
Field reports and dashboards also benefit from Field Reporting’s role-based permissions, allowing users to control report and data-level access. Report and board access may be assigned to specific individuals or groups based on the hierarchy levels.
Where It’s Located: Field Reporting
Value Points:
- Self-serve dashboards that help users create visualizations reducing the speed and cost associated with custom builds
- Customizable insights that meet specific business requirements
- Immediate experience improvement with access to high-level KPIs and scores for location-level users
- Easily connect with additional XI applications for further data exploration concerning feedback sentiment, impact, intent, effort, and emotion analysis
Use Cases: “As a CX analyst, I want to build and edit reports and dashboards that help myself and others visualize and digest key learnings within my experience data.”
Display Reporting Widgets Within a Dashboard
Configure How Your Data Displays
Feature #9
Instant, Holistic CX Program Reporting
Challenge Addressed: Businesses have previously been unable to access insights quickly for key metrics without the need for custom builds. As a result, these insights have been expensive and slow.
What It Is: Automated reports to better understand invitation disposition, survey response details by category, main metric breakdown, and closed-loop performance. Users can see a roll-up of these program-critical insights without any manual configuration.
Where It’s Located: Survey, Microsurvey, Field Reporting, Pro Reporting
Value Points:
- Instant insights on every campaign
- Granular and deep insights into key metrics with drill downs
- Cross a metric with any categorical response
- Filter by date (disposition reports)
- Select default user group
- Customize labels
- Best practice automated reports
- Metric alerting based on if a score goes up or down
Use Cases: “As a program owner, I want to access key drivers associated with my program to identify areas for improvement, drive new behaviors, and track performance.”
Take a Metric and Intersect It With a Non-Rating Categorical Question
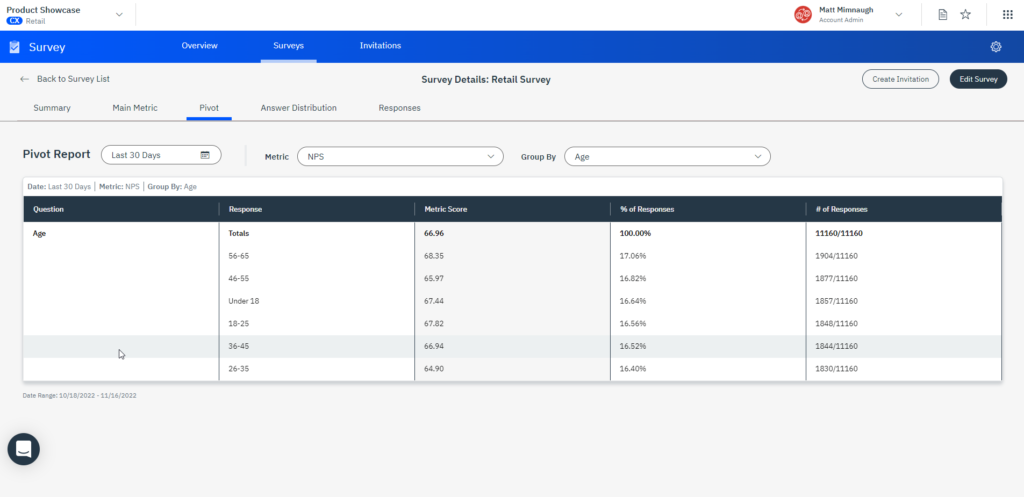
Access Main Metrics With Associated Trends and Breakdowns
Feature #10
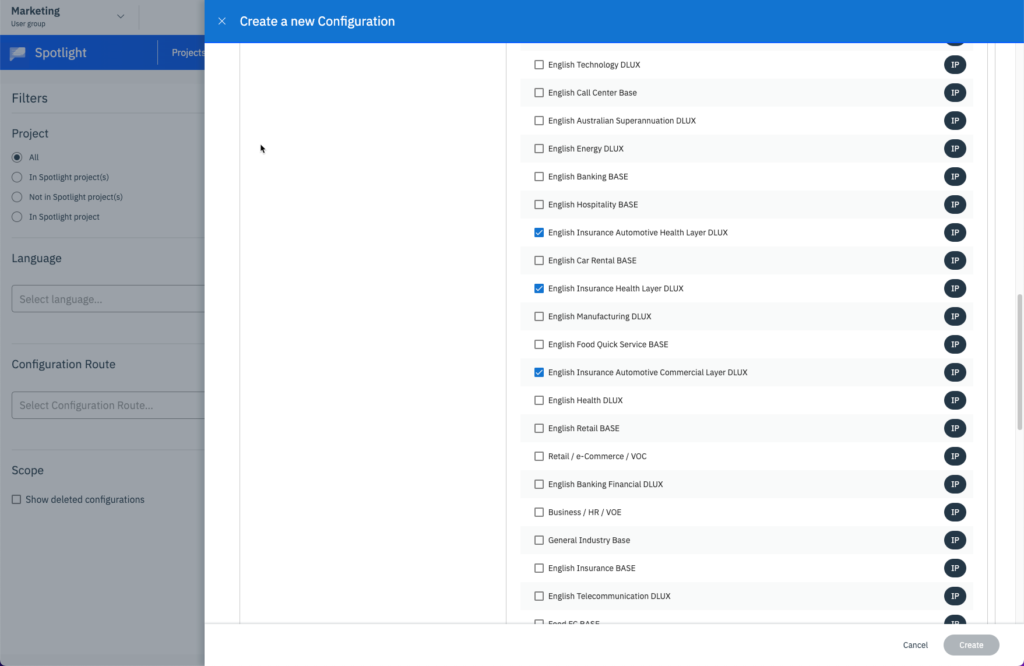
Identify Emergent and Brand-Specific Themes Using NLP
Challenge Addressed: Customers wanted to dynamically keep up with changing consumers, markets, etc., but didn’t want to make all the required updates to their model themselves. Also, they weren’t automatically receiving industry model vendor improvements. This meant insights were stale, and they were unaware of new developments and trends in adjacent or related industries.
What It Is: Combine multiple industry models to derive the best possible insights for an organization. This new, comprehensive model can be manually modified while benefiting from improvements made to base models to keep up with industry developments.
For example, an insurance provider combines the Health Insurance, Auto Insurance, and Technology industry models, and then adds their own business-specific modifications so they understand the full spectrum of conversations, with less chance for missed insights.
Where It’s Located: Spotlight, Data Exploration*
Value Points:
- Achieve broad industry coverage with adjacent industry inclusion
- Benefit from automatic model updates
- Cast a broader net for richer insights
Use Cases:
“As a Spotlight text analytics administrator, I would like to make my own additions and modifications, but still benefit from base model upgrades. I’d also like to combine industry packs to broaden domain coverage for my business so that I can ensure the best match to detect the most accurate insights.”
“As a Data Exploration program owner, I’d like to have my industry model detect the nuances of my business.”
*Requires expert services
Multi-layered Model for Customization and Thorough Industry Coverage
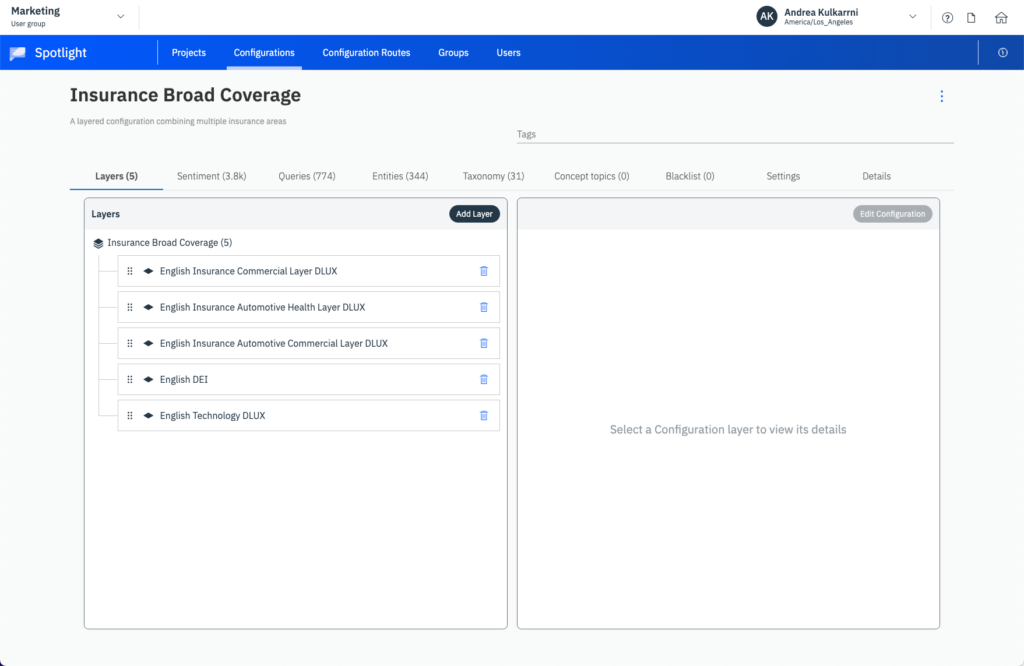
Configure your Layered Text Analytics Models
Feature #11
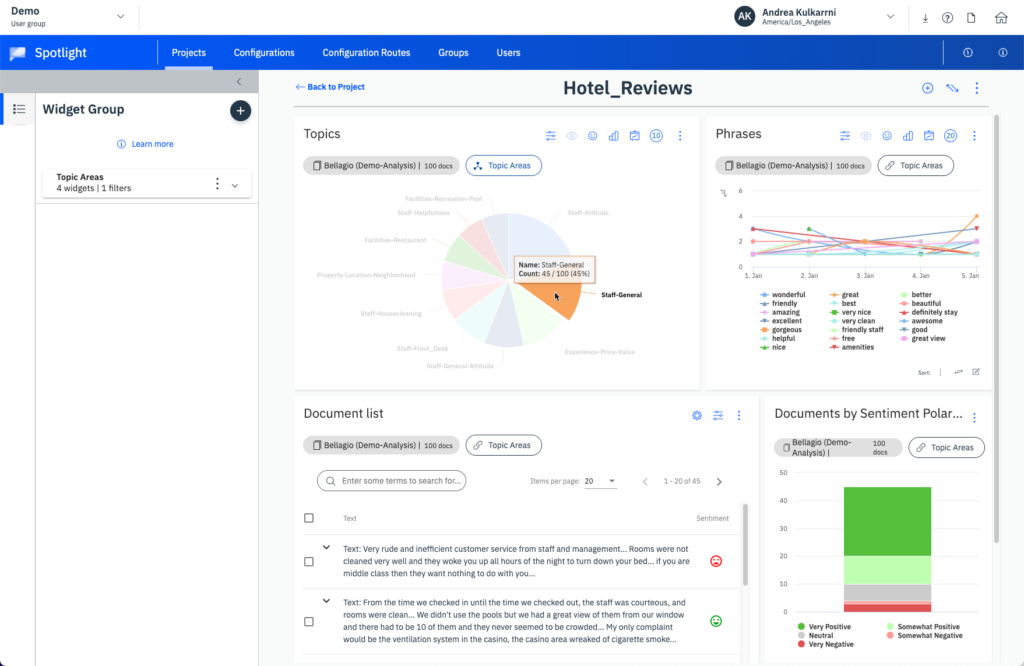
Group and Filter Charts and Visualizations
Challenge Addressed: It is often tedious and time-consuming in dashboarding tools to get to the available insights across the visualizations. Users must set individual filters for each visualization or settle for the dashboard-wide or page-wide filters.
What it is: Group together visualizations and apply a common filter lens to focus on the story. Explore relevant insights by selecting specific subsections in the group’s parent widget.
Where it’s Located: Spotlight
Value Points:
- Create related groups of visualizations and modify the view across them quickly and easily for better storytelling
- Quickly explore segments such as topics, regions, and other comparable features
- Reduce time to insights by exploring and filtering within a single dashboard
Use Cases: “As a program owner, I want to quickly review feedback insights by region. I want to set up a group filter with a region’s chart and then select each region in turn to see the metrics and insights updated in the group accordingly.”
Grouped Visualizations for Faster Filtering and Storytelling
Feature #12
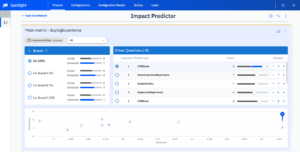
Run Predictive Simulations on Drivers of Performance
Challenge Addressed: Practitioners had difficulty interpreting their feedback and knowing what to focus on. Impact Predictor helps identify the most important drivers of key metrics so practitioners can prioritize the actions that will have the biggest impact on experience goals.
What It Is: Impact Predictor is a combination of key driver analysis of the main experience metric along with a new interactive dashboard to simulate the impact of program changes. This solution empowers managers to understand the relative importance of driver questions on the experience metric, current performance, and predict future performance to drive the creation and monitoring of business action plans.
Where It’s Located: Spotlight
Value Points:
- Know where to focus improvement initiatives with the highest return
- Improve core metrics faster with informed areas of prioritization
- Understand the historic importance of business drivers, how customers currently rank them, and how they will likely rank them in the future if they improve, so I can take action
- Make informed changes to my survey to explore high importances themes in my feedback
Use Case: “As a Customer Experience Manager, I’d like to understand the most important predictors of churn so I can focus on closing the loop and retaining customers in the highest impact areas.”
*Premium add-on
Prioritize Improvement Where it Really Makes a Difference
Feature #13
Integrate Social Review Data with VoC
Currently available in English only
Challenge Addressed: Businesses have limited capabilities to combine voice of customer feedback from solicited channels with social review channels to analyze and drive action. This led to a siloed view of what customers say to your brand, but not about your brand to their friends and family.
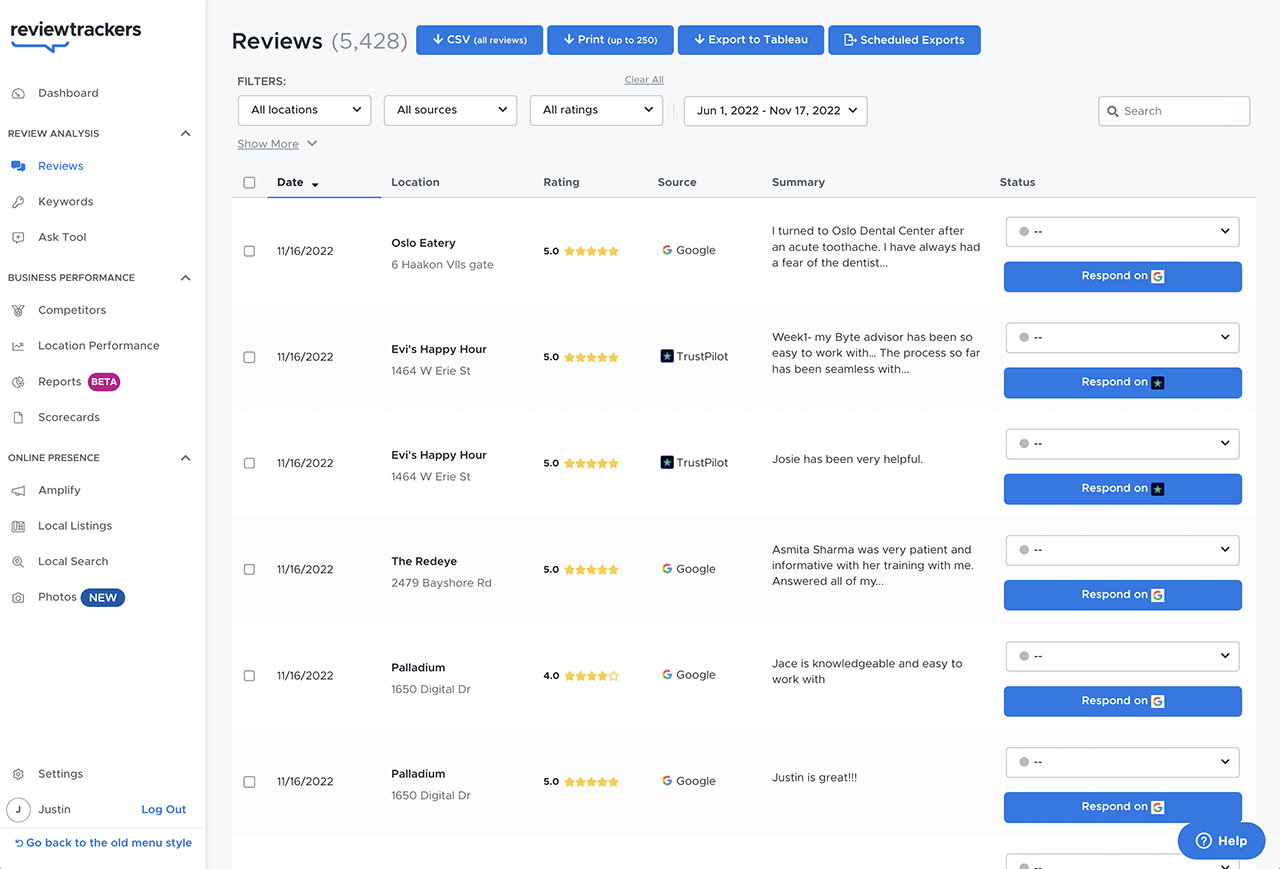
What It Is: ReviewTrackers, the latest technology to join the InMoment family, is now integrated into the XI Platform via SSO and API! Users seamlessly access the ReviewTrackers application from within the XI app picker. It is easily enabled like any other XI application at both the System and Program level and is controlled through user permissions.
XI Platform users also have the choice to ingest reviews as a new data source for analysis alongside survey responses and other feedback data for a more holistic view of the customer journey. For a full list of review sites ReviewTrackers monitors, please click here.
Where It’s Located: ReviewTrackers now available as an application in XI
Value Points:
- Receive notifications of high-impact reviews in near real-time
- Improve business reputation through in-channel closed loop
- Drive new customer acquisition by building SEO
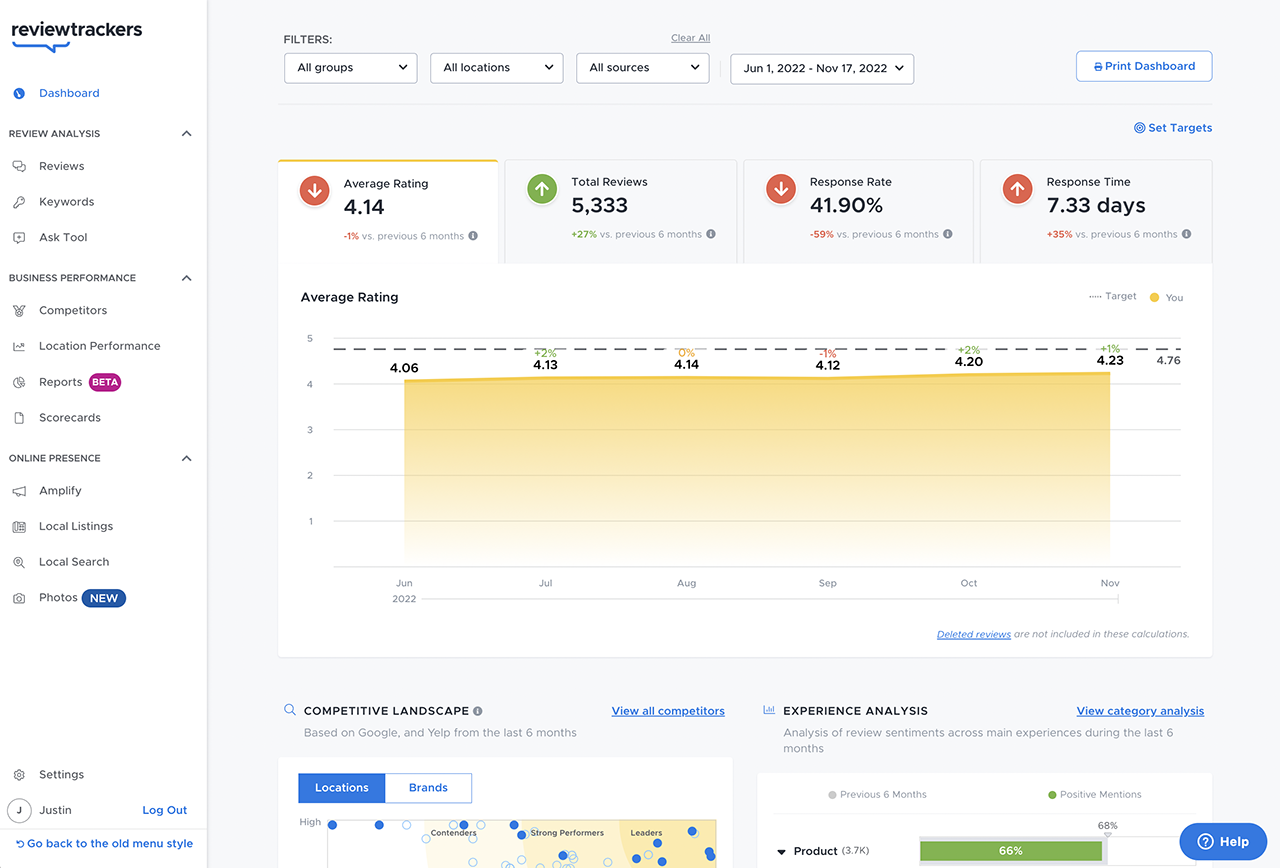
- Combine social reviews and VoC for richer insights
- Win market share by better understanding the competitive landscape
Use Cases:
“As a Customer Service manager, I want to be able to respond to public reviews in-channel as soon as possible so that I can recover dissatisfied customers.”
“As a CX program owner, I want to combine review data with survey data to increase my sample and better understand the holistic customer journey in one place.”
See and Manage all Review Details in One Centralized Place.
Clearer View of the Most Important Social Data and Trends
Feature #14
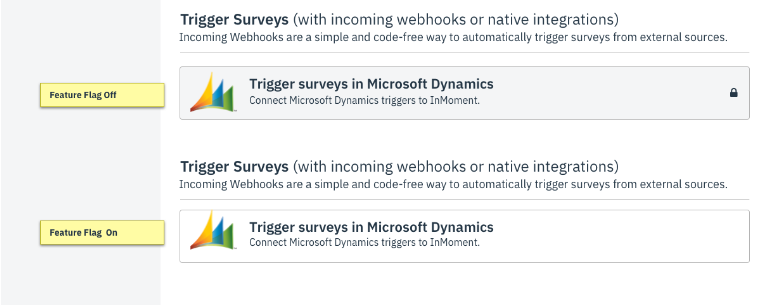
Trigger Surveys through Microsoft Dynamics
Challenge Addressed: Organizations struggle to close cases and seize opportunities for engagement within the customer journey in Microsoft Dynamics.
What It Is: New integrated Microsoft Dynamics webhook to support survey triggers from Dynamics fields & workflows.
Where It’s Located: Microsurvey
Value Points:
- Set up survey triggers quickly and easily inside Microsoft Dynamics
- Enrich and filter survey responses with Microsoft Dynamics data fields
- Get actionable data that can help make important decisions to improve the overall customer experience
Use Cases: “As a program manager, I want to trigger surveys based on key flows and activities within Microsoft Dynamics so that I can continuously track customers’ perception of my services and products.”
Real-Time Integration Allows Cross-functional Collaboration
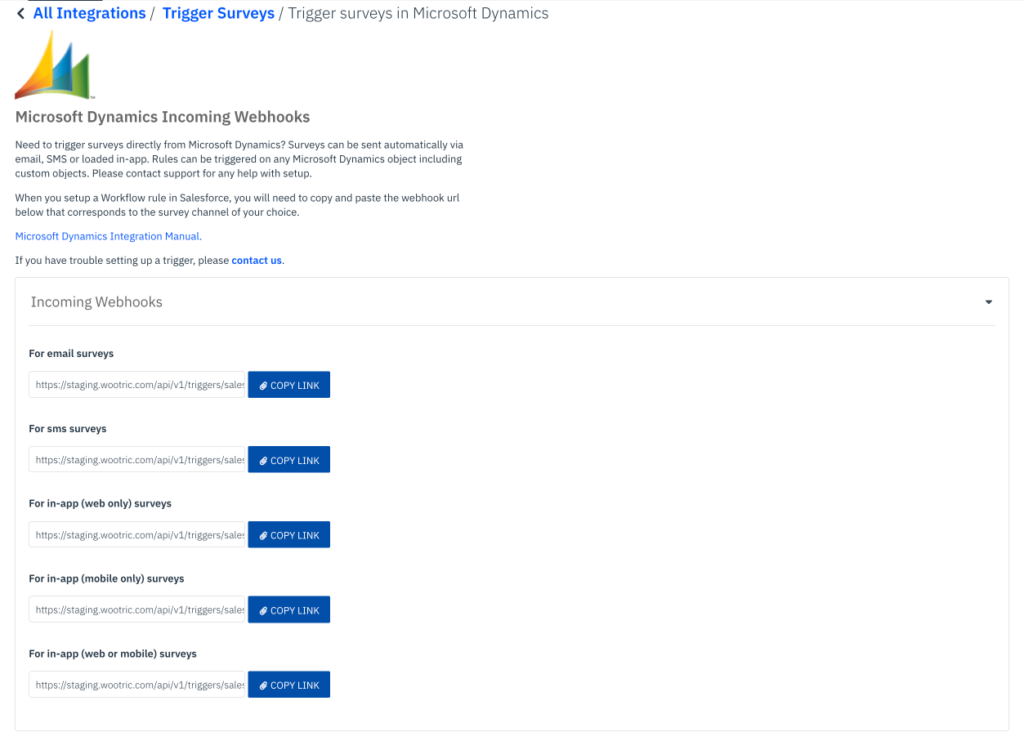
Connect What Customers Are Saying with Microsoft Dynamics
Thanks for Reading!
We release new features daily, and we’ll continue to communicate them to you via regular notes, so you don’t miss a beat!
Ready to Get Started With the New Capabilities?
We’re ready to get you up and running when you are! If you are interested in the new features highlighted in these release notes or in getting access to the XI Platform, please contact your dedicated Customer Success Manager, who will be more than happy to help.