How to Read the Forrester Wave for Text Analytics: A Guide for Buyers

With the increased adoption of AI in business across all industries, there has also been a rise in text mining and analytics. This software, which exists as an extension of AI and natural language processing (NLP), is used to gather insights from unstructured text data in order to make informed business decisions.
If your business has reached the need to purchase text analysis software, you are more than likely comparing third-party evaluations as part of your research process. Understanding these third-party evaluations is crucial to choosing the right software for your business. Among these evaluation tools are evaluative Analyst reports such as The Forrester Wave, Gartner Magic Quadrant, or IDC MarketScape.
The Forrester Wave™ is a valuable resource that evaluates and ranks vendors in a particular market, but understanding how to read and interpret the Wave report can be daunting. By reading this guide, you will understand how to navigate reports like the Forrester Wave and make informed decisions from the reports’ implications.
What is the Difference Between Gartner and Forrester?
The Forrester Wave™ and the Gartner Magic Quadrant™ are widely recognized and influential market research reports evaluating technology vendors. While both serve to help buyers make informed decisions, they differ in methodology, structure, and focus.
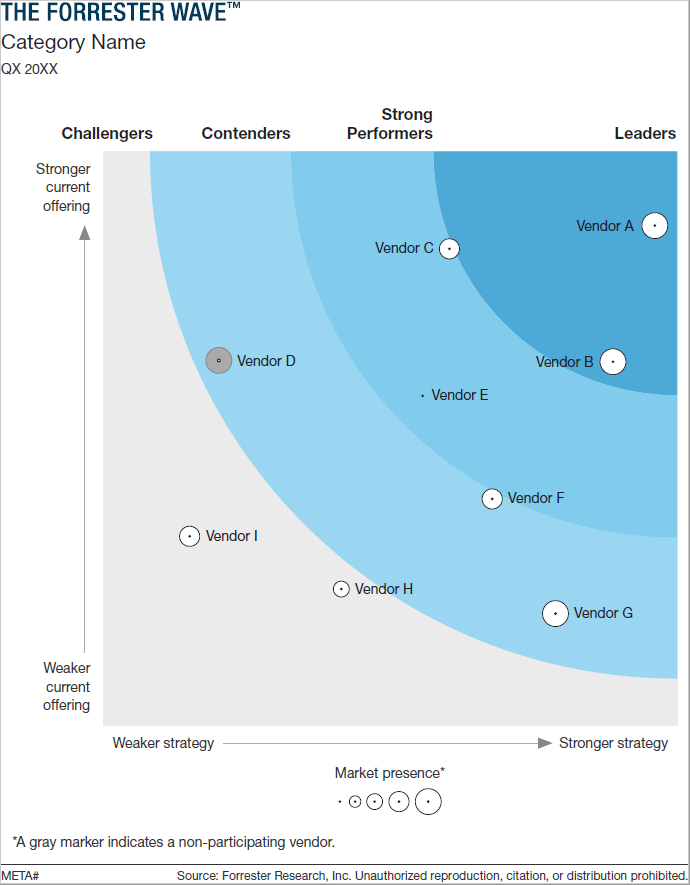
In the Forrester Wave, vendors are ranked based on criteria such as their strategy and current offering, which represent the x and y axes. They are also ranked on market presence, which is represented by the size of the dot on the graphic. For each of these three categories, there are subcategories that vendors are scored on. These scores are taken into account and then vendors are positioned in segments such as Leaders, Strong Performers, Contenders, and Challengers on the Wave graphic.
Conversely, the Gartner Magic Quadrant™ offers a high-level overview, evaluating vendors based on their Completeness of Vision and Ability to Execute. Vendors are placed in one of four quadrants: Leaders, Challengers, Visionaries, and Niche Players. The Magic Quadrant is useful for quickly comparing vendors and understanding the overall market landscape and strategic positioning.
Ultimately, the Forrester Wave™ is best for buyers seeking a detailed, customizable evaluation, while the Gartner Magic Quadrant™ is suited for those needing a quick, strategic overview of vendor capabilities and market trends. Understanding these differences helps buyers select the right tool for their specific needs.
Understanding the Forrester Wave™ Methodology
The Forrester Wave™ is a comprehensive evaluation of technology providers in a specific market. For text analytics, it assesses vendors based on a detailed set of criteria to provide a comparative analysis. Here’s how it works:
- Vendor Selection: Forrester selects the most significant vendors from the preceding Landscape report which acts as a precursor to the evaluative Wave and outlines market dynamics, top business use cases, and provides a list of ‘players’
- Criteria and Weightings: Forrester defines a set of criteria that comprise the two categories of strategy and current product offering. Weightings of these criteria (how much each one is worth) are not shared with vendors until post-publication… Each criterion is assigned a weight based on its importance to the overall evaluation.
- Data Collection:There are three inputs into a Forrester Wave evaluation: a questionnaire, a strategy and product demo session, and customer references.
- Scoring: Each vendor is scored on a scale (0 to 5) for each criterion. These scores are then weighted and combined to produce an overall score for each category.
- Wave Graphic: The scores are plotted on a wave graphic, with vendors positioned in different segments: Leaders, Strong Performers, Contenders, and Challengers. The size of the dots are representative of the vendors’ market presence, which is determined by revenue.
Decoding Forrester Wave™ Classifications
The Forrester Wave graphic visually represents the relative strengths and weaknesses of each vendor. Here’s what the graphic for each Wave looks like as well as what each classification means:

- Leaders: These vendors have the highest scores in the evaluation criteria. They exhibit strong current offerings, robust strategies, and a significant market presence. Leaders are generally the safest choice for most buyers.
- Strong Performers: Vendors in this segment have solid offerings and strategies but may lack in some areas compared to leaders. They are still viable options, especially if they meet specific needs or have unique strengths.
- Contenders: These vendors may have competitive offerings but are often limited by weaker strategies or lower market presence. They can be suitable for buyers with specific requirements that align with the vendor’s strengths.
- Challengers: Vendors in this category typically have lower scores across multiple criteria. They may be newer to the market or lack certain features. They are riskier choices but might offer innovative solutions or cost advantages.
Key Components of the Forrester Wave for Text Analytics
The full Forrester Wave report will consist of three main sections: current offering, strategy, and market presence. Each category will cover different aspects of an organization’s presence in the marketplace.
Current Offering: This category evaluates the product’s features and capabilities. Key criteria might include:
- AI: ML-based, knowledge-based, or symbolic
- Generative AI: Pre and post-processing
- Deployment options
- Omnichannel data integration
- Security and regulatory compliance
Strategy: This category assesses the vendor’s vision and roadmap. Key criteria might include:
- Innovation: The vendor’s commitment to innovation and staying ahead of market trends.
- Product Roadmap: The planned future developments and improvements.
- Pricing flexibility and transparency
What This Means for Buyers
As a buyer, the Forrester Wave for Text Analytics provides a comprehensive and unbiased assessment of the market. Here’s how you can use it:
- Identify Your Needs: Determine what’s most important for your organization. Are you looking for a platform with advanced NLP capabilities? Or is integration with existing systems more critical?
- Compare Vendors: Use the Wave graphic to compare vendors at a glance. Focus on the Leaders for well-rounded options, but don’t overlook Strong Performers if they align better with your specific needs.
- Dive Deeper: Read the detailed vendor profiles and scores for a deeper understanding of each vendor’s strengths and weaknesses. Pay attention to how vendors perform in areas that matter most to your organization.
- Evaluate Market Trends: Consider the market trends and how vendors plan to adapt to them. For example, vendors will no longer differentiate themselves on text mining functionality alone, it is the pre and post-processing processes that will set them apart.
- Consider Future Needs: Look at the strategy scores and product roadmaps to ensure the platform you choose will continue to meet your needs as your organization grows and evolves.
InMoment’s Placement in the Forrester Wave
InMoment was recently recognized as a Leader in the Forrester Text Mining & Analytics Wave ‘24. This achievement highlights the capabilities of the XI Platform such as knowledge-based AI, document-level text mining, natural language understanding, and more!
To learn more about InMoment’s platform, schedule a demo today!


