Customer Survey Statistics: Everything You Need to Know
All types of businesses leverage customer surveys, and they’re as important for small, growing businesses as they are for established corporations. When you’re creating a customer survey, whether it’s for the first time, or something you do each year, it’s helpful to understand what to expect. What is a good survey response rate? What are best practices for customer surveys? What is the competition encountering?
As businesses continue to evolve their customer listening channels as a part of their Integrated CX strategy, one source of feedback will always be around – customer surveys.
All types of businesses leverage customer surveys, and they’re as important for small, growing businesses as they are for established corporations. When you’re creating a customer survey, whether it’s for the first time, or something you do each year, it’s helpful to understand what to expect. What is a good survey response rate? What are best practices for customer surveys? What is the competition encountering?
We’ve collected customer survey statistics to help you understand the customer survey landscape. Whether you send out a standard survey via email or leverage the Net Promoter Score question in-app, knowing some statistics and trends can help you ensure that you get adequate feedback that helps build your business.
Customer Survey Statistics You Need to Know About…
Hearing from Customers
- The average business hears from 4% of its dissatisfied customers. (Source: “Understanding Customers” by Ruby Newell-Legner via Help Scout)
- For every customer who complains to a business, 26 other customers don’t voice their feelings. (Source: White House Office of Consumer Affairs via Help Scout)
- 95% of customers share bad experiences with others. (Source: Zendesk)
Asking for Feedback via Customer Surveys Statistics
- Monday is the best day to get the highest amount of complete email surveys for B2B businesses. (Source: CheckMarket).
- For B2C companies, there is not a best day to send surveys: Tuesdays, Wednesdays and Fridays all lead to a relative high response rates and Thursdays and Sundays can better be avoided. (Source: CheckMarket and SurveyMonkey)
- The average response rate for email surveys is roughly 24.8%, according to a calculation by FluidSurveys.
- The average response rate for telephone surveys are in the 8-12% range (Source: FluidSurveys)
- Response rates can soar past 85% when the respondent population is motivated and the survey is well-executed. (Source: People Pulse)
- Response rates can also fall below 2% when the respondent population is less-targeted, when contact information is unreliable, or where there is less incentive or little motivation to respond. (Source: People Pulse)
- Best practice is to keep your survey as short as possible. Data suggests that if a respondent begins answering a survey, there is a sharp increase in drop-off rate that occurs with each additional question up to 15 questions. (Source: SurveyMonkey)
Responding to Feedback Statistics
- It takes 12 positive experiences to make up for one unresolved negative experience. (Source: “Understanding Customers” by Ruby Newell-Legner via Help Scout)
- Resolve a complaint in the customer’s favor and they will do business with you again 70% of the time. (Source: Lee Resources)
- The quality of your email response matters just as much-if not more-than timeliness. (Source: “Email Customer Service in North American Small and Medium Businesses” by BenchmarkPortal, 2005)
Net Promoter Score (NPS) Survey Statistics & Benchmarks
- Entelo saw 2x response rate using in-app NPS surveys versus email. For example, when Entelo, a recruiting software, first began to use in-app NPS survey, their response rate quickly jumped from around 24 percent to around 60 percent, before leveling off at about 50 percent. (Source: InMoment)
- The average American company scores less than +10 NPS, while the highest performing organizations are situated between +50 and +80. (Source: Reichheld via CheckMarket)
Get the ebook, The Modern Guide to Winning Customers with Net Promoter Score. Learn how to modernize your NPS program for growth and higher loyalty.
- The top 10 NPS leaders (those with the highest NPS scores) are USAA Insurance (80%), USAA Banking (78%), Costco (78%), Apple – Laptop (76%), Dillards (75%), and Nordstrom (75%). (Source: Customer Guru)
- Fortune 500 companies such as Delta Air Lines, General Motors, Zappos, Lego, and Procter & Gamble all use NPS to help gauge customer happiness. (Source: Net Promoter System)
Thinking Beyond Customer Surveys
While surveys remain a great way to learn about the experiences you are providing your customers, you are more than likely only hearing from 10% of them. To understand the other 90% companies are moving to a more integrated feedback signal approach to their customer listening. With InMoment’s Integrated CX, companies are now able to easily combine, analyze and act on multiple signals (i.e. surveys, phone/chat transcriptions, social, CRM notes, etc..) to improve CX.
WHITE PAPER
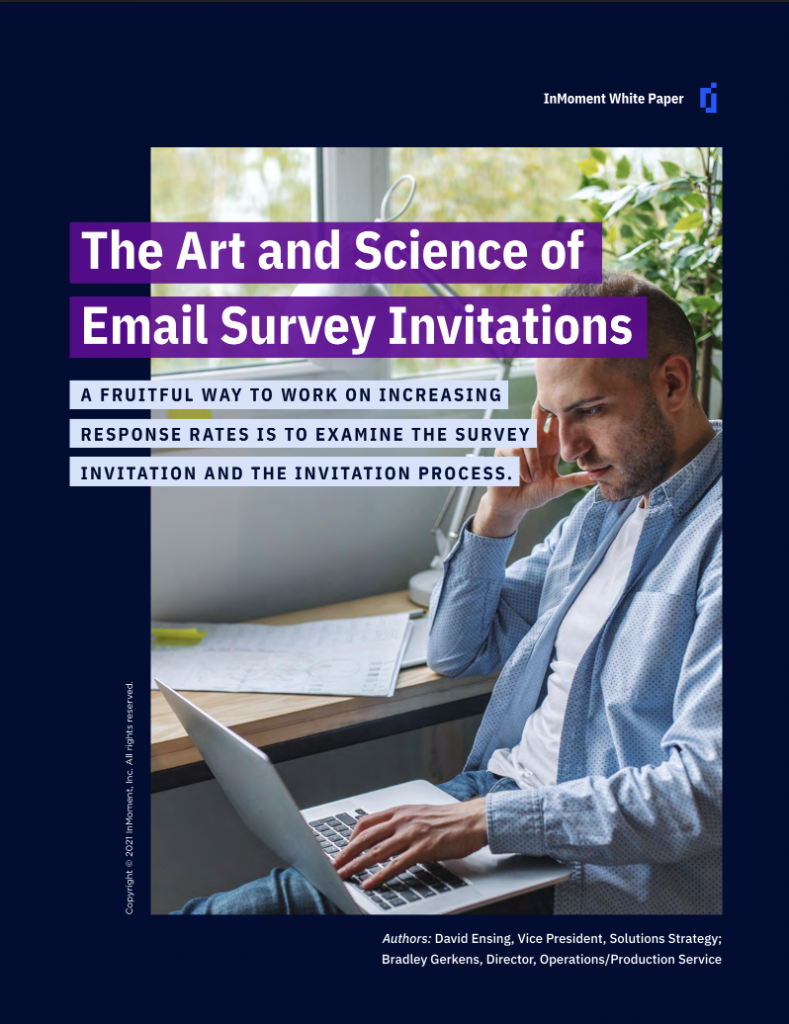
The Art and Science of Email Survey Invitations
The problem with your survey response rate may not be the survey itself. In fact, most non-responses are due to people not participating in the survey at all. Hence the question: what is in an invitation?
If you are looking for technical and non-technical solutions to create the ultimate e-mail survey invitation, look no further. Take a step towards higher response rates by downloading the document below!
Start measuring Net Promoter Score with InMoment.