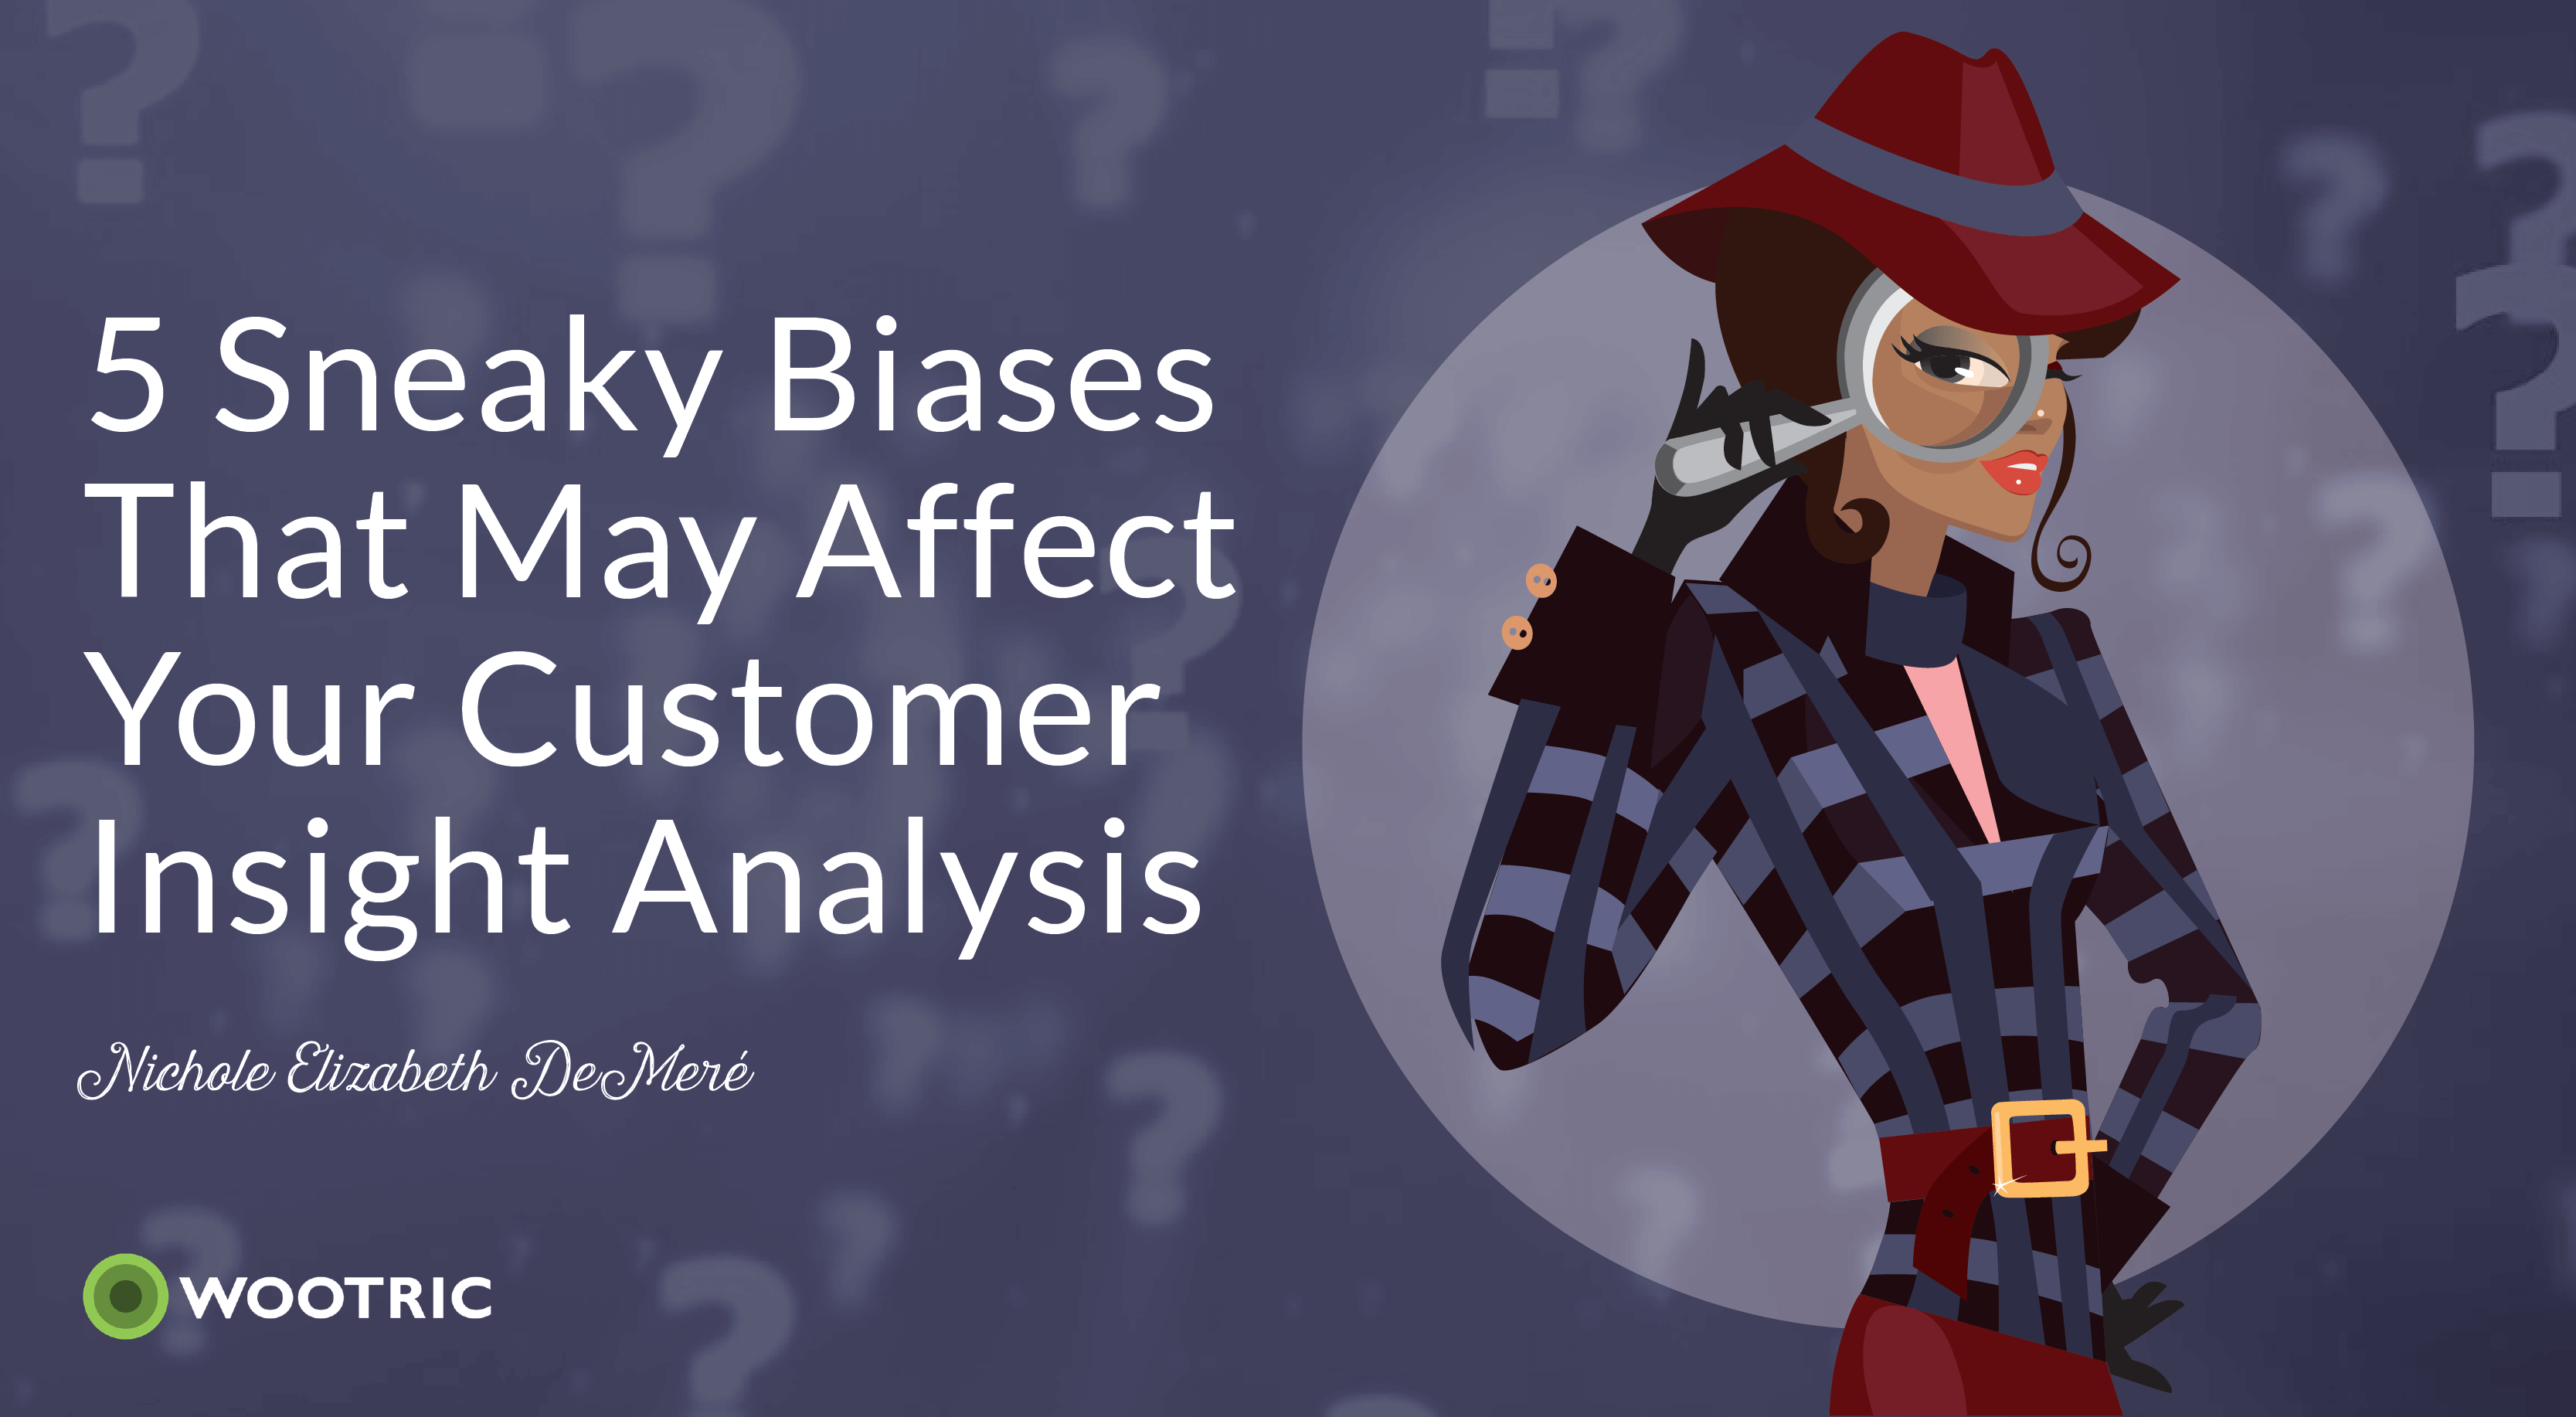
5 Sneaky Biases That May Affect Your Customer Insight Analysis

Data is the beating pulse of business, but customer data is more like DNA. Customer data, if we’re using it right, directs how we grow and what we develop. But what happens if that customer data becomes corrupted by our own bias?
We can’t grow or develop in the ways we need to.
But what is bias exactly? Where does it come from?
The most prevalent bias is, perhaps, confirmation bias – seeking out data that confirms our existing beliefs.
In an early study of confirmation bias, young children were asked what features in a sports ball are important to the quality of a player’s serve. Some said size, others said material, some dismissed color as a factor – but once they’d made up their minds, they failed to acknowledge evidence that was contrary to their theory – or explained away evidence that didn’t fit.
But what’s worse, especially for those of us using data to steer our businesses, is that confirmation bias caused them to not generate alternate theories unless someone asked them to. They missed exploring and finding other possibilities.
There are other types of bias too, including:
Algorithmic bias – When the data used to teach an AI machine learning system reflects the implicit values of the humans involved in collecting, selecting and using that data. You might remember the 2015 uproar around Google’s image recognition AI algorithm that auto-tagged photos of black people as gorillas? Yes, that happened. And in 2009, Nikon’s image recognition algorithms consistently asked Asian users if they were blinking.
Survivorship bias – When the data analyzed only comes from success stories.
Sample bias – When the population you collect data from doesn’t accurately reflect the population you’re trying to learn about.
Avoiding bias when gathering, analyzing and acting on data is impossible. Bias creeps in with assumptions, instincts, guesses, and ‘logical’ conclusions – and mostly, we don’t even know they exist until someone without those particular biases point them out.
But, while we can’t escape biases, we can try our best to account for them when we collect, analyze and interpret data.
“The greatest obstacle to discovery is not ignorance – it is the illusion of knowledge.” – Daniel J. Boorstin
How to fight bias in your data
In Forrester’s The illusion of insights recording, Forrester Vice President and Research Director Sri Sridharan makes three recommendations to reduce bias in data.
She says to “triangulate insight” by using multiple methods of arriving at an insight, and cross-validation. For example, pairing behavioral data with feedback from customer surveys to see if you arrive at the same or similar answers.
Her second piece of advice is to create a “self-correcting system of insights” that connects customer data with an effective action to create a closed loop of action, learning, and optimization. Essentially, this means testing the data by taking action and iterating based on how well you succeed in addressing the issue.
Tracking a ‘North Star’ metric like NPS or CSAT over time can be very helpful in confirming whether the changes you make are having the desired effect.
Sri’s third piece of advice is to “show your work to build trust” both internally and with customers. Your customers will be quick to correct you if your insights don’t hold true for them – and you have the bonus of showing them how hard you’re working to make sure they have what they need to succeed.
But there is also the potential for bias to happen before any of these fixes can be made – especially in Customer Discovery.
Bias in Customer Discovery, Before You’ve Even Gotten to the Data
Bias in whom you ask
Who you survey, interview or meet with can bias your results. This is called “sample bias” – but it can also turn into confirmation bias. Sample bias happens when some members of the intended population are less likely to be included than others. Think of all of the different segments of users you have – what would happen if you only surveyed one of those segments? You would get responses that don’t work equally well for all of your customers.
This can slide into confirmation bias if the population you select is more likely to give you the answers you want to hear.
And, there’s also the risk of “survivorship bias,” if the people you’re surveying are the customers who are still with you, rather than the users who have churned. Current users are much easier to collect data from, and while they can give you important insights, they can’t tell you why your churned customers left.
Bias in how you ask
How you frame questions can have a dramatic effect on the responses. In fact, by the wording you use in a survey, or even your tone of voice in a phone interview or facial expressions in an in-person interview, you can effectively steer the conversation to deliver exactly the answers you’re hoping to hear. Many of the words we use have positive or negative associations that cause people to react accordingly.
Biased question: How much do you like the color blue? (This presupposes they like the color blue at all)
Unbiased question: How does the color blue make you feel? (A much more neutral phrasing)
Or, if you aren’t specific enough about the information you want, you risk confusing your respondent and getting answers that aren’t at all helpful. Unless you have a professional market researcher on staff, you may want to stick with established questions like NPS and CSAT.
Bias in what you ask first – and last
The order of the questions you ask can also bias your results, and you’ll need to review your question order carefully to make sure the sequence doesn’t cause biased responses. Typically, you should ask general questions before specific ones, ask positive questions before negative ones, and ask questions about behavior before questions about attitude.
Bias in when you ask
Holidays and the summer months, when families often take their vacations, can be problematic for both response rates and sample bias. For example, if you send a survey during religious holidays, you’ll likely get different responses rates from different groups of people, who may or may not be taking that time off. Be aware of your timing, including if you’re sending surveys during deadline rushes, before or after holidays, or other significant patterns that may affect who responds and how they respond. To be on the safe side, don’t send your survey at the same time every year – send a few, at different times, to get the most accurate feedback.
Objective Data Leads to More Accurate, More Valuable Insight
Sherlock Holmes famously tells Dr. Watson that he never forms a theory before he gathers all of the facts. But he’s much better at disassociating himself from the results than most of us are (and he’s fictional). Bias has a way of seeping into our results, and how we view and react to our results. But, when we put bias-countering measures in place, like gathering data from different sources, using different types of data, and checking our work through a process of action and iteration, we can get to the truth in the end.
Get immediate insight from comments using text and sentiment analytics.
Learn about Wootric CXInsight™

