Understanding the Sample Size Formula

There’s a lot that goes into creating statistically sound research, but few elements are as important as getting the right sample size. This is because the size of your sample can have a direct impact on your findings. If your chosen sample is too small, your results will likely be inconclusive. On the other hand, overly large samples can make minor differences appear statistically significant while also increasing the time and resource demands of collecting and cleaning the data.
Unfortunately, understanding the need for correct sample sizes and understanding how to select the right sample sizes are two different issues. For effective sample size determination, many researchers rely on the sample size formula.
Here, we’ll walk you through the sample size formula and how to apply it. But first, let’s take a look at what “sample size” means.
What Is a Sample Size?
Sample size is a term used in research and statistics that defines the total number of subjects, samples, or observations included in a survey or experiment.
For example, if you were to interview 50 travelers about their air-travel experience, then your sample size would be 50. Similarly, an experiment that makes daily observations regarding soil content over the space of one full year would have a sample size of 365. And if an online survey were to return 11,328 completed questionnaire forms, then that’s a sample size of 11,328. Simply put, the sample size is the number of samples you’re interacting with.
Sampling allows researchers to select a representative portion of an entire population; to expand on one of the examples provided above, an airline that chooses the right sample group can hopefully draw meaningful and accurate conclusions from interviewing 50 travelers, instead of having to interview every traveler who flies on a plane.
As previously addressed, sample size plays a key role in any statistical setting—from lab experiments to employee surveys—and is a vital factor in any research project.
What Is the Sample Size Formula?
The sample size formula is a calculation for determining what sample size is appropriate to ensure that the test has a specified power. To do this, we must first calculate the sample size for an infinite (or unknown) population, after which we will adjust our sample size to fit the required finite (or known) population.
Sample Size Formula: Infinite Population
S = Z² x P x (1 – P)M²
Adjusted Sample Size Formula: Finite Population
Adjusted sample size = (S)1 + (S – 1)Population
In these formulas, the variables are expressed as follows:
- S = The sample size for an infinite population
- Z = The Z-score (determined based on the confidence level)
- P = The population proportion (assumed as 50%)
- M = The margin of error (typically taken as 5%)
Applying the Sample Size Formula
The formulas presented above may be used to correctly determine viable sample sizes, but before that can be put to work, the values of the various variables need to be defined.
To correctly apply the formula, follow these steps:
- Determine Your Key Values
The primary key value in this equation is the total population size within your target demographic. Where possible, be as accurate as you can in determining the population number—this will allow for greater statistical impact, particularly when dealing with a small population size. That said, larger populations may allow for some approximation (such as rounding to the nearest hundred or thousand). - Determine Your Margin for Error/Confidence Interval
Although you want your study to be as precise as possible, it will never be completely accurate. Understanding how much error can be allowed in the study is essential to correctly presenting your findings. This is called the margin for error and is usually represented as a percentage detailing how close the sample results should be to the true value. Smaller margins of error produce more accurate results, but also require larger sample sizes. The margin for error is typically expressed in results as a +/- followed by the percentage. - Set Your Confidence Level
Similar to the margin of error, the confidence level describes and measures how certain the study is about the accuracy of the sample’s representation of the total population. This is expressed as a percentage, with a higher percentage indicating greater confidence; most studies try to operate within the 95%–99% confidence range—less than that could cast doubt on the validity of the results. - Specify the Standard of Deviation
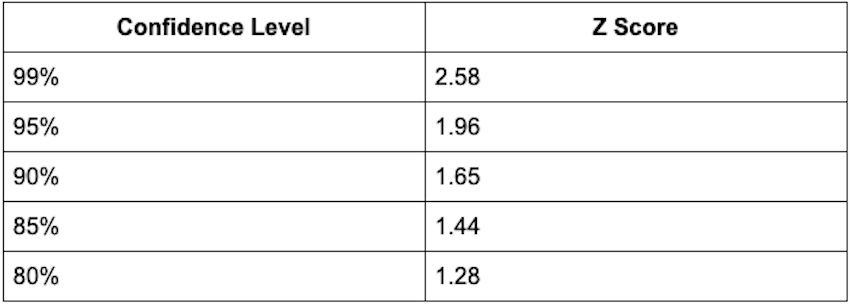
The standard of deviation details how much variation you can expect from the results of your study. Will the results be very similar, or are they likely to be spread out? Extreme answers where there is a high deviation are often more accurate. It’s generally accepted that a standard deviation of 50% will help ensure a large enough sample size to correctly represent the population within the margin for error and confidence level. - Determine Your Z-Score
Finally, the Z-score is a constant value showing the number of standard deviations between the average/mean of the population and any specific value. The Z-score corresponds directly to the confidence level, with the most common confidence levels corresponding to the following Z-scores:
Conclusion
Determining your sample size is the first step in any market research project. Whether you decide to use systematic sampling, simple random sampling, or are looking to alleviate voluntary response bias, you’ll need to identify your sample size before you can take those actions—and improve experiences!
