“What grade did you get?”

Do you remember getting asked that question in grade school? Or maybe you were the one asking it? Humans like to know how they’re doing compared to everyone else.

This carries over into customer experience as well. At Wootric, we advise companies on setting up an effective Net Promoter Score (NPS) program. We get asked questions about NPS industry benchmarks all the time.

In general, we believe focusing on an external NPS benchmark is not incredibly helpful.

The Net Promoter System is the quantification of customer loyalty and the process for improving it over time. The power of this system lies in the analysis of feedback and the action taken based on that analysis.

However, net promoter score benchmarks are still useful in certain cases, which is what this article is all about.

If you’re unfamiliar with NPS, here’s a quick rundown:

Net Promoter Score (NPS) is a customer loyalty metric between -100 and 100 that captures the propensity of a company’s customers to attract and refer new business or/and repeat business.

NPS also stands for the Net Promoter System®, which was built around the Net Promoter Score. It is a model that ties a corporation’s bottom line to customer happiness and loyalty.

Get the ebook, The Modern Guide to Winning Customers with Net Promoter Score. Learn how to modernize your NPS program for growth and higher loyalty.

In the NPS survey, customers rate their likelihood to recommend your company on a scale of 0-10. To get your Net Promoter Score, take the percentage of people who are happy and willing to recommend your product or service (those who respond with a 9 or 10) — “promoters”– and subtract the percentage of people who would not be willing to recommend your product or service — (score of 0-6) “detractors.”

NPS Calculation

For example, a +50 NPS means that the company has more than 50% promoters and less than 50% detractors, so generally an NPS score of +50 is, indeed, great! You may see scales out there that say +30 is a decent score, and that +80 or greater is the ultimate dream score.

To learn more about NPS, get the ebook, The Modern Guide to Winning Customers with Net Promoter Score, which teaches how to modernize your NPS program for growth and higher loyalty.

Net Promoter Score industry benchmarks

There are two different types of NPS: absolute and relative. Absolute NPS refers to the NPS in and of itself, and comparing the score with what is generally considered a “good” or “bad” score. Relative NPS is taking into account the average NPS within an industry, which takes into account the factors that could affect an average Net Promoter Score, and can change the NPS benchmarks you set.

While an absolute NPS goal is nice and simple, it can be helpful to take a look at what others in your industry have been able to achieve, since every industry is different and has unique relative NPS results. The relative Net Promoter Scores generally achieved in each industry help construct what are called the NPS industry benchmarks. NPS Industry benchmarks give you a way to evaluate your NPS relative to your competitors. They help control for factors that often create major differences in what is considered a good NPS score.

Oftentimes, other companies in your industry have established an average NPS for you to use as a net promoter score benchmark. If you make smartphones or other tech hardware, for example, companies like Apple have been tracking NPS for years.

To get averages and examples from your industry, try reports from the Fortune 500.

NPS Benchmark variance between industries

Let’s take a look at some examples of net promoter score benchmarks according to your industry.

Let’s say you have an NPS of +50. As we explained, that’s already pretty good! But if you’re a department store or specialty store, you are actually below the NPS benchmark (+62) for the industry.

Walmart pharmacies have an NPS score of +32. Considering the highest score is +100, you’d guess that they’d be lukewarm with this score, but I’m sure that the folks in charge of customer experience there are actually ecstatic. Walmart pharmacies have one of the highest NPS scores within the drug store & pharmacy industry.

Compare this number to the software industry, where +34 is the average. Becoming a leader in the software industry would mean having an NPS in the +60 range, like Salesforce (+66) and Adobe (+62).

If I tell you that the industry average NPS for laptop computer manufacturers is +43, can you guess what Apple’s NPS is? Consider their brand reputation and customer loyalty…

In 2018, Apple’s laptop product team reported an NPS of +63. You probably got pretty close, since you knew the industry average! This is why relative score comparison by industry is more useful than evaluation based on an absolute scale.

Caveats for using NPS industry benchmarks

Unfortunately, NPS benchmark programs aren’t always as helpful as you’d hope. This comes down to the nature of surveying for feedback. There are so many contributing factors to an NPS benchmark, such as:

  • Which channels you use to survey customers
  • Demographics and habits of your customer base
  • Customer tolerance levels
  • The size of your competition
  • The difficulty of building brand loyalty
  • External circumstances (such as a global pandemic)
  • When and how often you ask
  • Whether you have enough data to be statistically significant or not

All of these factors can have varying effects on your overall NPS score. For example, your competitor may ask the NPS question within the context of a longer annual brand survey, while you survey using just the NPS question after a transaction. These will have different consequences for the feedback you gather. If you don’t have enough feedback coming in, your NPS may vary significantly from quarter to quarter or month to month.

Bear in mind, a ‘good NPS score’ doesn’t just depend on your industry, since it’s not difficult to game the system. It’s not always fair to compare your NPS score to another company’s NPS score because you don’t know their survey methods, or their employee compensation plans.

When competitive individuals are incentivized based on NPS score, things can get ugly.

A motivated person or company could improve their numbers by letting their customers know that positive feedback would mean a lot to them or by only showing the survey to customers who are positively inclined. They might offer incentives to customers to complete the survey. Clearly, the feedback received from these methods will lead to an inflated NPS score that is not a useful comparison for those using a more objective survey process.  

Setting an NPS goal if you don’t have a benchmark

If no Net Promoter Score benchmark exists for your industry, benchmark against yourself.

The great thing about NPS is that it is an actionable metric. It’s a number that you can rally the company around as a north star to guide improvement efforts.

“A good NPS score is one that is better than the last.”
– Jessica Pfeifer, CCO & Co-founder of Wootric

Remember, NPS isn’t just a score. It’s a system that’s meant to drive business improvement in product and customer experience. It helps you identify and close the loop with unhappy customers and solve their specific problems in real time.

Your goal is to boost customer loyalty and retention, and that happens by reading verbatim comments to understand the why behind the scores you receive. By making changes based on customer feedback, and responding quickly to detractors, you will naturally see your NPS improve. And gains in NPS correlate with revenue growth.

How to report NPS

After all this, you will want to report numbers to the rest of the team on a regular basis. NPS should be shared along with other monthly or quarterly metrics like revenue, new customers and customer churn.

We understand that, so here’s what we recommend:

  • Instead of fixating on your score in the absolute sense, we recommend focusing on improving your score over time. Understand NPS as a trend over several periods, like if you were looking at a stock’s price.Trends-NPS-with-SaaS-segmentation
  • Determine the business goals of your NPS program, then report NPS in relation to the goals. For instance, if you are trying to improve retention, report NPS alongside churn data.
  • Pay attention to trending topics in your verbatim responses. Reporting these topics will help everyone understand what’s important to your customers, and the pain points they experience. Share what customers love and what they don’t love about your company with internal stakeholders. Then you can work to make those points as frictionless as possible. 

Note: For startups, be sure to read and respond to every single comment. As you grow, you’ll start needing aggregate and to pull themes from customer comments. To automate that process, check out AI-powered text and sentiment analysis.

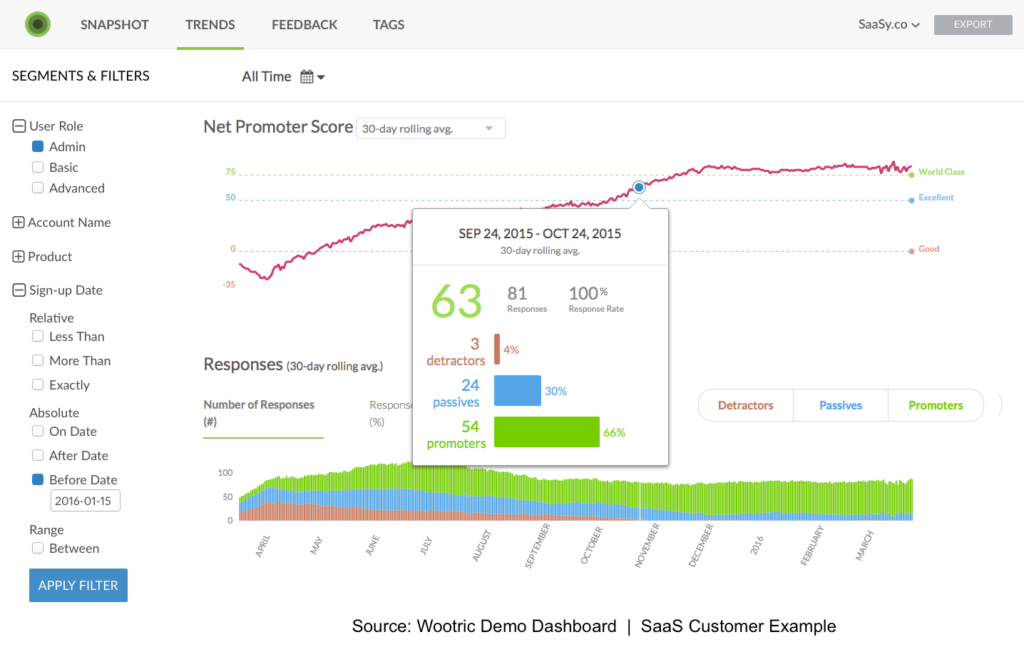
  • Segment your Net Promoter Score by relevant customer groups. For example, this could be by user role (in the SaaS example above), geography, or size/frequency of purchase–whatever drives your business. This will help you pay close attention to groups that are critical to your business success. Learn more about segmentation here.
  • If you want to compare your score to a competitor, choose a company in your industry that you admire and use their score as an aspirational benchmark. Many companies have volunteered their NPS scores to research and reports such as this one by the Fortune 500.

Measure NPS and work to improve it over time.  Dig into customer comments and close the loop with customers. You will learn their needs, and their pain points, and have plenty of guidance to make those improvements. Both your NPS and your customer retention rates are sure to improve. 

Sign up today for free Net Promoter Score feedback with InMoment.

This is an article written by MaritzCX in which the nature of survey questions are examined and connections to business results are illustrated. 

The placement of certain key survey questions – particularly the overall satisfaction question in a customer satisfaction questionnaire – has been extensively debated among academics, suppliers, and clients.

The point of view of MaritzCX is outlined below, results from discussion in our Research Leadership Council sessions, our Marketing Sciences Department, a review of relevant academic literature, and a limited amount of side-by-side testing.

Importantly, no overwhelming body of evidence indicates whether the key metrics in a survey, particularly questions like the overall satisfaction question, should come first (before the attributes) or last (after the attributes). Some studies have shown that the overall-last design produces higher relationships (R-squared) between overall satisfaction and the attributes, presumably because the preceding attributes influence the overall satisfaction measure through context effects. In fact, some suppliers recommend this “overall last” design for just this reason.

MaritzCX has the opposite point of view: We recommend the overall-first design to achieve the least-biased, best estimate of the real level of satisfaction that exists among a company’s customers.

Here is the rationale:

  • The goal of marketing research is to interview a sample of people in order to understand the entire universe of those people; for example, interviewing a sample of customers to represent all of the company’s (un-surveyed) customers. The goal is not to change customers’ perceptions as a result of having participated in the survey.


  • In any survey design, context effects from prior questions are unavoidable. The best survey designs eliminate or at least minimize context effects on the most important variables in the study. In general, the most important questions appear earlier in the questionnaire, thus minimizing respondent fatigue and bias from prior questions.


  • In customer satisfaction research, overall satisfaction is usually the most important measure in the study, the one on which compensation and other performance awards are based. Therefore, it should be sheltered as much as possible from context effects in the design i.e., placed early in the questionnaire.


  • If the overall-last design produces a higher R-squared or “driver” relationship between the attributes and the overall rating, this typically means that the overall rating is being impacted or changed by the preceding attributes. (Otherwise, there would be no difference between the two designs). Therefore, modifying the attribute battery could single-handedly produce a change in the overall satisfaction rating. Obviously, this is extremely problematic for a tracking study, in which attributes commonly change between the benchmark and rollout waves, or from year to year as company operational priorities change. Asking the overall satisfaction question first will allow clients to change the attribute battery at any time without this worry.


  • In an overall-last design, if the satisfaction rating is changed by preceding attributes, it may not have the same linkage to downstream customer behaviors (e.g., loyalty, advocacy) and/or business results that exists in the true customer universe. Thus, any modeling analyses undertaken could be mis-specified.

For these reasons, asking the overall question before the attributes appears to be the best under either scenario: If there is no context effect, then overall-first makes sense because it is less subject to respondent fatigue. If there is a context effect, then the overall-first design creates the least-biased, most stable and useful measure of overall satisfaction.

The preceding discussion applies to new studies, with no need to match prior historical data. For an existing study with an overall-last structure already in place, any potential advantages in switching to an overall-first design could be outweighed by the need to track historical trends as accurately as possible.

For more information about this article, click here.

MaritzCX believes organizations should be able to see, sense and act on the experiences and desires of every customer, at every touch point, as it happens. We help organizations increase customer retention, conversion and lifetime value by ingraining customer experience intelligence and action systems into the DNA of business operations. For more information, visit www.maritzcx.com.


Three Ways a CX Mindset can Power Your Loyalty Marketing Program

Though loyalty marketing programs and customer experience both have similar goals, it is vital that marketers recognize customer experience goes beyond the membership/incentive mindset. When you focus on customer experience, you can enrich all areas of your business
How a CX Mindset can Power Your Loyalty Marketing Program

In my last post, I discussed the expanding role of the CMO from steward of the brand to caretaker of the end-to-end customer relationship. While this transition has been recognized by various studies, it has been especially evident in my own experience as Chief Marketing Officer at InMoment. In fact, my position gives me an even more interesting and unique perspective: I have a front row seat to new developments in the marketing world and to the evolution of the customer experience (CX) industry.

Today’s marketers are increasingly seeing customer experience fall under their umbrella of duties, and it’s easy to confuse CX efforts with traditional marketing approaches such as loyalty marketing programs. However, marketers should be warned that this is a place where “similar” definitely does not mean “equal.”

Loyalty marketing programs refer to a company-wide initiative that is focused on growing and retaining existing customers by selling them more. CX programs help businesses understand the customer/brand relationship and what makes the customer loyal to the brand in the first place. The key difference between the two is in their approach: loyalty marketing is selling—often through incentives—while customer experience focuses on the ongoing conversation with the customer to then drive a deeper sense of loyalty.

This is where a traditional approach to loyalty programs goes wrong: At the end of the day, your customers don’t want to be bought with coupons, infrequent freebies, and discounts. While they appreciate them, they aren’t what makes them loyal. Customers want to feel valued and heard. If you look through the lens of customer experience, you can reset your loyalty marketing programs to take a more holistic, relationship-centric approach that will truly impress your customers.

Here are three specific ways a CX mindset can help you take your loyalty program to the next level:

Craft a Consistent Experience

Each year, InMoment surveys both brands and customers to unearth the latest trends in customer experience. The 2018 CX Trends Report revealed that consumers across all industries are creeped out by the way companies use their personal data and are therefore more reluctant to share that data. This can be a massive problem for loyalty marketing programs as they require customers to enroll by sharing some form of personal data. So how can a CX mindset help you solve this possible customer objection? One word: consistency.

Customers need to know that they can trust your brand from the get-go. If they’re receiving mixed messages in policy, employee interaction, or overall experience, they aren’t going to know what to expect and will be less likely to trust you with their information. If you approach this problem with a CX mindset, you know that you need to dedicate resources to unearth areas of brand inconsistency so you can streamline, hire, and train appropriately and put the best foot forward before asking for customer data.

If customers have a great impression of who you are as a brand, their positive and consistent experiences will inspire the trust they need to join your loyalty program.

Provide the Right Perks

Though perks alone won’t drive true brand loyalty, they are incredibly necessary to provide what customers expect when they sign up. However, your efforts can be all for nought if you aren’t providing the right incentives.

According to that same CX Trends report, customers are less likely to share their info when a program simply offers to make interactions easier, more efficient, or to deliver personalized recommendations. What they do value is when they receive exclusive access to sales, events, or products. Essentially, today’s customers are more willing share their data if they are given the VIP treatment.

The listening capabilities of a CX platform can help you to further narrow down what perks really drive participation in your loyalty programs.

Focus on Relationships, Not Memberships

Sure, customer satisfaction is a short-term win. After all, if a customer was able to purchase the product or service they were looking for, they might be more willing to become a loyalty program member. But why stop there? When you provide excellent brand interactions over and over again, you have a customer that will come back, buy more, and recommend you to others. That is the kind of customer you create when you focus on relationships and loyalty over merely satisfaction.

The key to going beyond “good” and creating excellent experiences is emotion. When InMoment studied unstructured customer data, we found that when discussing memorable experiences, most customers concentrated on the interactions they had with brand representatives and, even more importantly, the emotions they evoked. Ultimately, it’s not the 20% off coupons that inspire emotional experiences, it’s the meaningful human interactions that keep customers around in the long run.

With customer experience, you can go beyond collecting loyalty members and utilize emotion  to create lasting impact.

Though loyalty marketing programs and customer experience both have similar goals, it is vital that marketers recognize customer experience goes beyond the membership/incentive mindset. When you focus on customer experience, you can enrich all areas of your business—including your loyalty program—by understanding your customers, evoking positive emotions, and fostering long-lasting relationships.

To learn more about what customers expect from their brand interactions, check out the 2018 CX Trends Report: What Brands Should Know About Creating Memorable Experiences!

Do you have a data silo problem?

  • Do customers complain of having to explain everything about their business to sales, and then to customer success, and then again to customer support?
  • Is customer support hearing about the same issues, over and over again, that aren’t being addressed by product?

Those are just two of the most frequent symptoms of data silos. Here are some more, reported to us by our friends at Segment.

  • Inability to answer complex questions about your customer journey.
  • Inability to quantify the impact of a given campaign against down-funnel, often offline conversations (like Salesforce lead status updates).
  • Inability to affect targeting criteria in a given channel based on interactions that occurred in another (ie. you’re spamming users across channels when they’ve already converted or signaled their preferences in another.

What do all of these silo symptoms have in common? They all damage customer experience, and they all result from data not being shared between teams and departments.

Three main causes of data silos

Data silos are isolated islands where information sits, visible to just one or a few people. Usually, the cause of data silos isn’t some greedy information hog, unwilling to let anyone see his or her hoard of numbers. It’s nothing so Dickensian. Here are the main reasons they exist.

  1. Structural

Businesses that have been around through multiple owners, leaders and ideologies typically have incompatible systems in place from various eras and incarnations. Older software or apps that haven’t been updated or replaced probably don’t play well with others. Whereas newer data collection and analysis programs have built-in capacities to share information with other apps, older systems don’t. Or, they don’t do it automatically. If no one is tasked with disseminating the information, it doesn’t get shared.

  1. Social

Maybe teams aren’t rewarded for sharing, or required to share information. Or, maybe there is a data hoarding person or group who keep data to themselves to maintain a sense of power and control. But usually, it’s a case of ‘this is the way we’ve always done it’ resistance to change. Having a ‘silo mentality’ in your business makes it difficult or impossible to quickly spot opportunities and take advantage of them, because when information isn’t shared, you can’t make fast, informed, data-driven decisions.

  1. Vendor lock-in

Maybe it’s not you, it’s them. The software vendors. Yes, even software-as-a-service applications can effectively ‘trap’ businesses within their platforms by requiring heavy investments in special training, or they may lack native integrations or an open API. In either case, they make it difficult to switch information over to other apps.

Breaking down these data silos requires a lot of effort and commitment. Structural causes require an overhaul of all or most of your existing systems; social causes may take a company-wide initiative to improve company culture; and vendor lock-in-related causes are, by nature, tricky to remedy.

So before we get into how to break down data silos, let’s look at why it’s worth all of the time, effort, and investment.

What you stand to gain by breaking silos down

One of the biggest threats data silos pose to companies is blocking customer success. Customer success depends on everyone in the company being aligned behind the same data-informed vision of the target customer – their needs, wants, challenges and desired outcomes.

But that alignment depends entirely on sharing information across the entire organization, not just once, but continuously, to facilitate collaboration between sales, marketing, customer success and customer service (at minimum). When customer-facing departments run entirely separately from each other, it’s the customers who pay the price.

When customers run into trouble, they have to repeat themselves as they’re bounced around from agent to agent.

If a loyal customer was unhappy with the last order, s/he will feel pestered and aggravated when a clueless sales rep tries to upsell them.

Of course, it’s not only customers who suffer – nobody benefits from data silos! A 2016 brief from Forrester observed the high rates of “misaligned performance metrics, lack of clarity around lead scoring (and definitions)” and other misunderstandings between marketing and sales that leaves “sales ops in the middle to make sense of the chaos.”

Another Forrester statistic is “less than 1% of leads in B2B ever become customers,” which means businesses are wasting money on marketing that doesn’t work, salespeople are wasting time on leads that will never convert, and – when you have data silos, marketers might not even know what they’re doing wrong.

With some types of data, sharing is even more important because so many departments stand to benefit from having easy access to it. Voice-of-customer data, for example, is a must-have for marketing (for testimonials, ad/sales page/email copy, content ideas), sales (for upsells), and product (to optimize features).

The bottom line is: Breaking down data silos is an absolute requirement of creating the customer-centric culture customers want and companies need.

How to break those silos

“A customer-centric culture should be the North Star and guiding principle for tearing down the silos [between marketing, sales, and customer service]… Before joining Salesforce, I spent 12 years running global engineering and also serving as a [chief marketing officer]. Silo busting was how I spent most of my time. I realized that I had to try to align different areas of the business, and the only way to do that was to silo-bust.”

– Vala Afshar, chief digital strategist at Salesforce

First, diagnose what is causing your silo problem using the 5 Whys cause and effect analysis.

5 Whys ExerciseThe idea is to find the root cause of the surface problem. The surface problem, for example, might be that marketing isn’t qualifying leads before passing them on to sales. The reason for that might be that marketing isn’t sure what the success indicators are for leads who convert. The reason for that might be because that data is stopped up – it’s kept by sales.

We’re already at the third ‘why’ question and we’ve just gotten to the middle problem of the data silo.

The answers to ‘why’ #4 and ‘why’ #5 will reveal the core cause that’s creating the silo in the first place.

Why use the 5 Whys? Because you might find that a data silo isn’t the root of the problem, or that the reason for the silo isn’t what you think it is. There may, in fact, be an underlying issue that runs deeper than investing in a new data gathering and analysis program can fix.

Second, get management buy-in.

Once you’re armed with the problems the data silo creates, as well as a thorough understanding of the underlying issues contributing to those problems, take your findings to management. You’ll need total buy-in from the top to address those deeper issues and find a data-busting solution that works perfectly for your company.

To get that buy-in, you’ve got to present a strong case that freely shared information will help each individual department, and the entire organization, essentially offering them a unified vision. In addition to bringing up current problems free-flowing information can fix, also consider how it can aid your company’s long-term goals and department objectives.

Third, align behind your North Star (the customer)

It’s not going to be easy to change long-standing habits in your organization, so to do it successfully, you’ve got to have whole-company alignment behind the real purpose of your proposed changes: The customer.

Your customers will tell you what impact your changes are really having. But, you need a metric to track, so everyone can see that breaking down silos (and all the work and training that go into it) are worth the effort.

We call this a “North Star metric,” like Net Promoter Score (NPS). When you see NPS scores rise, proving that customers are indeed happier (so happy they’re willing to recommend you to a friend or colleague), it’s proof positive that what you’re doing makes a difference.

Fourth, find the right tools.

Better tools lead to better collaboration, and what you’ll want to look for are data gathering and analysis tools that integrate with your CRM software (which will also solve the vendor lock-in problem, if that’s the source of your silo).

This is going to be your “single source of truth” database. Salesforce is a perfect example.

It’s key to make sure that data is shared with various functional systems of record so everyone has what they need at their fingertips. At Wootric, for example, we sync customer/prospect data from our product, Intercom (for Success) and HubSpot (for Marketing) to Salesforce – and from the Wootric survey platform, we integrate with Slack, Intercom, Salesforce, and HubSpot.

For us, this means:

  • The way we put NPS into Intercom so that if a customer reaches out about a conversation, someone can see the entire history of that customer.
  • You could have a different conversation with a promoter than someone who ‘dinged you’ the last time – having that context shifts the conversation.

Segment Product Manager Chris Sperandio says customers come to his company for better alignment through data.

The key is the desire to align all of their departments around a shared customer context. The way they achieve this is ensuring each department’s tools are running on a common data set. This way, they can run more cohesive campaigns and they can operationalize their insights and predictions.

Fifth: Invest in cross-functional training – together.

Once you have diagnosed your core problems, obtained management buy-in, and choose a metric that measures progress, and have the right tools – it’s time to bring everyone together for training.

Not only will everyone need training on how to use the new tools, they’ll also need training on how they can best work together to create better customer experiences through sharing information. Silo-busting is a multi-team effort, but when teams have traditionally been kept separate and sovereign, it can be a challenge to build bridges and relationships.

Try hosting a meeting with everyone to establish a shared understanding of each team’s goals, challenges and pain points.

Then, have everyone get together to find areas where insights and abilities from one person can help another person with their challenges and goals.

Finally, have everyone fill out a “communication builder” questionnaire that asks:

  • Basic contact information: phone/email/Slack etc.
  • What is their job title/function?
  • When and how do they prefer being contacted (ie. by phone before noon, or via email – but not available on weekends for immediate response).

This step sets up co-workers for success by setting expectations and letting everyone receive requests and information in the way that works best for them.

Alternately, you might consider creating a cross-functional “tiger team” who ‘owns’ the progress of the North Star metric (like NPS) and has a C-suite sponsor who helps them get things done.

Collaborative training is a good start, but will need to be nurtured over time as the human tendency is to fall back into familiar behavior patterns. To help break those patterns, you might even consider physically moving people so employees from different teams work next to each other, building relationships.

Measure and improve customer experience at scale.

Get auto-tagging with InMoment customer feedback software. Sign up for a free trial.

Airport Analytics: SFO and Building a Better Delay

San Francisco International Airport is the gateway to the world's tech capital. In this installment of our airport review analytics series, we see how SFO effectively listens to its customers to guide billion dollar terminal renovations and make daily improvements.

In this series, we’ve been using text analytics to analyze the social media data around America’s busiest airports. In this installment, we broaden the scope to include Tweets as well as Facebook reviews. To begin, San Francisco International Airport is not having the greatest year. Over a six-month period, SFO had three near-miss aviation accidents, any one of which could have been “the worst disasters in aviation history” according to a Business Insider report. An editorial from the local Mercury News calling for “action” from the federal government reveals that over a 14-month timespan there were two additional near-misses. SFO has been called the “worst” airport to travel through during the holidays by the New York Daily News, and a 2012 study supposedly found that SFO was the “worst” airport in the country when it comes to delayed or cancelled flights.

Nonetheless, upon closer inspection of the airport’s social media, it’s easy to see that stopping short at occasional bad press and travel column listicles gives only a fraction of SFO’s story; to wit, San Francisco excels where many other airports in this series fall down. As an example, take wayfinding, the architectural study of how people orient themselves in physical space and navigate from place to place. Airports are complex buildings to design. In premise, they must connect large, mixed use spaces through navigational cues intuitive enough to be grasped by cabin crew and children alike. Frequently however, the design falls short of effectively communicating with the subconscious. SFO is no exception, said one disgruntled traveler on Twitter in 2017: “Why aren’t there helpful signs here @flysfo?”

Social listening for airports

San Francisco International Airport actively listened to this feedback, recently pivoting a negative narrative into a positive one. “Yes, we do get comments from passengers [who find themselves lost]” said Judi Mosqueda, SFO Director of Project Management. In response, the airport allocated $7.3 million to remedy the problem throughout the 2.5 million-square-foot space. That was in January, and text analytics already demonstrates a positive customer feedback. One frequent flyer to the United States stopped by the SFO Facebook page to shower praise on the new wayfinding experience: “I find SFO to be one of the easiest airports in the USA to navigate,” they say. “Kudos to SFO for consistently providing a super travel experience!”

Sentiment surrounding SFO wayfinding trends positive over time

Building a better delay at SFO

San Francisco International, like all airports, can spark the ire of its customers when acts of nature foil schedules — perhaps more frequently than most, compliments to its fog, Karl. However, the airport aims to mitigate the stress of delays by investing in lounges, a yoga room, complimentary high speed broadband, museum installations, therapy animals, and more — all of which is represented in the topic sentiment present in the social data.

Booking-Scheduling suffers on account of frequent delays and cancellations due to weather. However, other areas, including amenities, internet, and food & drink quality trend neutral-positive, a win for the airport.

What is more, recent renovations to Terminals 2 and 3 set a strong standard for other American airports to follow. The social media data set is replete with praise for the new terminals, which boast sophisticated art exhibits, stylish seating areas, strong food vendor offerings, and evocative architectural features, with one reviewer describing the airport as “architecturally stunning.”

“Terminal 2 is probably the nicest domestic terminal in the entire country. Spacious, modern, clean and plenty of places to sit + free wifi!” says one reviewer. Another echoes this sentiment on Twitter, pointing out simply that “Terminal 2 is a class act!” Recently, a customer doubled down on this sentiment, urging SFO to begin similar renovations on Terminal 1: “Terminal 2 in SFO… best terminal by far in the USA. Can’t wait for the renovations in Terminal 1!”

While considering the design for Terminal 1’s renovation, which is estimated to be a $2.4 billion project, SFO’s stakeholders and the design firms they work with ought to dig even deeper into the text. Many of SFO’s review specifically target the airport’s facilities. A frequent target is the connector passageway between Terminals 2 and 3, or rather the lack of it. In 2009, SFO developed a connector passageway between the domestic Terminal 3 to the International Terminal. However, there is no way to navigate between the Terminals 1, 2, and 3 without exiting security. Says one aggravated guest, “I had to move from terminal 3 to terminal 1 and I had to get out one terminal and to get into the other one and I had to go through the already tedious, painful and unfriendly/brainless/rude TSA security checkpoint. Why don’t they have a way to move through terminals without passing security.” Being able to move freely between terminals, especially during a stressful delay or layover, makes a monumental difference in a customer’s experience at an airport.

Beating the competition by winning travelers

Text analytics helps airport stakeholders and travelers alike cut through the noise of editorialization by identifying the signal present within actual user data. With this technology, airports like San Francisco can better respond reactively — like in the case of wayfinding — while developing other proactive structural strategies to grow the customer base. What is more, SFO operates in a busy travel corridor where it competes with two other nearby airports, Oakland International and San Jose International, all the while protecting its market share from the behemoth in the south: LAX. This level of competition is not uncommon in the United States. As such, major airport brands need to get an edge where they can.

More from this series: airport review analytics

Series introduction: Analyzing Airport Reviews using Natural Language Processing

  1. Atlanta International has a big problem with “wayfinding”
  2. Charlotte Douglas can profit big by listening to their customers
  3. Chicago O’Hare needs to learn about viral reputation management
  4. Dallas/Fort Worth has a dirty secret
  5. Denver International may be a secret haven for the Illuminati
  6. New York’s JFK has to plan for the future
  7. Las Vegas McCarran doesn’t shy away from your vices
  8. San Francisco can teach us about listening to customers
  9. Seattle-Tacoma has a vocal customer named Jerry
  10. Los Angeles needs to master the “final mile”

Series summary: The Definitive Data-Driven Airport Ranking List

Weekends in my household are often consumed by time well spent with my wife and two young children, who enjoy everything from hide & seek and board games with crazy rules, to baseball and bike riding.  While I love these activities and the family memories they create, I too enjoy weekend time spent alone on personal projects around the house.  I call these “garag-ects”—projects generally accomplished in the garage.

Over the years, the bikes and sports equipment, toys and old ping-pong table, tools and materials have taken over my work space, each time requiring me to prepare a space to get started. It’s an unmotivating and incredibly inefficient environment, but I know that until I dedicate the time to organize the space required to tackle many garagectsin a single weekend, I will continue to lack the motivation and resources to engage in even a single item on the growing list of ‘to-do’ items.  In years past, I found myself able to fill a weekend with a list of accomplishments and was highly productive in the garage.  When I could start and complete a garagectin one sitting, I found myself entirely engaged in the process and motivated by the accomplishments each completion would bring.

Perception of Productivity Drives Employee Engagement

In this way, I have something in common with the vast majority of employees who work in any role across all types of industries and organizations.  Perhaps not just the family aspect or the growing list of projects in the garage, but the continuous intrinsic need to be productive in order to feel truly engaged.  In fact, research suggests that employee happiness and engagement at work is driven by the perception of productivity – an employee’s sense of being able to effectively execute his or her duties and role for the organization in an effective and efficient manner.  Coupled with the ability for an employee to see his or her contribution, the feeling of productivity is powerful in establishing and maintaining high engagement levels.

The social and physical environment for an employee in the workplace may be just as important as an organized garage when it comes to enabling a higher sense of productivity.  As organizations invest in employees by regularly asking for feedback and insight in order to make effective changes and promote a culture for employee-generated insights, it can be valuable to include measures that connect productivity and the outcomes of the work done day in and day out.

Bridging Concepts of Productivity with Employee Surveys and CX Measures

Many organizations are beginning to find ways to include such measurement within regular employee engagement surveys, where for example, employees are presented with specific items connecting the concepts of productivity while also bridging data between employee surveys and customer experience measures.  These items may cover processes & procedures and incentives, to goal-setting and technology, and might include items such as;

  • Our organization always acts in the best interests of our customers.
  • Our organization eliminates processes and procedures that interfere with best serving my customers.
  • Staff in our organization are given incentives to provide the best possible service to our customers.
  • My co-workers consistently think about how to better serve our customers.
  • Our organization hasformal programs and processes for improving customer experience.
  • Our organization sets specific goals for achieving and improving customer experience.
  • Our organization effectively uses technologyto deliver a consistently positive customer experience.
  • Our organization commits the resources required to exceed the expectationsof customers.

employee engagement diagram

Such measures offered to employees serve as a great way to connect traditional siloes between HR and CX Professionals who independently measure the employee and customer experience respectively and provide a mechanism for employees to weigh in foundational concepts affecting their work and the outcomes for customers.

Asking the Right Employee, with the Right Measures, at the Right Time

Another growing strategy organizations are deploying includes the use of employee experience (EX) surveys to monitor the more standard aspects of the employee life cycle.  This process includes asking the right employees, the right measures, at the right time – while they are top of mind and while the employee is most invested in a particular experience.  By measuring the initial impressions of an organization during the recruitment and hiring stages, through onboarding and acclamation, to communication and recognition, and typically ending with exit experience, an organization can identify employee-driven ideas for improving the experience in each of these areas affecting nearly all current and future employees.  These surveys can be administered in a more intelligent, automated fashion by leveraging employee record files to distribute certain survey types based on tenure, employment events (such as promotion or training) and communication processes by the organization, including quarterly townhall meetings. By including even just a single item on an employee’s perception of productivity, the organization can better identify quick wins across processes in the employment life cycle to improve this concept and engagement.

Make Sharing Experiences Easy

One other emerging trend includes the use of open-ended prompts, either as part of the regular employee survey process or as part of an open listening strategy where employees can share a story/idea at any time through a dedicated portal or open exchange.  Just as we do as customers when we experience something very positive or negative, employees also want to share their stories.  One positive and inspiring method is to provide a mechanism for employees to identify any instances where colleagues, processes, or the work environment allowed them to be overly productive and/or provide an exceptional experience to a customer.  Every employee has days where, from their vantage point they accomplish an incredible feat or series of feats in one day.  Providing opportunities for employees to share these stories will generate ideas for how to foster such productivity while recognizing employees for their accomplishments.  Such stories can even be shared publicly in electronic employee boards and in recognition mechanism across the organization to further drive engagement.

Speaking personally, I can physically feel the difference in my engagement when I’m in an environment that promotes focus and productivity.  Whether provided to me by the leadership at my place of work, or self-created in my garage, my working conditions including the processes, tools, space and people should foster productivity and be intentional in design to allow for my best work.  When this occurs, I’m most likely to remain engaged in my efforts and connected to the purpose of my work.  In my case, this means a weekend engaged in making my garage a more productive environment.

What is Empathy?

Empathy is the ability to understand and share the feelings of another. For Product Managers looking to improve customer experience (CX), that definition translates to doing more than understanding the user’s pain points, but also looking at the emotional landscape of what it’s like to use the product – when it is working, and when it isn’t working.

Empathetic Product Managers ask themselves:

  • How does using the product make the customer feel?
  • How does the customer want to feel when using your product? What would be the best possible emotional outcome for them?
  • How do I ensure the product developers understand and take the customers’ needs into consideration in their process?

The answers to those questions affect every facet of business, from acquisition to retention. It’s how, through CX, you can generate rapid growth through word-of-mouth recommendations, and sustain your success with customers who never want to leave.

Tying Empathy into CX

Empathy is a soft skill, and while those are typically difficult to measure, the effects of empathetic product development can be seen in every CX metric: Customer satisfaction (CSAT), Customer Effort Score (CES) and Net Promoter Score (NPS).

Sinead Cochrane, Senior Product Researcher at Intercom, wrote “For product teams, empathy building activities such as observing research or doing customer support is often not considered ‘real work’. However, product teams that consistently keep customer needs in mind are able to maintain and evolve their products in ways that won’t negatively impact the user experience.”

For her, empathy for product departments means “When a customer tells you something is broken, you are able to imagine the impact it’s having on the job they’re trying to get done,” and, “you realize the emotional impact the problem is having on that person.”

But I think we can go further than just recognizing the emotional impact of problems. That’s scratching the surface of what having empathy for customers can mean for producing superior customer experience.

Because empathy shouldn’t be reduced to realizing customers feel bad when a product isn’t working for them. A whole new world opens up when you also consider how you can design your product, updates, and expansions to enhance positive emotions as well.

Here are the questions that lie at the heart of empathetic product management:

  • How can you get more emotionally in sync with your customers?
  • Which are the most important negative emotional outcomes to manage?
  • Which emotions should you seek to heighten (and how?)

To answer these questions, try these empathy building exercises.

Empathy Building Exercises for Product Managers and their Teams

  1. Listen actively to discover underlying needs and emotional motivations

Often relegated to customer service and customer success departments, ‘active listening’ to find out why your customers use your product and what they really want to achieve is very important. You can’t get the depth and honesty of answers by just sending out a survey – this works much better if you do phone, Zoom or in-person interviews. In fact, Roman Pichler recommends product managers meet real users on a regular basis. You may find that your assumptions of why customers use your product aren’t accurate, or don’t tell nearly enough of the story.

“At first, our assumption was that they wanted to make more money. That often was true, but frequently we heard something different. Many simply wanted to maintain the business but run it more efficiently so they could have more free time (we heard about golfing on Fridays more than once). Others wanted to build a sustainable business they could pass on to their son or daughter.” – Jim Semick, Founder & Chief Strategist at ProductPlan

To get down to customers’ real motivations, ask open-ended questions beginning with “why” and “how.” Then make sure to record their answers in their own words (you can hand those assets to your copywriters for later use).

  1. Use your own product

Empathy is often described as ‘putting yourself in someone else’s shoes’ – and there’s no better way to do this for a product manager than to actually use the product, just like any user would. You’ll empathize with users’ frustrations as you experience your own product’s shortcomings and hopefully find moments where it’s possible to create more delight.

But always keep in mind – you are not the average user. You’ll still need to listen to your users to get a complete picture of how they feel, and what problems they perceive as being severely aggravating.

  1. Share verbatim comments

Someone, somewhere, is tracking customer experience metrics, sending out surveys, and collecting the answers. That someone might even be you. When reading users’ written responses, don’t just look for problems to solve and ignore the positive comments. Read them for emotion and see what conclusions you can draw about what people are feeling, and want to feel.

Pick a few relevant verbatim comments to bring to the rest of the product team. Reading these comments often helps engineers and designers feel the same joy or frustration as their users. This new emotional understanding will help you evangelize CX as a priority with everyone.

  1. Mine your qualitative data and quantify customer sentiment

Those open-ended response answers are a goldmine for user research that can alert you to problems – and give you hints into the customer’s emotional state of mind. However, once you are getting more than a hundred comments a month, seeing the forest for the trees can be a difficult exercise. Qualitative feedback is notoriously tough to quantify, but it is now possible and easy to quantify sentiment with the help of machine learning.

AI-powered platforms, like InMoment CXInsight™, automatically sort your customer comments into themes while simultaneously assigning positive or negative sentiment. This provides you with a big picture understanding of how customers feel about your product and why. Categories of feedback vary by business sector and business model–payment processes & delivery for e-commerce, perhaps, while UX and usability may surface for SaaS products. Quantifying the sentiment of what your customers are talking about can help you track emotional trends over time. Presenting this kind of data alongside verbatim comments connects customer emotion with real business consequence.  

Feedback categorized by theme with sentiment breakdown
Example of auto-categorized NPS comments with sentiment assigned in a dashboard. Source: Wootric

  1. Set empathy KPIs

What gets measured gets done, and adding empathy into your product development work is no different. The KPIs for empathy may look a little different than your typical performance indicators, but the good news is: They’re not difficult to get. You’ll find key performance indicators like NPS, CES and CSAT are a good start, and comments in the open-ended questions can give you insight into the metric. Start identifying what kinds of ratings and qualitative answers correlate to genuinely happy customers – and frustrated customers likely to churn.

  1. Chart out an empathy map

You’ve done your user journey, but even though it’s part of the buyer persona building process, you may not have done an empathy map.

  • What your user sees – on competitors’ websites, common visuals in their industries, maybe what they enjoy watching or reading
  • What your user says – how they measure success, what they say they want, what they say about your product
  • What your user hears – what their influencers are saying, not just about your product, but about their jobs and what constitutes success, what they enjoy, what they don’t like about their experiences with your competitors, etc.
  • What your users think and feel – worries, aspirations, what they really want, what really annoys them

Notice how the empathy map includes business/industry-specific observations, but also branches out into the user’s personal life and larger environment. People are not their jobs – or even their ‘jobs to be done.’ For true empathy, you have to look at the whole person.

This is a great activity to get other teams involved in – consider hosting a meeting with Customer Success, Sales, Marketing and Customer Service for a wider scope of insights.

Activities involving multiple teams help to build a shared understanding of your customers’ experiences that can strengthen the whole company.

  1. Add happy moments to your Customer Journey Map

You’ve probably mapped out your customer/user journey, but you probably didn’t include this: Happy moments. See if you can take your old customer journey map and mark the points where positive, fun, delightful things happen. Can’t think of any? Then you have some serious CX work to do!

And of course, also note points where you’ve observed friction, difficulties, and problems, and address those in the order of biggest impact + easiest to implement.

  1. Work in Customer Support for an afternoon

Whether that means answering the live chat questions, picking up the phone, or monitoring your product’s customer Slack channel, try out being the Customer Support agent for an afternoon to and put yourself on the front lines! There’s no better way to find problems than to let customers tell you exactly – and in great detail – what they are. And they’ll likely throw in how frustrated it makes them feel too.

  1. Build a prototype to test your emotional hypotheses

By now, you probably have a few ideas on how you can improve the customer experience, and it might be time to test those theories. Create a prototype for a select group of qualified users to try (and react to). And, if possible, have them test the prototype in a testing facility that allows you to observe their reactions as they use your product.

If there is a Golden Rule for empathy, it’s a simple one: Forget your assumptions and be genuinely interested and curious about what people are feeling (not just what they’re doing) while using your product. Empathy is a learned skill that needs practice so don’t forget to try out these empathy exercises on a frequent basis for enhanced customer experience.  

To quote Maya Angelou: “People will forget what you said, people will forget what you did, but people will never forget how you made them feel.”

Be the customer experience champion at your company. Sign up today for free Net Promoter Score, CSAT or Customer Effort Score feedback with InMoment.

Customer Touchpoints: The More, the Better for Health Insurance Providers

Omnichannel touchpoints not only provide more customer data, but they encourage relationships and, therefore, brand loyalty. This is true for all industries, but research shows having multiple options for interaction can make all the difference for insurance providers in particular.

One of the most basic ingredients for successfully improving the customer experience is actually providing opportunities for interaction. It’s simple: You can have the most sophisticated analytics in the world, but if you have nothing to analyze, it will be impossible to unearth insights that will improve your customer experience.

Omnichannel touchpoints not only provide more customer data, but they encourage relationships and, therefore, brand loyalty. This is true for all industries, but research shows having multiple options for interaction can make all the difference for insurance providers in particular.

A study of 2,000 health insurance customers found that “interaction options” is one of the three most important factors to customers when it came to choosing a health insurance provider. This finding is impressive on its own, but what’s even more surprising  is that “interaction options” out-ranked “brand” in terms of differentiators.

Additionally, the study found that customers are even willing to pay more for additional interaction options. I found this to be both validating and shocking for a few reasons. First, it confirms a belief that we have at InMoment: you need to make it easy for your customers to interact with you whenever, wherever, and however they want.

Second, there has been a lot of talk recently that digital is taking over. While that may be true to a certain extent, this study found that in actuality, customers still want the choice between digital and traditional interaction options, because they prefer different touchpoints for different conversations. For example, customers said they generally prefer digital touchpoints for simple interactions like changing contact information, but they prefer a telephone call to address larger and more complex concerns.

Of course, providing all these touchpoints can get down-right expensive and it can be challenging to provide the same level of service across a variety of touchpoints.

This is a legitimate business concern, but in light of these recent findings, it is clear that having multiple methods of interaction is a differentiator for health insurance customers. Touchpoints can be costly, but failing to provide customers with the service they want is even more risky.

Healthcare is an incredibly personal industry and choosing a health insurance provider can be especially stressful for customers. Therefore, it’s even more important to make customers feel heard and cared for, while also allowing them to reach out in the way they feel most comfortable.

To learn more about what customers want from their customer experience, check out the 2018 CX Trends Report!

Airport Series: McCarran and Las Vegas

When an airport company reviews social data they need to be able to find the signal in the noise. Airports and the cities they serve are often confusingly interchanged on social media. In this article, we use filters and a custom configuration to see exactly what people are saying about McCarran International Airport.

Pop-quiz: what do you think of when you imagine Las Vegas?

Prostitution, gambling, hotels, and recreational marijuana might come to mind. But rather than fighting these associations, Las Vegas’ McCarran International Airport embraces them.

For example, the airport has “pot amnesty boxes”, where people can dump their legally-purchased weed in the event they’re traveling to a state or country with stricter regulations. And they’ve installed slot machines in the terminal, so travelers can get a jump on their gambling.

Or, as one Facebook reviewer put it, “try for one last hurrah.”

Figure 1: A pot amnesty disposal at Las Vegas McCarran International Airport

A city and its airport

However, this inextricable link between a city and its airport can pose a problem for a business analyst. For example, we recently sourced thousands of reviews from Las Vegas McCarran International Airport’s Facebook page. While analyzing this data set we discovered an interesting phenomenon: reviews on their Facebook page frequently criticized not just McCarran International, but also the city of Las Vegas itself.

Of course, listening to natural language reviews of Las Vegas is interesting. But it’s not useful for a business analyst tasked with understanding how customers experience the airport.

Finding the signal in the noise

To cut through the noise, we configured an analysis to extract what’s being said about McCarran International Airport based on reviews that mention both McCarran and Las Vegas.

To do this, we used Lexalytics’, an InMoment company, web-based dashboard, Semantria Storage & Visualization (SSV). SSV allows any business person to create configurations and run an analysis, even if they have no previous experience with data analytics.

Figure 2: Tuning a configuration in Semantria Storage & Visualization is a simple as point-and-click

To start, we used the SSV configuration builder. We can easily train the analysis to recognize sentiment in the text data set pertaining to other brands, such as the airlines flying into the airport, or even the city of Las Vegas itself.

Figure 3: By pulling out unrelated topics we can understand how people discuss elements related to “Las Vegas” the city, like “city infrastructure,” which might be confusingly lumped into the conversation about “Las Vegas” the airport

First, let’s take a moment to appreciate how the sentiment surrounding “vice” is only positive. In Las Vegas, it seems, vice is virtue!

Now, let’s pull this apart. In this data set, many customers complain about construction on the highway and roads leading to the airport. If our hypothetical business analyst working at the airport doesn’t configure their analysis properly, complaints about this roadwork may impact the sentiment score for McCarran. This will skew the results of the analysis, as civic works, like road construction, are outside the purview of the airport.

However, accounting for this can be tricky. Take this Facebook comment from March 2017, in which a customer complains about road construction:

“Our experience with the airport was overall great no problems at all I just don’t understand why car rentals can’t cooperate and have transportation inside the fence. Then there’s traffic congestion and detours everywhere. A 5 minute trip takes 15-20”

A properly-configured data analytics tool can split this review into its components.

For example, our own Semantria will sort this comment as positive for the airport, while identifying the other entities involved. In this case, “Overall great” adds +0.2 to McCarran’s sentiment score, while “car rentals” and “city infrastructure” get dinged -0.16 and -0.19 respectively.

Working with airport partners

Within any given airport, customers are exposed to numerous third-party vendors and agents. By tuning our analysis, we can focus on conversations about airlines, rental car agencies, and the TSA — all of which are operated by authorities independent from the airport.

Ultimately, these insights will help airport stakeholders share valuable intel with the brands that act as airport ambassadors every day. Furthermore, an analysis like this allows the airport to drill down into relevant conversations where they might affect change.

McCarran customer insights

Overall, analyzing Facebook reviews of McCarran International Airport shows us a mixed bag of opinions. There are some complaints about the cost of food and beverages (although we could say that high prices are inevitable, as the airport shares the retail concession with their restaurant partners, driving prices upward).

A whopping 48% of baggage handling reviews are negative, citing lost, damaged, or delayed luggage. If baggage isn’t delayed, the customers are. Many comments focus on out-of-service doors, people movers, and more.

Says one commenter on Facebook:

“Looked great with the Welcome to Vegas signs BUT couldn’t get to baggage collection as the doors were broken, no airline or airport staff or signage to say how to take a different route. You guys may know it, but visitors don’t!”

Speaking of signage, wayfinding is a consistent problem. As we’ve learned in the past, wayfinding is crucial to the success of an airport.

There are places where McCarran outshines the rest. In 2005, the airport became one of the first to provide complimentary Wifi. Thanks to an emphasis on network friendly infrastructure and regular uptime airline passengers are able to enjoy complimentary unlimited connection even while their on the tarmac. Stuck on a grounded flight? Now you may connect to an LAS branded wifi hotspot and while away the delay. This brand experience goes a long way in promoting customer retention. The emphasis on wifi as a customer experience touchpoint is something an airport company can suss out using text analytics. And, as we’ve pointed out with other examples, this intel can then be baked into the very fabric of the facility.

This fact is reinforced by Samuel G. Ingalls, assistant director of aviation, information systems at LAS, “By the time we started construction on our new Terminal 3, which opened in June 2012, we had a pretty good idea about where to place the Wi-Fi antennas for maximum effectiveness.” The work on expanding network connection onto the tarmac was put to a test in 2015 when 170,000 tech oriented conference attendees descended on Las Vegas. Mr. Ingalls and his team might’ve used text analytics to mine feedback about the experience of these power users, identifying any problem areas. “I saw many people around the airport with at least three devices.” reported Ingalls. “And we didn’t get any negative feedback from these attendees, who used the Wi-Fi system both inside and outside the terminal. I considered that a very positive sign.”

What should McCarran do with these insights?

McCarran might use this social data to design a 2019 budget aimed at solving problems real customers encounter every day. Natural language data is the single best resource for businesses to make profitable decisions. Now, with tools like Semantria Storage & Visualization, all stakeholders in a business may leverage this resource, even if they have no data analytics experience.

Multichannel Communications and the 24/7 Customer

In this piece, InMoment investigates the current state of play for brands in the multichannel communication sphere and explores how they can find the balance in their own CX approaches.

With a rise in social media communications, the goal posts of customer engagement have forever shifted, demanding a more instant and personal approach from brands. Traversing each channel of communication can be a minefield, with each one requiring its own style and speed of response. At the same time, customers are becoming increasingly savvy to alternate ways to reach a brand and this has changed the expectations of customer experience. In this piece, InMoment investigates the current state of play for brands in the multichannel communication sphere and explores how they can find the balance in their own CX approaches.

Whether it be responding to a customer complaint or a more general enquiry, the multichannel approach is bringing the consumer into ever closer contact with a business. As a result, brands need to evolve their CX approach to ensure they can continue to meet the expectations of customers who demand a 24/7 response – those businesses that do this will thrive. This means a CX programme needs to take into consideration bricks and mortar retailing, online operations, mobile interfaces, social platforms and beyond.
While each channel is distinct they should not be looked at as siloed avenues – with the technology now available, brands can build an open response model, allowing them to successfully bring their CX strategy into alignment with the multiple channels available for communication.

What is key for businesses is to invest in technology that enhances the customer experience. InMoment’s latest CX Trends Survey, launched in April this year, found that brands often overinvest in technology for the sake of it rather than looking at what will impact the relationship with the consumer. The survey found that the most valuable experiences that involve technology reflect a desire for convenience: self-checkout at a physical store and the ability to give feedback via a mobile device. The fact that customers are so eager to share feedback is golden for brands, since it gives them opportunities to listen and act.

If brands are implementing new technology, they must ensure that it provides value to the customer experience across all channels. One example of a brand using cutting-edge tech to do just that is IKEA. Using augmented reality, they provide customers with a high-tech solution to very practical challenges: virtually seeing what a specific paint colour will look like in context, and seeing how a piece of furniture will fit into a room — both in terms of size and aesthetics. The key to investing in flashy new technology is to ensure they align with your overall brand strategy and follow through to ensure they make a real impact on customers.

Businesses should also see the 24/7 consumer as an opportunity to create new found levels of engagement with their target audience. Brands need to embrace the multichannel approach and renovate any outdated CX models that don’t encompass the nuances of each platform. In the last few months we’ve seen dozens of retailers and hospitality businesses significantly downsize or collapse, such as Toys R Us, Maplin and Prezzo. We’ve seen the ease of purchasing via online retailers and price-competitive grocers being blamed, along with falling behind with vital store updates, however, what many brands are missing is the importance of nailing the customer experience, in a relevant way for all customers across every brand touchpoint.

There are clear pressures for brands, such as increasing operational costs and squeezed budgets, but this is where understanding what is important to customers is paramount. Businesses that create memorable, positive impressions are the ones that will prosper – those that deliver what they promise, consistently across all platforms, and really listen to their customers. Staff interaction cannot be overlooked as it has a huge impact – both good and bad – on the customer experience. Consumers want real connections with staff who are well-trained to educate and inform across all channels. Over 73% of customers reported in InMoment’s survey that staff interaction is key when creating positive experiences – and a further 61% said poor staff attitude, lack of knowledge and slow or unhelpful service contributed to a negative memorable experience. Brands should look for ways to reduce customer pain points, increase frequency of opportunities to delight, and measure the change, and this must happen wherever a customer interacts with a brand.

One of the key opportunities for brands is to implement always-on listening, plugging in CX feedback technology into all channels to ensure customer feedback is being consistently collected, analysed and acted upon. AI will be key, opening up barriers to communication and empowering CX professionals by arming them with relevant and timely data. Brands that embrace this technology, listen to customers consistently and – most importantly – make operational changes based on this data will keep the 24/7 customer on side.

Data is the beating pulse of business, but customer data is more like DNA. Customer data, if we’re using it right, directs how we grow and what we develop. But what happens if that customer data becomes corrupted by our own bias?

We can’t grow or develop in the ways we need to.

But what is bias exactly? Where does it come from?

The most prevalent bias is, perhaps, confirmation bias – seeking out data that confirms our existing beliefs.

In an early study of confirmation bias, young children were asked what features in a sports ball are important to the quality of a player’s serve. Some said size, others said material, some dismissed color as a factor – but once they’d made up their minds, they failed to acknowledge evidence that was contrary to their theory – or explained away evidence that didn’t fit.

But what’s worse, especially for those of us using data to steer our businesses, is that confirmation bias caused them to not generate alternate theories unless someone asked them to. They missed exploring and finding other possibilities.

There are other types of bias too, including:

Algorithmic bias – When the data used to teach an AI machine learning system reflects the implicit values of the humans involved in collecting, selecting and using that data. You might remember the 2015 uproar around Google’s image recognition AI algorithm that auto-tagged photos of black people as gorillas? Yes, that happened. And in 2009, Nikon’s image recognition algorithms consistently asked Asian users if they were blinking.

Survivorship bias – When the data analyzed only comes from success stories.

Sample bias – When the population you collect data from doesn’t accurately reflect the population you’re trying to learn about.

Avoiding bias when gathering, analyzing and acting on data is impossible. Bias creeps in with assumptions, instincts, guesses, and ‘logical’ conclusions – and mostly, we don’t even know they exist until someone without those particular biases point them out.

But, while we can’t escape biases, we can try our best to account for them when we collect, analyze and interpret data.

“The greatest obstacle to discovery is not ignorance – it is the illusion of knowledge.” – Daniel J. Boorstin

How to fight bias in your data

In Forrester’s The illusion of insights recording, Forrester Vice President and Research Director Sri Sridharan makes three recommendations to reduce bias in data.

She says to “triangulate insight” by using multiple methods of arriving at an insight, and cross-validation. For example, pairing behavioral data with feedback from customer surveys to see if you arrive at the same or similar answers.

Her second piece of advice is to create a “self-correcting system of insights” that connects customer data with an effective action to create a closed loop of action, learning, and optimization. Essentially, this means testing the data by taking action and iterating based on how well you succeed in addressing the issue.

Tracking a ‘North Star’ metric like NPS or CSAT over time can be very helpful in confirming whether the changes you make are having the desired effect.

Sri’s third piece of advice is to “show your work to build trust” both internally and with customers. Your customers will be quick to correct you if your insights don’t hold true for them – and you have the bonus of showing them how hard you’re working to make sure they have what they need to succeed.

But there is also the potential for bias to happen before any of these fixes can be made – especially in Customer Discovery.

Bias in Customer Discovery, Before You’ve Even Gotten to the Data

Bias in whom you ask

Who you survey, interview or meet with can bias your results. This is called “sample bias” – but it can also turn into confirmation bias. Sample bias happens when some members of the intended population are less likely to be included than others. Think of all of the different segments of users you have – what would happen if you only surveyed one of those segments? You would get responses that don’t work equally well for all of your customers.

This can slide into confirmation bias if the population you select is more likely to give you the answers you want to hear.

And, there’s also the risk of “survivorship bias,” if the people you’re surveying are the customers who are still with you, rather than the users who have churned. Current users are much easier to collect data from, and while they can give you important insights, they can’t tell you why your churned customers left.

Bias in how you ask

How you frame questions can have a dramatic effect on the responses. In fact, by the wording you use in a survey, or even your tone of voice in a phone interview or facial expressions in an in-person interview, you can effectively steer the conversation to deliver exactly the answers you’re hoping to hear. Many of the words we use have positive or negative associations that cause people to react accordingly.

Biased question: How much do you like the color blue? (This presupposes they like the color blue at all)

Unbiased question: How does the color blue make you feel? (A much more neutral phrasing)

Or, if you aren’t specific enough about the information you want, you risk confusing your respondent and getting answers that aren’t at all helpful. Unless you have a professional market researcher on staff, you may want to stick with established questions like NPS and CSAT.

Bias in what you ask first – and last

The order of the questions you ask can also bias your results, and you’ll need to review your question order carefully to make sure the sequence doesn’t cause biased responses. Typically, you should ask general questions before specific ones, ask positive questions before negative ones, and ask questions about behavior before questions about attitude.

Bias in when you ask

Holidays and the summer months, when families often take their vacations, can be problematic for both response rates and sample bias. For example, if you send a survey during religious holidays, you’ll likely get different responses rates from different groups of people, who may or may not be taking that time off.  Be aware of your timing, including if you’re sending surveys during deadline rushes, before or after holidays, or other significant patterns that may affect who responds and how they respond. To be on the safe side, don’t send your survey at the same time every year – send a few, at different times, to get the most accurate feedback.

Objective Data Leads to More Accurate, More Valuable Insight

Sherlock Holmes famously tells Dr. Watson that he never forms a theory before he gathers all of the facts. But he’s much better at disassociating himself from the results than most of us are (and he’s fictional). Bias has a way of seeping into our results, and how we view and react to our results. But, when we put bias-countering measures in place, like gathering data from different sources, using different types of data, and checking our work through a process of action and iteration, we can get to the truth in the end.

Get immediate insight from comments using text and sentiment analytics.
Learn about Wootric CXInsight™

Editor’s note: This is a chapter from the ebook, Unlock the Value of CX. You can download the entire book here.

Most organizations strive to ingrain in their employees a set of organizational values–behaviors and attitudes–that are the guiding principles for all employee actions. These values are often expressed as brand promises–statements about what an organization is, what it stands for, and what it will deliver to its customers.

Brand promises can be implied as well as expressed, if customers are used to a particular level of service based on their previous interactions with the company. Brand promises work best when they are realistic and actionable, targeted to the organization’s customer base and clearly linked to every customer interaction across the organization.

Meeting Brand Expectations at Every Level

The ability to meet brand promises at every customer interaction, however, eludes too many organizations. Brand promises are often set from the top of the organization and performance metrics for executives are often tied to them. However, when it comes to brand behaviors being practiced at the point of customer interaction, the results are not always consistent or satisfactory. This causes some customers to leave the interaction disappointed and frustrated.

The problem is often magnified in companies undergoing changes. As organizations grow, they often reach a state where they develop competing priorities such as, a need to cut spending to reach profitability targets or a mandate to introduce a new product or benefit.

Executives often fail to question whether changes across the organization will impact their ability to deliver on the existing brand promise. The impact is not limited to marketing or product functions. Changes to any function should be considered in terms of its downstream customer impact. Every function, from marketing, product, risk, operations and finance to human resources and compliance, has a role in fulfilling the brand promise. Each function must own its impact on the customer experience.

Take for example, a bank’s underwriting department. As a result of a recent audit, is now required to perform manager-level reviews of a greater percentage of applications prior to approval. If the leaders collectively fail to ask for more underwriting managers, the approval timeline for applications will increase, and the trickle-down impact will likely be severe. If the product and marketing teams at individual branches are not informed about this change, customer complaints will begin to build and customer satisfaction will suffer.

Seven Strategies to Prevent Brand Erosion During Organizational Transformation

The solution requires ownership by the entire organization. Below are seven strategies to avoid setting brand promises that are untenable and avoiding brand promise erosion when organizational changes happen.

1. SET THE TONE FROM THE TOP. Brand promises are often built by a chief marketing officer or branding executive in conjunction with a branding agency. However, every executive function should be involved in this effort to confirm the positioning is feasible. Once alignment exists around the brand promise, the CEO must set the tone. It is imperative for employees to be empowered to deliver on the brand promise at every customer interaction.

2. APPOINT A CHIEF CUSTOMER OFFICER. A chief customer officer is part marketer, part ombudsman, part efficiency expert and part operations expert – and fully committed to the customer journey. The best CCO is often someone experienced across various functions who can support the customer journey design from multiple perspectives. This customer champion must be willing and able to converse with peers from across the organization to ensure alignment with the brand promises, develop and lead efforts to assess impacts on the customer journey, and influence every other function to achieve the end goal of delivering the brand promises.

3. DESIGNATE A CUSTOMER COMMITTEE. It is common for organizations to have corporate committees, often aligned with executive functions, to support efforts ranging from compliance to risk to finance. A customer committee, consisting of cross-functional senior executives, will similarly support the customer experience effort and provide it with the emphasis it deserves.

4. ENGAGE IN CUSTOMER JOURNEY MAPPING. Create a cross-functional team consisting of product, marketing, risk, technology, operations, finance, human resources and other key functions to engage in exercises that map the actual customer experience. This may include what customers are trying to do, what they are feeling, what is going on behind the scenes in operations and technology, what moments of surprise, delight or unnecessary friction exist, and which interactions meet or fail to meet the brand promises. Then, develop a target customer journey that meets the brand promises with the appropriate level of friction, and chart a road map to achieve it. Think about the impacts on people (customers and employees), process, product and technology. The customer journey map should be owned by the chief customer officer and each key stakeholder in the journey. It should be updated each time a change to people, process, product or technology is considered.

5. MEASURE CUSTOMER SATISFACTION AND CLOSE THE FEEDBACK LOOP. Many, if not most, organizations have invested in customer satisfaction monitoring of one type or another and implemented scoring methodologies with which to keep track. However, monitoring alone won’t move the needle on customer satisfaction. The keys to the success of customer satisfaction monitoring are 1) implementation of a feedback loop, and 2) understanding drivers behind changes in macro-level satisfaction scores. Qualitative information about a poor experience (a low score) from a customer is an indicator that something has gone wrong. When multiple survey responses are similar, that’s an indicator that a process is broken. It is important that organizations not only monitor feedback but also assign owners of the feedback loop for each key step in the journey. When a customer provides negative feedback, the journey owner must reach out to the customer, acknowledge the issue and commit to a response. They must then investigate, engage in internal communication, develop a plan to rectify problems (if needed) and follow up with the customer.

6. DEVELOP CUSTOMER SATISFACTION METRICS ACROSS THE ORGANIZATION. Companies should develop meaningful and consistent customer satisfaction metrics for employees that tie directly to compensation. A technology metric, such as system uptime for example, does not correlate to customer experience. Although system uptime is clearly a requirement for customer satisfaction, it is too narrow. Rather, develop organization-wide metrics that apply to all employees and allow them to relate the requirement to their own tasks.

7. LEVERAGE INDEPENDENT TESTING. Independent testing is crucial to ensure what you have prescribed is actually occurring. Independent testers should be given tasks tied to discrete journeys and asked to report back on exactly what happened and how they felt as a result of the experience. Additionally, testers should provide a fact-based method for comparing the interaction against the journey map and brand pillars, as well as qualitative feedback that uncovers gaps between the experience and the brand promises. Achieving excellence in customer experience is a result of every employee living the organization’s brand promise. Getting there requires significant enterprise-wide commitment, including the implementation of the steps listed above. In return it can reap significant rewards in the form of satisfied customers, happier employees, greater revenues and improved profitability.

Change Region

Selecting a different region will change the language and content of inmoment.com

North America
United States/Canada (English)
Europe
DACH (Deutsch) United Kingdom (English)
Asia Pacific
Australia (English) New Zealand (English) Asia (English)