Why is Customer Experience becoming the primary way companies differentiate themselves in an increasingly crowded market? How does CX pave the way for growth? How do you measure it accurately (and actionably) – and how can you leverage customer feedback for happier customers, more referrals, and more sales?
We asked all of these questions and more of CX experts at the top of their field – and their answers will inspire you.
Customer Experience Experts on Growth
Customer Experience is inextricably linked to growth – when you give the customers not only what they want, but also what they need in a way that leaves a positive impression, you’re making an investment sure to pay dividends.
“Customer experience drives growth. Data supports this fact. Forrester showed that CX leaders, on average, grow more than 5x faster than CX laggards. The companies that have made CX a priority focus on understanding the customer’s needs and wants and spend a lot of time understanding the journey a customer takes. They ensure the customer voice is heard (either through direct interviews or other opportunities to provide feedback) at each touch point of the customer journey, make sure actionable insights from feedback gets back into processes and close the loop with customers to advise them of the actions they took. They do this because they understand the post-purchase phase of the customer lifecycle is where growth occurs.” – Sue Duris, Director of Marketing and Customer Experience, M4 Communications, Inc.
Customer Experience Experts on Tracking CX Metrics
What’s the best way to improve the experiences your customers are having? Opinions differ, even among experts, but everyone agrees that what gets measured gets done.
“An organization should have many tools available to them and not lean on any one of them too heavily. They should look at a combination of CES, NPS, CSAT, loyalty, and emotions metrics. In addition, measurement shouldn’t be taken in a vacuum. Testing and analysis should occur regularly and consistently so you can view trends and then take deep dives to determine the reasons the trends are what they are. This will help you improve your CX performance.” –Sue Duris, Director of Marketing and Customer Experience, M4 Communications, Inc.
“If you want to get started with measuring and improving customer experience, I recommend you begin by tracking Net Promoter Score. You’ll get a metric that everyone in the company can rally around improving, and the rich feedback you get from customers will give you guidance on how to do it. Over time you can build a sophisticated customer feedback strategy that incorporates a number of CX metrics, but I advise that you get the ball rolling as soon as possible. There are a number of low cost/no-cost SaaS platforms out there, including Wootric, that can get you started quickly.” –Jessica Pfeifer, Cofounder and Chief Customer Officer, Wootric.
“The Net Promoter System is the most effective way to gauge customer experience at scale. The better your customer experience, the more likely your customers will be brand enthusiasts or promoters. And the more promoters you have, the higher your Net Promoter Score will be.” – Jes Kirkwood, Content & Community Marketer at Autopilot
“The social media sites that have perfected the art of public reviews are the best customer experience gauges available. Yelp is a great example for the service industry, Capterra is a grand example for the software industry. Monitoring those channels is a passive way to manage these gauges. If you want quality, meaningful results, you will have to intentionally drive customer traffic to those platforms. Be brave. Invite them to be honest.” – Joe McCollum, Configio Support/SaaS Consultant
Customer Experience Experts on Retention
Sure, you can keep customers even if you provide a lackluster experience – if you’re the only game in town. But with competitors coming out of the woodwork, nobody has any market cornered for long. Offering superior CX is the only way to win the kind of loyalty that becomes the mortar paving the road to retention.
“I spend a lot of time with SaaS startup clients whose number-one goal is to improve recurring revenue. What I’m really excited about is a lot of my early stage startup clients are eager to put CX in place now so they are ready for when they scale. They know how vital CX is to corporate growth.” – Sue Duris, Director of Marketing and Customer Experience, M4 Communications, Inc.
“Customer experience is one of the two core pillars of customer retention — the thing is, you can’t grow if your customers don’t stick around. Keeping customers around is harder than ever—and delivering an unparalleled customer experience is the only way to win. Today, companies must curate a timely, relevant, and personalized customer journey, nail customer support, and take advantage of every opportunity to surprise and delight.” – Jes Kirkwood, Former Content & Community Marketer at Autopilot
“Efforts toward retention should start early in the customer relationship. At Wootric, we ask our customers the Customer Effort Score question to get feedback on our onboarding process. When we don’t get top marks, we get an opportunity to make things right with the customer immediately and get back on track. All because we reached out and proactively asked for feedback early on.” –Jessica Pfeifer, Cofounder and Chief Customer Officer, Wootric.
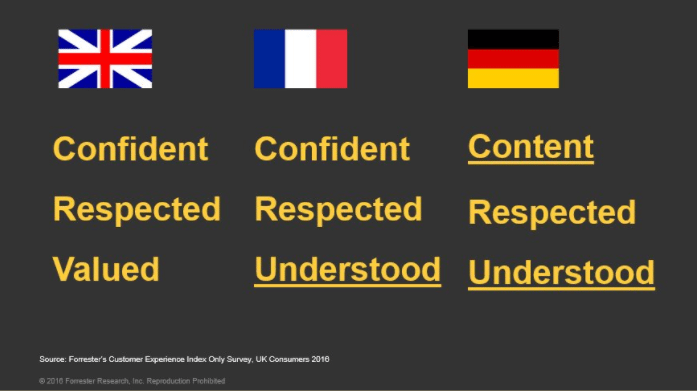
Customer Experience Experts on Leveraging Emotion
Emotion is a vital, yet often underappreciated, component of decision-making – but CX experts know that winning minds isn’t enough. Customer Experience is a game of winning hearts.
“In my experience working in varying industries, customer trust is a byproduct of an amazing customer experience. Whether it’s helping them with a purchase or teaching them how to use software; the make or break is how they feel when they walk away from you. If they walk away with complete trust, that type of experience translates to growth.” – Joe McCollum, Configio Support/SaaS Consultant
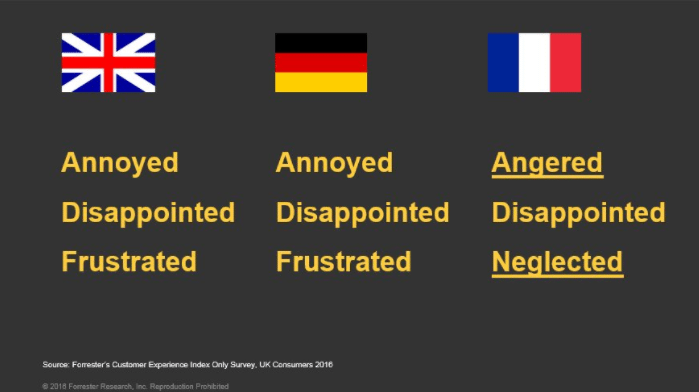
“We’ve found that it’s often the accumulation of small annoyances that does the most damage to a customer’s perception of a brand and their loyalty as a purchaser. Frustration metrics (things like rage clicks, error clicks and form abandonment) are a great way to quickly spot and fix major things that are actively blocking customers from achieving their goals and/or contributing to an overall negative experience.” – Amy Ellis, Marketing & PR at FullStory
“As a Product Designer, I understand that even more than having a great graphic design and program, the product needs to generate an experience that connects customers emotionally with your brand/service/product. Meaningful relationships are created by strong experiences. It’s how customers become allies for the marketing team for both referrals and acquisition.” – Diego Dotta, Developer & CXO at Youper
Customer Experience Experts on The Future
CX is a quickly-evolving field as new technologies make it easier to create better experiences, track those experiences, and leverage those experiences into engines for retention and growth. What does the near future hold – and what do you need to do to stay on top of the wave?
“I believe that CX will only become more important as it gets easier for newer, more nimble companies to disrupt larger slower companies. Technology will continue to get better at helping companies quickly and easily see where they’re letting down their customers – like causing them frustration and anger, complicating their progress toward their own goals, and missing opportunities to surprise and delight.” – Amy Ellis, Marketing & PR at FullStory
“Right now brands are inundated with CX feedback–social, surveys, support tickets–and it’s all over the place. Companies that take a systematic approach to aggregating and analyzing all of that Voice of the Customer data in one place will have a competitive advantage. AI–in this case a combination of machine learning and natural language processing–is making it possible to glean insights from those thousands of qualitative comments.” – Jessica Pfeifer, Cofounder and Chief Customer Officer, Wootric.
“Companies will need to focus on two areas:
- Creating consistent omnichannel experiences that cover digital. CX tends to be fragmented which hurts customers and companies. A better approach is to create a consistent experience across channels, and companies miss the boat on digital because they have gaps in their technology. Companies should focus on setting up a strong technological foundation which encompasses the entire customer journey
- Investing in AI. While current AI applications include chatbots for many tasks (Facebook Messenger currently has over 100,000 chatbots), a common application is to use AI for lower level customer service tasks. At more advanced stages, AI will be invaluable to CX in predicting sales and service behaviors and in augmenting engagement, to name a few.”
– Sue Duris, Director of Marketing and Customer Experience, M4 Communications, Inc.
“As technology continues to evolve, customer expectations will continue to rise. Delivering a hyper-targeted, personalized customer journey will become standard practice—customers won’t accept anything less. Creative marketers will find unique ways to surprise and delight, setting the bar even higher. Any companies that are already falling behind will struggle to keep up.” – Jes Kirkwood, Content & Community Marketer at Autopilot
“The challenge I have here, in a behavioral health company, is to discover and solve customer issues before they realize it themselves. I also see a need for increased availability – even offline – for when customers need emotional support, which we can do by being proactive using AI and passive data.” – Diego Dotta, Developer & CXO at Youper
“A lot of companies are turning toward value-added membership campaigns. I personally feel these first round of loyalty driven offerings are based too much on the fear of losing market share, less on value added that builds and increases the trust of the consumer. The evolution of CX will force many companies that want to be successful to bite the bullet and put their money where their mouth is. The good news is, the future is bright for the consumer.” – Joe McCollum, Configio Support / SaaS Consultant
Experts Agree: The Future is About Using Technology to Serve Customers Better
From customer success goals to metrics that measure emotion, to carefully planned and tracked customer journeys, Customer Experience reaches into every aspect of how companies relate to their customers. You can look at CX as the end result of how business decisions ultimately affect customers, or you can look at CX as the guiding light that becomes a company-wide compass for customer-facing decisions. Either way, it’s clear: To survive and grow, today’s businesses have align behind the customer experience.
Measure and improve customer experience. Sign up today for free Net Promoter Score, CSAT or Customer Effort Score feedback with InMoment.