Qualtrics acquires experience management leader Press Ganey Forsta, expanding the world’s largest human experience management AI & data platform.
|
Read more.
Is there a business that hasn’t lost a single customer? Doubtful. Customer churn is inevitable. For this reason, maintaining superior customer experience in a world of insurmountable choice and lagging brand loyalty is of utmost importance. Now I’m no mind reader, but since you’re still here, I’ll assume that you’re struggling with generating new demand for your business and keeping existing customers around at the same time.
For starters, let’s define customer churn.
Also known as customer attrition, churn refers to the rate at which your customers stop purchasing your product or service, signaling the end of their relationship with you. These customers stop bringing in revenue for your business.
Let’s say that you started this quarter with 500 customers but lost 25; this means your churn rate is 5%.
Other measurable ways for customer churn include:
Number of customers dropped
Percentage of customers lost
Amount of monthly recurring revenue (MRR) lost
Percentage of MRR lost
What Causes Customer Churn?
Value – Pricing is tricky because customers are always looking for the most cost-effective solution to the problem they wish to solve. Customers need to feel like their purchase was worth the cost, so it’s crucial to establish value early on, through customer onboarding and education. Otherwise, they’re at risk for churn.
Product Fit – Another common reason for customer churn is an inferior fit. If you have a sales team that’s hustling to hit quota but isn’t incentivized to sell to good-fit customers, your company will face consequences. Soon after their purchase, customers will realize they can’t achieve their goals with your product and will churn.
User Experience – If you have a product that’s not very intuitive or your software is glitchy, chances are customers will be less likely to use it on a regular basis and build expertise with it. They may not stick around for long.
Competitors – Even if you believe you’re assisting customers to achieve their desired outcomes, they’ll still churn if they firmly believe that a competitor can do a better job. Competition is fierce these days, so you need to work hard to set yourself apart from your competition.
Missing Features/deliverables – Let’s say you fail to fulfill a goal that was initially agreed on while getting a client on board. When you fail to provide services as promised, you’re bound to lose a customer.
What Are Some Churn Indicators to Watch Out For?
1. Weak CX metrics– When thinking about churn, there are two CX metrics, in particular, that you should pay close attention to:
Net Promoter Score. The grand-daddy of customer experience metrics, a detractor or passive NPS survey response is a leading indicator of churn.
Customer Effort Score. Many software companies have adopted CES to measure the ease of getting started with your company or product. If this critical phase, often known as onboarding, is too difficult, churn can follow.
2. Usage level – Customer churn is often preceded by a period of decreased usage level, so keep a close eye on users’ login activity. This will help you to identify at-risk customers right before they churn. Also, if a customer downgrades to a lower tier of your product, this should be worrisome news – there’s a good chance that this customer will soon stop using your product altogether.
3. Customer’s KPI’s – If your product or service isn’t helping customers achieve their KPIs, then the chance of them churning is much higher. If you notice that a valued customer isn’t reaching their desired goals, it’s crucial that you reach out to them and find out what you can do to better help them achieve those goals.
4. Customer Health – While measured definitively when a customer renews or doesn’t, customer success teams look at a number of factors to assign a customer health score to an account. Take a look at the kinds of customer support interactions you’re seeing from the customer. After using your service, do you think the customer is getting what they’re paying for? How does the account manager feel about the customer’s state of mind about the services they’re buying from you? Factor in the account’s CX metrics. As soon as you have an idea of who might leave, you’ll be able to take all the relevant steps to define the problem, fix it, and retain their business. Eventually, you can start to implement a systematic approach to measuring customer health, uncovering at-risk customers, and reaching out to them.
5. Feature Adoption – Every product or service has some key feature that makes it stand out from competitors. If a valued customer isn’t using these features, this is an indicator that they might churn soon.
6. Support – This point refers to the number of support issues raised, the severity of the issues, the time it took to resolve them, and the customer’s satisfaction with the interaction (often measured with a CSAT survey). These factors can have a significant impact on a customer’s health, so they’re important to pay attention to. If a customer hasn’t reported any issues or asked any questions, this could also be a red flag – a silent customer doesn’t mean they are happy with your product.
What Needs to Be Done?
1. Engage with your customers.
This might sound obvious, but engaging with your customers is the best way to make them stay. Proactively inquire about how they are doing using CX surveys at key journey points. This will help you identify who is happy and who is at risk. Armed with this information, follow up with a conversation if warranted. Get them on the phone and show that your company genuinely cares. But don’t stop there – keep engaging. Depending on the size of the customer, you may want to schedule a quarterly check-in, and certainly one in advance of renewal.
In addition to talking directly to customers, provide ample and educational content about the key functional benefits of your product. Offer regular news updates, to communicate your commitment to innovation in service of their success. With this kind of communication, you can get customers to keep coming back by showing them the value of using your product and how they can make your product a part of their daily workflow.
Last but not least, I’d like to recommend social listening – the process of finding and contributing to conversations about your company online by seeking out brand mentions, specific keywords or phrases, and comments.
By doing these things, you’ll be able to keep tabs on what’s going on in terms of customer satisfaction.
2. Educate Your Customers
Another churn-prevention trick: provide plenty of quality educational or support materials. Try offering free trainings, webinars, video tutorials, and product demos. Do whatever it takes to make your customers feel comfortable and informed. Put simply, you must not only give customers tools that work but also offer training on how to best use these tools. In this way, you’ll also be able to demonstrate the full potential of your product or service.
3. Set realistic expectations
As I mentioned before, failing to deliver on services as promised can result in a very unhappy customer that is at high risk of churning. One of the common practices I have seen across several industries is to over promise and under deliver. Why would a salesperson want to do this? There could be numerous reasons:
They fear they might lose a potential customer
They’re facing pressure from their boss
They desire to come across as the “deal maker”
They’re desperate to close the deal
They’re unwilling to tell the customer what they don’t want to hear
4. Keep a keen eye on competitors
It’s a bad sign when your customers perceive your competition to be better. As you work on reducing customer churn, pay close attention to how your customers might perceive your competitors’ products, and don’t forget to benchmark your overall performance and customer satisfaction against your competitors.
Lastly, remember, the stakes are higher than ever. It’s time to make smart moves!
Author Bio: Vikash Kumar works as a manager in the offshore software development company Tatvasoft.com. In his free time, Kumar enjoys writing and exploring new technical trends and topics. You can follow him on Twitter and LinkedIn.
There’s a change going on with automakers! For the first time, automotive OEMs are creating and implementing proprietary customer loyalty programs for their dealer network.
Those programs are anchored by redeemable rewards points and aimed at keeping customers in the dealership “loyalty loop.” And car makers are even funding entire programs…one has even deposited $210 worth of points for each new car buyer so that new sold customers can use their points immediately.
It’s a first for the automakers, who, until recently, have ridden the wave of robust car sales following the great recession of 2008. The past hot market for sales placed retention on the back burner. But that wave is now ending, prompting dealers to search for other means of profits…mainly from used cars and the service center.
Loyalty programs, driven by redeemable points, are not new. Those programs offered by vendors have been around for decades. What makes them more attractive today is the new awareness on the part of retail auto leaders of the true value of a retained customer.
Loyalty programs can send a clear message to the customer that “we care about a relationship with the customer for the future”.
In addition to creating loyalty rewards program, car makers are also focusing more and more on retention rate benchmarks of their dealers…even rewarding them with bonus cash for meeting manufacturer preset goals.
And there is an increasingly strong feeling among retail auto leaders that “retention” will eventually replace “CSI” as the key measurement for the customer’s experience at the dealership.
In one case, a major automaker has already replaced the traditional service CSI score with an expected retention number.
These changes are also prompting a subtle but significant shift in dealership strategy. Traditionally, dealer leadership has always focused on the showroom, but now, with the plateauing of sales, that same leadership is now gaining a more intimate awareness of how the service center is the key to retaining customers for service revenue and repeat sales.
Dealer Service Centers are Ground Zero for Customer Retention
Success with ramping up acts of retention will require a dramatic cultural change that dealers will not adapt to easily.
Ever since the dawn of auto retailing, budgets for bringing traffic to the showroom have far exceeded those allocated for the service center. That will have to change with the new focus on loyalty.
Consider these NADA stats from 2017:
Dealers spent an average of $7.00 on retaining their already sold customers (2017)
Luxury dealers spent an average of $762.00 on each vehicle sold, non-luxury spent $670.00 (2017)
Average gross on referral vehicle sales was $1,200.00 vs $817.00 for fresh “ups”
Referrals have a 51% service usage vs 29% for fresh ups
Referrals have a 96% CSI score vs 73% for fresh ups
Clearly, increasing budgets for the service center have had a hard time gaining traction with store General Managers, a group dominated by those whose pedigree was developed in the showroom. That will have to change.
Greatest Deterrent to Focusing on Retention is the Existing “Transactional” Culture
Dealer service advisers don’t instinctively view the value of customer retention. I know this after observing it for 3 years as customer experience manager/retention (the service center exclusively) for one of the largest Buick dealers in the country.
As I stated in a past MaritzCX Cafe post, the number one enemy of customer retention is what I call transactionalism…the preoccupation with an all-consuming focus by dealers on the sales “deal” or the service “RO”, to the detriment of creating a “memorable” experience for the customer with follow up to match.
That proverbial focus on the transaction pushes a “memorable experience” and “customer follow up” to the back burner.
Customer Rewards Programs: A Platform for Delivering a Memorable Experience
We already have established that the service center is ground zero for retention success/failure for dealerships. We also know that service advisers are the primary brand ambassadors for that retention.
Sure, the CX delivered by the sales unit is important, but not as critical to retaining customers as the service lane experience and customer follow up. And while the customer experience during their visit to service is important to retaining them for future loyalty, the follow up of that same customer is even more critical.
That’s why loyalty programs, featuring redeemable points for future service discounts are so critical to repeat visits to service…and eventually to that next vehicle purchase.
Those programs not only offer the customer future discounts on products and services; they also convey a perception that the dealership cares about a future relationship with the customer.
Net Promoter Score (NPS) is great for a quick view of customer satisfaction and brand health. But NPS can be dangerously misleading. Here's why.
Net Promoter Score (NPS) is great for a quick overview of customer satisfaction and brand health. But NPS ignores nuance. A single number can’t tell you why customers feel the way they do. The upshot? You may be making bad decisions based on misleading NPS metrics. In a world where customer experience is everything, this can be disastrous.
Key take-aways
A high Net Promoter Score doesn’t mean your brand is healthy
People often leave comments that don’t match their NPS
You can fill this consumer insights gap by analyzing open-ended survey responses, social comments and online reviews
Read on to learn more about the dangers of measuring customer satisfaction with pure-NPS, and how you can use NLP-powered BI tools to fill this customer insights gap.
What is NPS?
The benefits of NPS
Why is it bad to rely on NPS alone?
The NPS insights gap
How NPS can be misleading
Bridging the NPS insights gap
Customer review analytics in action
How to build a better Voice of Customer program
What is NPS?
Net Promoter Score (NPS) is a single-question survey designed to measure customer brand loyalty. NPS asks,
“How likely are you to recommend [Company X] to a friend or colleague?”
Customers can answer on a scale:
0-6 = Detractor
7-8 = Passive
9-10 = Promoter
Promoters are likely to buy again or generate referral business. Detractors are unlikely to buy again and may actively discourage others. Passives fall between the two.
A company’s net promoter score is a simple calculation:
As we’ll see, NPS is a versatile number that offers a wide range of benefits and practical applications. But NPS can be dangerously misleading without deeper, supplemental business intelligence.
The benefits of NPS
First and foremost, the NPS system is proven to increase survey response rates by giving customers a chance to have their voice heard, without requiring a substantial time investment.
Next, a company’s Net Promoter Score can simultaneously be taken as a snapshot and tracked over time for predictive analytics.
Third, NPS can be measured by company, product, franchise location, support agent, and a wide range of vectors.
Fourth, NPS can serve as a predictor of business growth. A Promoter’s customer lifecycle value (CLV) is usually higher than a Detractor’s or Passive’s. So, a higher NPS naturally correlates with higher revenue, and vice versa.
Fifth, NPS drives rapid changes in policies, products and processes. By using a simple, shared vocabulary, NPS lets you quickly share information within an organization, while being sure that everyone reaches the same conclusions. This helps companies reduce the communication delay between customers, support agents, and product managers.
Finally, you can compare your company’s aggregated Net Promoter Score against your competitors for a simple picture of your brand’s relative health. If your business has an NPS of 70, but your chief competitor boasts a 90, you know to start digging deeper to find out why.
In short, the Net Promoter Score system is a simple, easy way for businesses to paint a clear picture of consumer opinion and brand health.
For these reasons and more, NPS has become a go-to customer success metric for companies and agencies across every industry and vertical. But NPS isn’t enough on its own.
Why is it bad to rely on NPS alone?
The NPS system delivers an easy-to-understand measure of customer satisfaction. And because NPS questions generate more responses than traditional satisfaction surveys, NPS can give you more data to act on. But in the end, this is a dangerous oversimplification. A high NPS doesn’t mean your brand is healthy.
The chasm between Facebook star ratings, represented here by O’Hare ATC Towers, illustrates a fractured opinion of the airport. But why?
Customers don’t care about your NPS. They want to know that they’ll enjoy the experience of using your products and services. And without understanding why you’re receiving your scores, and without giving your customers the chance to tell you in their own words, you’ll never have the data you need to make informed, effective decisions.
The “why” comes from open-ended survey responses, customer comments, social media posts, and online reviews (which is an information source that is notoriously challenging and labor-intensive to utilize). As we’ll show, this is where natural language processing comes into play.
The NPS insights gap
Meet Stephanie.
Stephanie just wrapped up a four-night stay at a San Francisco hotel while in town for a conference. When asked how likely she’d be to recommend the hotel to others, Stephanie responds with an enthusiastic 9.
Sounds great, right? Another promoter created, a higher NPS for the hotel, and a happy management team. Bonuses all around!
Not so fast. Stephanie also left a free-text comment on the same survey:
“Stayed for 4 nights. The room was spotless, and the bed was super comfy. Especially loved the shampoo and conditioner in the bathroom since I forgot mine at home! I did notice the fruit in the bowl at the front desk looked off and the breakfast was kind of lame. But overall a great stay.”
Overall, Stephanie describes a positive experience and offered a generous Net Promoter Score. But her comment raises two red flags that demand attention: rotten fruit and a “lame” breakfast.
How NPS can be misleading
As we said before, NPS deliberately ignores the nuance of open-response customer surveys in favor of higher response rates and fast action. That’s a fine way to gather basic feedback. But customers often leave comments that don’t match their Net Promoter Score. Ignoring this disconnect can seriously damage your business.
Remember that Stephanie gave her hotel a Net Promoter Score of 9. In her open-ended survey comment, however, she mentioned that the fruit at the front desk looked old and the breakfast was “lame”. Both of these data points are valuable. But a traditional NPS system will totally ignore the critical feedback about the front desk and breakfast service.
Evaluating NPS by Themes from real customer reviews of Atlanta International Airport – read our full analysisAnd it gets worse. What happens if Stephanie posts her review on TripAdvisor, Yelp, or the hotel’s Facebook page? That shiny NPS may be quickly overshadowed by lost revenue from people turned off by her review.
Without a system in place to analyze Stephanie’s open-ended comment and identify her complaints, the hotel’s managers may never even know why business is down.
Bridging the NPS insights gap
As Stephanie’s story demonstrates, a customer’s Net Promoter Score and their actual comments can send two very different messages.
The best way to fill this “NPS insights gap” is, of course, to read survey responses, online reviews, social comments, and other sources of open-ended feedback.
But the sheer volume of this text is impossible to handle. Until recently, businesses had to comb through customer satisfaction surveys and online review sites by hand. This was a tedious process that required an enormous labor investment for minimal returns.
As a result, customers had few channels through which they could tell companies about their experiences. Companies were all-but-deaf to these stories, and everyone suffered for it.
Today, however, customer feedback analytics tools like the Lexalytics Intelligence Platform enable you to analyze thousands of open-ended survey responses and real, unstructured customer comments and reviews, all in the time it takes to brew your morning coffee..
These solutions combine natural language processing and artificial intelligence to show you how people talk about their experiences with your products, brands and services, in their own words.
Through intuitive dashboards, you can see exactly what people are talking about, how they feel about those subjects, and why they feel that way.
In short: By analyzing open-ended survey responses and real customer comments, you’ll catch the valuable, context-rich data that NPS systems would fail to pick up on.
The outcome? Better customer experiences can increase lifecycle value 6-14x, reduce churn up to 55% and grow revenue 4-8% (source).
The flexibility and customizability of these platforms make them applicable across industries and verticals, particularly in hospitality/transportation, financial services, pharmaceuticals, and retail.
For example, take a look at this dashboard built in the Lexalytics (an InMoment company) Intelligence Platform, using a data set of Facebook reviews of San Francisco International Airport (SFO).
Click image to enlarge, or read our full analysis of SFO reviewsThis dashboard tells a compelling story of traveler experiences at SFO.
Overall, guests are satisfied with the airport – but there are several areas of concern that the airport’s management should investigate. For one, there’s a problem with the charging stations that needs to be addressed immediately. Travelers are complaining about flight scheduling, and mentions of this issue have been increasing over time. And Terminal 1 should be speedily modernized like Terminals 2 and 3.
Through rich, multi-layered analytics dashboards like this one, you can uncover compelling stories of customer experiences, as they tell it.
How to build a better Voice of Customer program
To be clear: Net Promoter Score can and should still have a role in your customer experience management. But as we’ve demonstrated, the NPS insights gap can lead you unwittingly into disaster.
To fill this gap, combine NPS and an NLP-powered Voice of Customer analytics tool to paint detailed pictures of customer experiences.
For example, send NPS surveys for a quick, easily-digestible snapshot of brand health. Use this information to make fast, agile changes.
Meanwhile, use your VoC platform to analyze unstructured customer comments, reviews, and open-ended survey responses at scale.
Together, this comprehensive VoC analytics program will deliver the detailed information you need to make informed, effective changes to improve your customer experience.
Customer centricity is a hot topic in business these days, as more and more companies challenge themselves to foster a “customer-centric culture.” But that’s a tall order – not to mention an ambiguous one – and it raises a number of questions, such as:
What is a customer-centric culture anyway?
Why is it important?
Who is responsible?
How do you inspire a customer-centric culture?
We are actively leading a customer centricity transformation at VMware, and while every organization is unique, our answers to these questions may prove useful as you embark on your own journey. And the word “journey,” when it comes to a customer-centric culture, is key.
For us, it all started with an unwavering passion to do the right thing for our customers, and over time it became clear that we needed to develop a deliberate strategy around it. We’ll talk more about our strategy later, but for now let’s break down the basics.
What is a Customer-Centric Culture, Anyway?
Customer centricity is more than a concept – it’s a mission. At VMware, we believe that customer centricity goes beyond creating great customer experiences – we put the customer at the center of everything we do. Customer centricity is a core company value, a way of thinking, and an approach to doing business.
To achieve that state of being, I can’t overstate the importance of humanizing the customer for your employees. Real culture shift happens when your employees walk in your customer’s shoes and genuinely understand how their individual roles impact the customer experience (even if they aren’t customer-facing!). With understanding comes empathy, and with empathy comes motivation to make a difference.
Why is it Important?
Ah, the million-dollar question. Starting at the top with our CEO Pat Gelsinger, we firmly believe it is our responsibility to provide the best possible experience for our customers. After all, VMware wouldn’t exist without them. In short, it’s the right thing to do.
We also know that consumers and businesses today have more options than ever before, and if we don’t deliver the kind of experience our customers expect, they won’t continue doing business with us. VMware thrives when our customers successfully harness our solutions to meet their business needs – so it makes sense business-wise for us to listen and act on our customers’ needs.
Who is Responsible?
Every employee plays a role in the customer experience. Whether front-of-house or back-office, we all contribute to our customers’ perception of our company.
At VMware, our Customer Advocacy team drives the customer centricity strategy which helps every team, from Leadership on down, understand their role in creating an exceptional customer experience.
In my view, an effective culture strategy has two main components:
Active participation from the entire Leadership team. Employees will prioritize what their leaders are focused on. We work with all functional leaders to ensure their customer obsession talk tracks are woven into every major communication, from all-hands meetings to newsletters; and that they convey a sense of importance and urgency, focusing directly on the customer experience elements that are in the wheelhouse of their audience.
Individual employee customer-centric decision making. We strive to empower every employee with the insights, resources, and independence necessary to operate in the best interests of both VMware and its customers. To facilitate customer-centric decision making, we also strive to ensure that customers are top of mind for all employees, day in and day out. This is where customer-centric culture comes in, and it is why we’ve fully dedicated a member of our team to lead culture programs that create customers for life.
How Do You Inspire a Customer-Centric Culture?
Inspiring a customer-centric culture doesn’t happen overnight. It’s a journey, and my team has learned plenty of lessons along the way. Some of our efforts have been more effective than others, but this is to be expected.
One of our notable successes to date has been VMware’s annual celebration of Customer Experience (CX) Day, an industry holiday. We think that CX Day is akin to a wedding anniversary! While you work hard at your customer relationships every day of the year, as you do your marriage, CX Day is a great opportunity to pause, celebrate, and show gratitude for the relationship you have with your customers. Our worldwide celebrations have engaged employees via interactive journey mapping, tours of a customer story “museum,” and other activities to acquire feedback on how to improve the customer experience. See how we celebrated CX Day in 2018!
While CX Day is impactful, we obviously want our employees to think about customer experience more than once a year! To that end, we created a global ‘CX Leaders’ program to cultivate a network of customer enthusiasts across VMware. The inaugural set of leaders were prior recipients of an internal award recognizing individuals who went above and beyond to deliver a great customer experience. The Leaders conceptualized a program known as Customer Appreciation Week, which focused on the power of an unexpected thank you. Over the course of the week, our sales teams reached out to nearly 4,000 customers to thank them for their commitment to doing business with VMware – and that was it. That’s right – no sales pitch, no upsell, no renewal prompt. The customers were surprised and delighted by the display of appreciation with no strings attached – and for us it was a simple way to maintain relationships and reinforce our commitment to our customers.
Our Closed Loop program is another area where we invest to engage employees and strengthen customer relationships. The program connects dissatisfied customers with VMware employees to dive deeper into feedback provided through various listening posts. In these conversations, the VMware employee seeks to understand the root cause of dissatisfaction and build a relationship with the customer, then follows up with the appropriate internal business unit(s) to develop improvement plans. The program mutually benefits VMware’s customers and employees, and it’s one of the best opportunities for an employee to walk in our customer’s shoes.
Closing Thoughts
I’d like to leave you with a final thought, which is that customer centricity isn’t binary – it’s a journey that begins with customer focus and extends to customer obsession. For us at VMware, it represents a fundamental business transformation that will extend far into our future. The best is yet to come!
I discovered a surprising truth after three years as Customer Retention Manager for a large volume dealer in Houston. There is a hidden enemy that must be addressed before any customer retention initiatives can be achieved. It is the no. 1 enemy of client retention, and yet most practitioners fail to recognize it, let alone address it.
It’s the reason why many dealers are left with small, gradual changes in their retention efforts that pale in contrast to the huge budgets and time spent acquiring new customers. But by keeping an existing customer, who is apt to buy again, dealers could be spending many times less to obtain the same amount new vehicle sales. As proof of this, the 2018 Cox Automotive Service Study found that buyers who returned to the selling dealer for service in the past 12 months were 74% more likely to return to that selling dealer for their next vehicle purchase. Returning service customers were 74% more likely to buy their next vehicle from that same selling store! Those who didn’t return for service in the past 12 months were only 35% more likely to return for their next purchase. That should gain the attention of most dealer GM’s, who generally come from the sales side of the business.
And speaking of sold customers returning for their next vehicle purchase, that same Cox study revealed a negative by-product of today’s obsession with “conquesting” sales from other dealers. “Not a convenience location” (no. 5 reason in the 2015 survey)moved up to the second most given reason for new vehicle purchasers not returning to the dealer where they purchased. So, there is a very good chance that many of today’s conquest vehicle sales will not return to that original dealer for service because they live out of the area where the selling dealer is located.
So, what is the number 1 enemy of retail auto customer retention?
No, the number 1 enemy isn’t a limited budget. Although a sufficient budget is necessary, it’s not the real enemy of a successful retention strategy.
Lack of buy-in from the dealer and management? It’s important, but the reason store leadership doesn’t get solidly behind a retention push is directly tied to the no. 1 enemy.
Silos are a real problem. You must address them, and it is not simple to do so, but they are not the real problem.
Competing initiatives are often cited as a reason for lack of meaningful progress in addressing customer retention. But these agendas usually directly support the number 1 enemy of retention. And that focus distracts management from seriously directing resources in the support of retention.
The lack of a robust technical infrastructure? Yes, retention can be aided with better technology, but it is not the true obstacle to retention.
Lack of training? It certainly helps to have trained employees, but if the average auto retailer really believed in retaining existing customers as a primary strategy, they would find the budget and time to train their workers. HINT: All the training, technology and “knowledge” in the world is not going to thoroughly address the number 1 enemy of retaining customers!
It’s transactionalism, an all-consuming focus by dealers on the “deal” or the “RO” is the number 1 enemy of a successful customer retention program. And that obsession consumes both the larger part of store budgets as well as the time spent by the staff.So, what is the number 1 enemy of a successful customer retention transformation?
Transactionalism describes the decades old, deeply ingrained tradition of placing the transaction front and center as the primary strategy for most auto retailers. And while the transaction has always been the primary focus of showroom sales, it’s just as prevalent these days in the service lane. Customer facing employees are paid to maximize and close “deals/ROs”, and because of that, retaining customers takes a back seat.
I’ve heard it said time and time again that there is little customer loyalty these days in retail auto. But how would we know? If the industry is so intoxicated with the transaction, and much less so with retaining the customer, it’s no wonder customer loyalty is perceived as dead. I spoke directly to this reality in a past MaritzCX Cafe post titled Retail Auto: Client Loyalty is not Dead, But Client Follow-Up is!
But there’s a glimmer of hope on the horizon. Early last year, one of the largest automakers launched the first ever OEM customer rewards program and another major manufacturer followed soon thereafter. And there is strong evidence that other OEMs are pivoting more and more towards implementing strategies that handsomely reward dealers and their associates for focusing on retention.
That’s great, but the big question left is, how are the OEMs going to move the needle of retention forward, when most of the dealers are still consumed with “transaction?” This is all about changing behavior at the dealership, which is the toughest challenge of all.
When you work in customer service you deal with hundreds of emails in a day. So, it can be easy to lose sight of just how important each one is. A single negative interaction can be enough to turn a person off your business.
People like to feel as if their problem matters to the person on the other end. Giving your emails a personal feel can be very helpful in facilitating positive and effective interactions between customer support and clients.
Use their name
Start by greeting them with a friendly hello before you dive into solving their issue. Use their name. The way you greet the customer sets the tone for the rest of the interaction, so it’s important. Don’t be weird and address them as ‘customer,’ or goodness forbid, by their case number. People like to feel as if they’re having an interaction with an actual human and not a machine. There’s no quicker way to make a customer feel like they’re dealing with a soulless robot than to address as their case number.
Get everyone on the same page
“Summarize what is happening currently with their issue to ensure everyone is on the same page. Don’t be afraid to ask the customer for confirmation if you think they might be misunderstanding,” advises Brian Sorensen, email marketer at BigAssignments. It’s much better to sort things out sooner than later. If you’re dealing with an ongoing situation or one that is complicated, then it’s never a bad idea to review what is happening. Rephrasing things back to the customer is a great way to make sure you are understanding each other.
Promise them a solution
Conduct your customer service interactions in a way that minimizes the number of customers checking in to see how things are progressing. Keep your customer updated on how things are going; this should happen at least once a day. Give them expectations. Let them know when you will be contacting them again with an update. You can’t guarantee them a solution in that timeframe, but you can guarantee them a check-in. You’ll find this makes your customers a lot less anxious, people like to know what to expect, especially when something isn’t working for them.
Be realistic about the situation
Be honest with your customers about what you’ll be able to help them with. When you overpromise you just create more headaches for both you and the customer. When you mess something up, own it, and apologize to the customer. If the product fails, apologize. Making excuses for failing or the product failing will only make the customer angrier. Focus on fixing the problem and being transparent. People appreciate honesty, and even if they are upset, they will still appreciate you owning the situation.
Canned replies work
Yes, you read that correctly. Used properly, canned replies can be very effective and save you a ton of time. The trick is to know when it is appropriate to send out a canned reply. In customer service you’ll find that a lot of interactions start repeating themselves, and for those common situations, a canned reply is fine. You can still write canned replies that feel personal and not as if they came from a robot. Automating the basic replies leaves you with more time to deal with more complicated situations that arise. Ensure your sending these at the most suitable times for your customers by using an email scheduling tool.
Write better emails with these online resources
Writing is a skill that requires regular practice and fine-tuning. Punctuation, spelling, using the correct word — it all matters. If English is your second language, or you slept through English class, here are some resources to help you nail your text and avoid coming off as sloppy.
Grammarly and Grammar Guide – Check out these grammar resources. They are perfect for simplifying grammar and making it easy for you to understand and use English correctly.
WritingExplained– Is it “#001D30” or “gray”? This blog covers these common mistakes. Don’t let errors ruin your otherwise great emails.
Conclusion
An email will never be as personal as a face to face interaction, but that doesn’t mean you shouldn’t try to make it as personal and pleasant as possible for the customer. Small things make a huge difference when it comes to customer service emails. Each positive interaction counts and helps build a relationship between the brand and the customer. Use these six tips to make your customer service emails feel personal.
Grace Carter is a content manager at BoomEssays services. She creates business presentations, teaches interns and curates support communications.
It's hard to find consensus when it comes to airport rankings. Slideshows here, listicles there — it's always a matter of conjecture and PR. That's why the Lexalytics marketing team set out to define the definitive, data-driven ranking of America's 10 busiest airports. Use this as a resource when planning all your travel and layovers.
Google this: “best airports in the US 2018”
Do you see that? 660 million results. There are gigabytes upon gigabytes of articles across the internet about the pros and cons of various US airports. However, there’s rarely consensus between the many listicles, slideshows and travel blogs. So, Lexalytics, an InMoment company, mined social data from ten of the busiest airports in America. The goal? Rate these airports based on actual customer experience signal. The result: a ranked list driven by data science, not editorializations and PR.
After this project concluded, Lexalytics partnered with Gensler’s Los Angeles Aviation and Transportation Studio, the industry leader in global airport architecture. Together, the teams are completing a firm-wide research project that, in the words of Gensler, aims at “leveraging sentiment analysis to inform the planning and design of airports.”
Architects Kate O’Connor, Justin Wortman and Andy Huang from Gensler have been using Lexalytics’ Semantria Storage & Visualization (Semantria SV) to mine social media data about dozens of America’s airports, with the aim being to find the signal in the noise of customer feedback. Through Semantria’s sentiment analysis technology, the team is generating deep, data-driven insights into what travelers and staff value in their airport experience. It bears mentioning that the information and views presented in this article are Lexalytics alone. This list does not in any way represent the opinions of Gensler or its affiliates.
Methodology
This simplified example serves to illustrate the basic concepts behind rules-based sentiment analysis. In other words, -1 is very negative and +1 is very positive.
We’ve taken 30,748 Facebook comments from ten of America’s busiest airports and ran them through our Semantria Storage & Visualization platform. A bit of perspective: 30,748 Facebook comments equates to 869,973 words, enough to fill 2,768 pages. That’s more than double the size of War and Peace!
Using natural language processing, we algorithmically sorted the airports based on real customer feedback. In other words, the ranking is based on an airport’s average customer sentiment, rather than opinion or star rating. Want to know more about the factors that influenced each airport’s ranking? Click on each airport’s name to review our deep dive into customer sentiment.
If you read our earlier SFO article, it should come as no surprise that San Francisco International Airport tops the list for customer satisfaction. The airport began using social listening in 2017, making improvements aligned with customer demand. Judi Mosqueda, the Director of Project Management for SFO, oversaw the investment of $7.3 million towards improving the airport’s wayfinding experience. This project addresses a major customer concern. The data shows how the social mentions of wayfinding at SFO jumps from very negative to very positive in a year’s time. It’s clear that customers can be your best business adviser if you listen properly – using the right tools.
[perfectpullquote align=”full” bordertop=”false” cite=”” link=”” color=”#1d8413″ class=”” size=””]I fly out of SFO for work and fun roughly 30 times per year. Yes there are weather delays, but this airport is truly a pleasure to use! The terminals are all being updated or have recently been updated, their [sic] are improvements in the weather delays, and there are plenty of flight options to choose from. The food has been getting better as the terminal renovations finish, which makes the weather delays more tolerable… The staff is great at serving the customers that pack in as delays stack up. The lounges are where I’ve noticed the biggest changes. American’s Terminal 2 Admirals Club is immaculate! If you have the pleasure of flying through SFO I highly recommend it![/perfectpullquote]
[perfectpullquote align=”full” bordertop=”false” cite=”” link=”” color=”#c8300d” class=”” size=””]Flights frequently get delayed due to ‘weather.’ You can play the weather card here and there, but when half your flights throughout the year are delayed due to ‘weather,’ that’s called a ‘scheduling’ problem.[/perfectpullquote]
What happens in Vegas can also skew the feelings of travelers who make their way through Las Vegas McCarran International Airport. Negatively scored reviews often criticize aspects of the city well beyond the control of airport stakeholders. Using a properly tuned social listening tool like Semantria SV, we see that often the negative customer sentiment is aimed at the City of Sin itself. We also learn that many travelers seem to enjoy the idea of having slot machines in the airport, while others found them an unpleasant reminder of past decisions. When it comes to the airport services themselves, like complimentary wifi on the tarmac, customer reviews score very positively. Overall, travelers find themselves engaged, on time, and happy while at LAS.
[perfectpullquote align=”full” bordertop=”false” cite=”” link=”” color=”#1d8413″ class=”” size=”14″]Flew Virgin America for the first time. Classic funk hit ‘Flashlight’ was blasting through the speakers at ticketing! Gotta give them at least four stars for that alone! Also, won at gambling in the terminal. Even better? You get to enjoy super-fast FREE wifi![/perfectpullquote]
[perfectpullquote align=”full” bordertop=”false” cite=”” link=”” color=”#c8300d” class=”” size=”14″]I liked it but they need to get rid of the slots. After a week n [sic] Vegas I didn’t want to see another slot. I was so ready to go home. Four days is plenty n [sic] that town.[/perfectpullquote]
The deep-dive into Seattle-Tacoma International Airport details how the customer experience breaks all departmental silos. Dirty bathrooms, for example, exacerbate complaints about costly food. However, despite some small challenges, Sea-Tac’s positive reviews account for nearly 40% of its data set — not bad. Topics ranging from the attitude and helpfulness of staff to the quality of the (expensive) food all score positively. By using smart NLP solutions to its advantage, Sea-Tac could quite easily make the changes needed to find its way to the top of this list.
[perfectpullquote align=”full” bordertop=”false” cite=”” link=”” color=”#1d8413″ class=”” size=”14″]A welcome stop in a long trip the food is good a little pricey but I guess that’s to be expected, train ride was nice and quick and the staff was friendly!!![/perfectpullquote]
[perfectpullquote align=”full” bordertop=”false” cite=”” link=”” color=”#c8300d” class=”” size=”14″]Why are all airport’s food so darn expensive? $12 for water and crackers??? Additionally the terminals aren’t equal in terms of food options. Previously I’ve never had an issue with bathrooms but I gotta say this experience was DISGUSTING. Hair everywhere. Gag me. But otherwise it’s great, the staff is very friendly and very helpful![/perfectpullquote]
As the busiest airport in the world, Hartsfield–Jackson Atlanta International Airport is bound to face some challenges. Through the power of NLP and social listening, it becomes clear that its biggest problem is with the wayfinding experience, despite recent and costly renovations. The data also shows that the saving grace for Atlanta is the staff, who are reviewed as courteous and helpful. Still, no amount of good cheer and manners can make up for the navigation nightmare of trying to find the proper gate.
[perfectpullquote align=”full” bordertop=”false” cite=”” link=”” color=”#1d8413″ class=”” size=””]I had to navigate this huge airport with two small children, luggage, and a carseat [sic]. I can honestly say any attendant who saw me was more than helpful. Directing me to TSA, picking us up from the park and ride, and just being considerate. A large place but the staff is more than capable.[/perfectpullquote]
[perfectpullquote align=”full” bordertop=”false” cite=”” link=”” color=”#c8300d” class=”” size=”14″]Nice airport, good restaurants… only complaint — the signage could use a little bit of work. I stepped off the train to [sic]soon because of the confusing signage between terminal T and the baggage claim. (I’ve actually done this twice on two different trips :-D)[/perfectpullquote]
Denver International
Sentiment Weight: +0.15
Thanks to a colorful connection with conspiracy theorists, Denver’s reviews speak of anti-gravity rooms, the Illuminati, and “Blucifer” — the giant bucking bronco sculpture at the entrance to the airport. As detailed in the linked write-up, social listening shows many of these complaints represent a potential path for customer engagement. When you tune the results, the data show that staff get twice as many positive comments as negative ones. They also reveal that while customers don’t mind the Illuminati so much, they could go for some more hooks on bathroom stalls and an improved baggage claim experience.
[perfectpullquote align=”full” bordertop=”false” cite=”” link=”” color=”#1d8413″ class=”” size=”14″]It is actually an underground Illuminati headquarters. The enormous, hideous blue horse statue with glowing red eyes next to the entrance road killed it’s [sic] sculptor before he finished it. The runway layout looks like a swastika when seen from space. There is a mural in one terminal that shows a child in a coffin. There are gargoyles on the inside of the building… Also, the people that work here are extremely nice and helpful![/perfectpullquote]
[perfectpullquote align=”full” bordertop=”false” cite=”” link=”” color=”#c8300d” class=”” size=”14″]Fantastic airport ruined by terrible bag delays which are common. Waited more than 30 minutes for my bags. Unacceptable.[/perfectpullquote]
In 2017, Dallas-Fort Worth International Airport ranked as both the best and worst airport (on different lists, of course). That it lands here on our list makes perfect sense as customer reviews score mostly neutral. Still, our sentiment analysis reveals that when travelers do get passionate about DFW, it’s usually about cleanliness. Interestingly, a PR director working for a DFW affiliated agency reached out to contest our findings; head over to the deep-dive article to see the exchange — and see the differences between AI and PR. A trove of positive comments highlight DFW’s inter-terminal tram system, Skylink. When properly maintained, Skylink is a unanimous crowd pleaser.
[perfectpullquote align=”full” bordertop=”false” cite=”” link=”” color=”#1d8413″ class=”” size=”14″]Best airport for kids! Kids play areas and the Skylink! We purposefully will always layover at DFW because it’s always a great experience.[/perfectpullquote]
[perfectpullquote align=”full” bordertop=”false” cite=”” link=”” color=”#c8300d” class=”” size=”14″]One of the grossest airports I’ve been to. Carpet in the waiting areas is absolutely filthy, as are the seats in the sky trams as well. Not sure if they even vacuum???[/perfectpullquote]
Chicago’s position on this list is unique from the others, as the sentiment weight is skewed. The subject of a viral national news story, ORD received a flurry of one-star reviews in a short period of time. Using Lexalytics’ web dashboard, Semantria Storage & Visualization, we see occurrences of 1-star Facebook ratings jump from 11% to 58% within days of the incident. The number of 5-star ratings dropped by more than half overnight. There is no question the right social listening tool might have made all the difference to Chicago’s standing during that crucial time, a subject we explore in the article.
[perfectpullquote align=”full” bordertop=”false” cite=”” link=”” color=”#1d8413″ class=”” size=”14″]Flight on time. Security line reasonable. Was not beaten and dragged off the flight I paid for by agents of an unchecked police state. So all in all a better than average experience.[/perfectpullquote]
[perfectpullquote align=”full” bordertop=”false” cite=”” link=”” color=”#c8300d” class=”” size=”14″]I’m paying for wifi and I’m using my last amount of battery to write this glowing review of O’Hare, that’s how much I’m disappointed with this airport. As a disclaimer my flight was delayed due to not being able to clear snow from the runways. I won’t fault am airline/airport for weather, but I will fault you for not being able to handle minor precipitation. Not prepared for snow of any kind in December! Concourses are dated. Waiting areas have no outlets… and chairs look like they’re straight out of the 1970’s. Avoid O’Hare at all costs… Also, I figured out that all these large plastic bins scattered around on the floor of the airport are for the crappy leaky roof. Real great look, Chicago.[/perfectpullquote]
Los Angeles International
Sentiment Weight: +0.06
If first impressions last forever, then Los Angeles International Airport is in trouble. Thanks to LA’s famous traffic, the airport faces challenges before customers and staff even arrive at the facility. While some of the responsibility lies with the City of Angels itself, the airport could use — and fortunately is using — AI powered natural language processing to effect landside improvements. The airport recently began deploying text analytics to inform infrastructure changes. Now, myriad improvements are in the works, ranging from a metro link to a tram connecting arrivals to rental car companies. If they follow through, LAX might rank much higher on future lists.
[perfectpullquote align=”full” bordertop=”false” cite=”” link=”” color=”#1d8413″ class=”” size=”14″]I was pleasantly surprised by how chic the new airport remodel was! Nice little shops, a MAC counter, trendy eateries, a Tumi, and a Frederic M, plus plenty of places to charge my phone and tablet, and although I don’t drink, lots of bars for those that do![/perfectpullquote]
[perfectpullquote align=”full” bordertop=”false” cite=”” link=”” color=”#c8300d” class=”” size=”14″]Food options are great….if you can get there threw [sic] the traffic. Once in the vicinity it is so bottle necked its [sic] a mess. The rental car return is so far away dont [sic]even bother. You teally[sic]have to leave where you are at (if youre [sic]within a 35 miles radius, longer if you are farther) at least 4-5 hours before your plane leaves, just to get to LAX. Onc e [sic] within your terminal its [sic] nice.[/perfectpullquote]
Like Las Vegas McCarran, John F. Kennedy International Airport is as much a cultural landmark as a business. Nonetheless, customers come through by the millions and have many of the complaints you might expect of a giant transit hub. Last year, the New York state government earmarked $7 billion for renovations. They run the risk of throwing good money after bad if they fail to tap into the strategic knowledge afforded by text analytics and social listening. When it comes to positive customer sentiment for JFK, there isn’t much consensus. The airport faces many challenges ahead if it wishes to win customers from its two nearest competitors, LGA and EWR.
[perfectpullquote align=”full” bordertop=”false” cite=”” link=”” color=”#1d8413″ class=”” size=”14″]My favorite of the major NYC airports (JFK, LGA, EWR). Staff is somewhat friendlier and it’s an all around better environment.[/perfectpullquote]
[perfectpullquote align=”full” bordertop=”false” cite=”” link=”” color=”#c8300d” class=”” size=”14″]Beyond frustrated with the lack of breastfeeding/pumping areas anywhere! No, I don’t want to pump at an airport terminal gate or in a booth at one of the terminal restaurants, but thanks for the offer. JFK is one of the busiest airports so not a lot of low traffic areas. Why don’t airports put outlets in the family bathrooms? It is hard enough having to travel with the extra supplies as is. Ugh… Also, no free wifi?[/perfectpullquote]
People really, really don’t enjoy Charlotte-Douglass International Airport. The consensus narrative exposed by the analysis reveals a systemic attitude problem among staff. Data extracted from the reviews reflect personnel who don’t appear to care about customer experience. Complaints extend to a variety of other areas as well, from ADA compliance to poor signage and wayfinding design, and the recently defunct bathroom attendant program. Charlotte does stand tall with its communal spaces — central to which is a sunlit atrium appointed with trees and snow-white rocking chairs. If Charlotte begins listening to its customers, it will be better empowered to solve their core challenges. In turn, bonuses like rocking chairs will be seen more as a cherry on top, and less as a manifestation of tone-deaf customer support.
[perfectpullquote align=”full” bordertop=”false” cite=”” link=”” color=”#1d8413″ class=”” size=”14″]As a connecting airport, it has a way to go to compete with Atlanta in terms of efficiency, services, scope… but I *have* had some respectable longer layovers here that were pleasant enough in a big white rocker with someone playing piano in the terminal gently in the evening. As an embarkation airport, it still kinda sucks but is getting better.[/perfectpullquote]
[perfectpullquote align=”full” bordertop=”false” cite=”” link=”” color=”#c8300d” class=”” size=”14″]Horrible!!!! I am Stage 4 Triple Negative Breast Cancer with METS to many bones. I am wheelchair bound as walking is very difficult. One of the people was to take me to terminal 15 and instead dumped me at terminal 8 telling me the terminal has been changed. The terminal was never changed and I was simply deserted. People began asking me if I needed help, these were passengers not employees. Never again will I fly through Charlotte.[/perfectpullquote]
Thank you for flying with us
And so concludes our definitive, data-driven guide to ten of America’s busiest airports. During the ensuing data analysis, we’ve discovered insights about airport architecture and uncovered customer experience best practices; we even learned how to use AI to handle a viral press crisis. It’s clear that when visiting an airport, customers care most about staff attitude, cleanliness, and wayfinding (in that order).
Most comprehensive customer experience programs are made up of several different types of studies, the two most common of which are Transactional and Relationship studies. Here we will describe the differences between these two types of studies.
Transactional or trigger-based studies are the base of most customer experience programs. This type of study is conducted among current or recent customers and is used to ascertain the customer experience for a specific transaction or interaction. This type of research looks at near or short-term evaluations of the customer experience and often focuses on operational metrics.
In contrast, the relational or relationship customer experience study is typically conducted among a random sample of the company’s customer base. Relational customer experience is used to understand the cumulative impressions customers form about their entire customer experience with the company. Importantly, this type of customer experience research is often the chassis for ascertaining specific aspects of the experience important to predicting loyalty and other customer behaviors.
A. Transactional Customer Experience
In a transactional customer experience study, we focus on the details of a customer’s specific recent transaction. For example:
The respondent’s most recent visit to Wendy’s
The customer’s visit yesterday to her local Deutsche Bank branch
Last week’s call to the Blue Cross/Blue Shield customer service center
The respondent’s visit, 10 days ago, to Nielsen Nissan in Chesterton, Indiana, for routine auto maintenance.
The overall rating we ask is the respondent’s overall evaluation of the specific transaction (visit, stay, purchase, and service). The attribute ratings are also specific to the specific transaction.
B. Relational Customer Experience
A relational customer experience study is broader in coverage. Here, we ask about the totality of the relationship with a company. In a relational customer experience study, the questions relate to the overall, accumulated experience the customer has had with the company. So rather than ask about the timeliness of an oil change at Nielsen Nissan and the quality of that service, the relational survey would ask for the respondent’s overall perceptions of Nielsen Nissan’s services across all the times the customer has interacted with that dealership.
The overall ratings are often overall satisfaction with the relationship as a whole, willingness to recommend, and likelihood to return. Attributes are similarly broader in scope. We would not ask the customer about her satisfaction with the speed of service for her last oil change, instead we would ask about her satisfaction with the speed of service she usually gets when she visits Nielsen Nissan.
C. Sampling Differences Between Transactional and Relationship Studies
In addition to the content of the surveys, a critical difference between these two studies is the sampling frame. In a transactional customer experience study, we sample customers who have interacted with the company recently. This is also sometimes called “trigger-based” customer experience since any type of interaction with the company can “trigger” the inclusion in a transactional customer experience study.
In a relational customer experience study, we typically sample from the entire base of customers, including people who may not have interacted with the company recently. A relational customer experience study is projectable to the entire customer base, while a transactional customer experience study is a sub-set of customers – those who have interacted recently.
When leveraging customer experience information with internal information, transactional customer experience information is often linked to operational metrics (such as wait time, hold time, staffing levels, etc.). In turn, through the use of bridge modeling, transactional research is often linked to relational customer experience, which is then linked to downstream business measures, such as revenue, profitability and shareholder value-add.
D. Recommendations for Relationship Surveys
Survey Content: As mentioned above, relationship surveys are meant to measure the totality of customers’ experiences with a given company. They are also meant to determine how customers are feeling about the company NOW. It is important to note that customers overall feelings about a company (as measured in relationship surveys) are often NOT the average of their transactional experience evaluations. This is because different transactions, especially if they are negative, can have a much larger effect on overall feelings toward a company than other transactions.
Most relationship surveys contain questions addressing:
Overall Metrics such as Likelihood to Recommend the Company, Overall Satisfaction with the Company, and Likelihood to Return or Repurchase
High-level brand perceptions
Company service channels usage and evaluations such as store/ dealership, finance company, call center/problem resolution teams, etc.
Product usage and evaluations
Share of Wallet measures
Marketing/communication perceptions
Survey Sampling: Who, how often and how many customers do you need to survey? There are no hard and fast rules but remember the idea is to obtain a representative sample of your customers. With that in mind:
Who to Survey: All customers (whether they are recently active or not) should be available for sampling. You also might want to oversample small but important groups of customers (e.g., millennials, new owners, etc.) to ensure that you receive enough returns to analyze these groups separately. However, if you do oversample you will need to weight your data back to your customer demographics to ensure representative overall results.
How Often to Survey: While transactional CX research is usually done on a continuous basis, relationship studies are usually conducted once or twice per year. How often companies conduct relationship studies is usually determined by the number of customers available (i.e., are there enough to conduct the study twice per year?) and when and how often decisions will be made based on the findings.
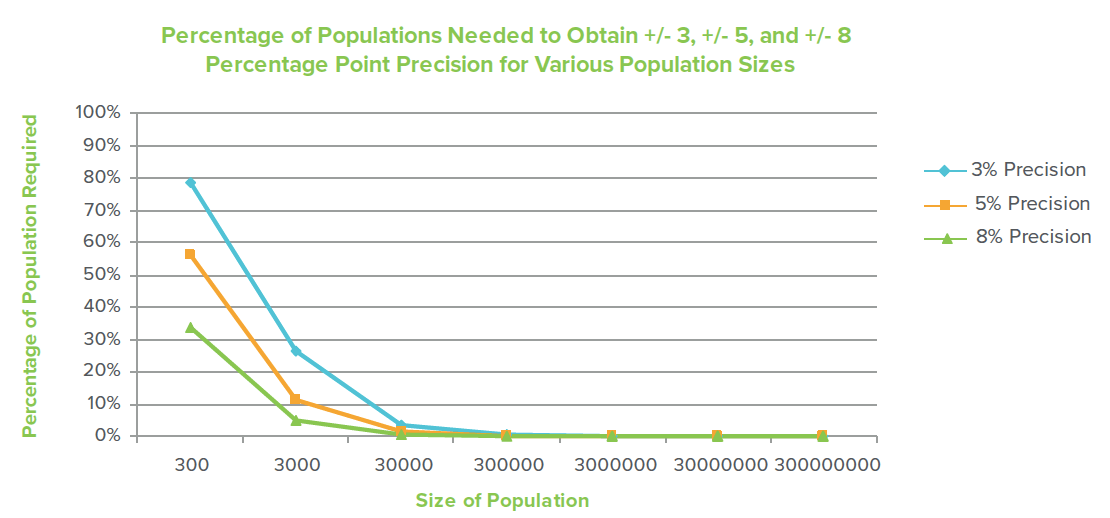
How Many to Survey: This is often the most frequent question clients ask and the basic answer is that it depends on what organizational level you need the results to be representative of. The good news is that if you are only concerned about making decisions on the entire company level, only about 1000 well-sampled responses is sufficient. For most large companies that is a very small percentage of their customers. However, if you want the finding to be representative of lower levels of the organization for comparison purposes (e.g., zones, districts, stores) or want findings to be representative of certain customer groups (e.g., millennials, minorities, long-term customers, etc.) calculations need to be performed to determine the number of responses needed for these groups. Unfortunately, as demonstrated in the chart below, as the population size (e.g., company customers, zone customers, store customers) goes down, the percentage of customers needed to represent that population goes up. For instance, to obtain +/- 3 percentage point precision for a population of 3,000,000 people you only need 1067 randomly sampled returns. That is just 0.04% of the population. For a population of 30,000 people, you need 1030 returns which is 3.4% of the population. For a population of 3,000 the number of returns needed drops to 787, but that is 26.2% of a population of 3,000. For a very small population like 300, you need returns from 234 people (78.0%) of the population.
E. Summary
Both transactional and relationship surveys are key parts of any comprehensive customer experience program. Transactional surveys are great for assessing the quality of specific customer touch points and making improvements in those areas. Relationship surveys allow for the assessment of the entire customer experience across all touchpoints and therefore more closely relate to customer behaviors such as loyalty, customer spend, and customer advocacy.
TELUS is Canada’s largest healthcare and IT provider. They are also the fastest growing national telecom. However, in 2016, TELUS’ CX program was fragmented. They set to work and less than 18 months later, they turned their CX program around and saved $1 million year-over-year which resulted in a 100 percent volume increase in feedback and 45 percent SMS response rate across 3,000 VoC users. By focusing their efforts on reaching more customers with proactive recovery, they have seen a $5 million-dollar opportunity in churn reduction.Their concentration on the user experience and a comprehensive customer follow-up strategy benefited their bottom line. In a recent webinar, Stavros Davidovic, CX Manager at TELUS, shared the details of their program and the numbers behind their CX efforts.
You Need the Right Team
In order to achieve the type of growth experienced by TELUS, having the right team is critical. This needs to be a dedicated internal CX team. Team members need to be empowered to remove barriers, improve timelines, and develop themselves and others as subject matter experts.
Furthermore, as a part of the internal CX team, there needs to be a passionate executive sponsor that challenges the CX team daily. Those that support the CX team in the organization also need to have fair access to resources. Cross-functional alignment is key. Having the right team is not enough, if a customer centric mindset is not ingrained in the organization.
Establish a Customer-Centric Identity
Having a customer-centric identity at an organization means that customer experience is considered at every interaction. At TELUS, the goal is to not only collect feedback and act on feedback, but to do it at every step of the customer journey. This allows for an always up to date pulse on how the customers are feeling, which enables to TELUS to act accordingly. Part of having a customer-centric identity is having a hub for all things feedback related. This allowed for TELUS to be more transparent internally, as well as provide a place for reference material and support. One important part of keeping a customer-centric mindset is to ask the right questions.
Ask the Right Questions
Customers may not give out the detailed feedback you are looking to find. That is why it is critical to ask the right questions. Not just asking the right questions but asking them at the proper key points in order to maximize the impact of feedback. By asking the right questions at key points, you’ll be able to keep your brand consistent, invitations timely and personalized, emphasize the value of feedback to the customer, and properly act on the feedback.
“Customers aren’t interacting with you because they want to, but because they have to. You have to be mindful of that.”
From Fragmented to First-Class
In just 18 short months, TELUS saw a $1 million dollar increase in annual savings, 100 percent increase in volume of feedback, an increased SMS response rate, and a churn reduction of $5 million by reaching 15% more customers. These results were due to establishing the right team that was cross-functional with an executive sponsor, establishing a customer-centric identify that put the customer first in every situation, and asking the right questions at the right point in the customer journey. These things allowed TELUS to slingshot their fragmented CX program to being world-class. For more information and If you’d like to watch the full webinar, you can do so here.
The sale of a product marks the beginning of a business relationship – a relationship that only becomes truly profitable through the service relationship that follows. Ideally, that relationship would last throughout the product and customer lifecycle. Dealer vehicle services, therefore, are not just something that you are obliged to offer customers after you sell them something: It is an essential part of a profitable, long term business model. Predictive maintenance (PdM) – as opposed to routine ex-post or preventive maintenance – offers companies the chance to fundamentally transform their service and business model. For that to happen, they must start seeing PdM not just as a means of collecting data, but as a vital tool for creating additional value in an active partnership with their customers. PdM combines the topics of service and digitization and opens significant new value pockets. But to turn this immense theoretical opportunity into solid reality, dealer service is obliged also to meet certain conditions. Above all, they need to understand that PdM, as a form of “Services 4.0,” is far more than just a question of routine oil change reminders.
Dealer service centers…at the center of the customer loyalty loop
There’s little question that, for the near future, all eyes will be on dealership service departments as the primary source of dealership profit. It’s about time! Service centers have been the primary profit producers for decades. But consistent service customer retention is the unit responsible for bringing those sold customers back for the next showroom sale. Thus the old saying that “sales sells the initial vehicle once, service sells the “all the rest” has never been truer.
The Evolution of the dealer Business Development Center (BDC)
In its day, the launch of the dealership Business Development Center marked a monumental change in the traditional retail auto sales model. Up until then, use of the telephone was left to the discretion of sales agents, who were trained and managed primarily to focus on face to face sales and the “now” transaction. The BDC marked the first formalized effort to improve on the phone skills that sales agents lacked. To be blunt…most dealer sales people are still ineffective on the phone.
When the BDC strategy spread coverage to the service center, that same focus on re-actively answering the phone, in the past was the norm. For far too many service center BDCs, that mindset is still in place today. Retail sales and service leadership speak positively about the importance of retention, but most of their efforts are still stuck in making the appointment for the “now” transaction. While autonomous vehicles and mobility seem to be the hot topic today, those realities are still years, if not decades away from the immediate needs of the day to day retail auto world.
“We are in the midst of seeing more change in the next five years than we’ve seen in the last 50 years.” Mary Barra, General Motors CEO
The connected car and predictive maintenance are the “next big thing”
Autonomous vehicles and mobility are still years off from attaining meaningful scale. Far less coverage is being dedicated to the “connected car”…with the promise of replacing mileage-based maintenance recommendations with predictive certainties. Vehicle telematics have the ability today to alert the owner of a potential breakdown ahead of the occurrence. I spoke to this opportunity in this Cafe post earlier this year. And I followed it up by this post signaling that today’s service center was not near ready to deliver those predictive alert.
So the technology part of predictive data delivery is available, but the delivery of those services at the dealer end is far from being in place. Dealer service BDCs are not equipped, both in the BDC agents’ capabilities and front line culture to deliver the interface to the end user customer.
Service BDC agents, like service center front lines, are still stuck in a reactive, “after” the breakdown culture
It’s hard to change the culture of any department in a dealership! But consider this: if service BDC agents are challenged simply to convince customers to make appointments for preventative, routine maintenance…won’t they be even more challenged to persuade customers to schedule service before a breakdown occurs? There’s a great deal of difference between scheduling inbound appointment calls and that of an outbound call attempting to convince a vehicle owner to schedule a service that will specifically prevent an impending malfunction before a breakdown occurs. Customers are inherently suspicious of dealer service preventative mileage recommendations…convincing them of predictive maintenance will be a new challenge altogether.
A new script and higher skill set for BDC agents
While service customers are familiar with mileage-based oil changes, they don’t always act in a timely manner to take action and bring the vehicle to the service center. Presently, BDC agents use repetitive calling to nudge customers to act. In other words, they focus more on reminder calls and less on persuasion skills to motivate the customer to act now. But relying on a repetitive call model won’t be effective for the future of “predictive maintenance.” Service centers will have to either train or recruit to a higher agent skill level in the future. Repetitive “reminder calls” won’t convince customers to act on a maintenance service they don’t understand. Agents must be believably persuasive to a level not practiced today.
And scripting will undergo dramatic changes as well. Repetitive “friendly reminder” calls will not be effective for owners who cannot visualize the benefit of a service that will specifically eliminate breakdowns before they occur. That call messaging will center on the agent’s ability to connecting with the “feelings” of the vehicle owner.
Service BDCs evolve from “cost/expense” to the “revenue/profit”
Most dealers are still using an antiquated P & L strategy, where sales receive all of the credit (and marketing budget) for the first sale, but for repeat sales as well. However, a high percentage of those repeat sales are the result of the positive customer experience delivered by the service center. Past customers usually don’t return for the next vehicle purchase if their service experience was unacceptable.
As customer experience manager for a large GM dealer, I was included in the weekly marketing meeting where tens of thousands of dollars were spent every month for attaining new customers. However, in all of those meetings, I never heard one mention of allocating any of those ad dollars to the service department for “retaining” repeat vehicle purchases.
Hopefully, the successes achieved with predictive maintenance will clarify even more that sales sells the first vehicle…and the positive experience delivered by the service center sells the rest.
You’ll never see a dealership Google image that isn’t like the one above—a smiling couple, seemingly happy with their experience of buying a vehicle. But are car buyers really that happy with the sales experience they receive, or happy to have it behind them?
Are they still smiling with the dealership experience after the initial sell? Did the sales staff properly introduce them to the next phase of their dealership customer journey, the service center? Was their “service experience” with free maintenance and warranty work after, well delivered? Did the follow-up experience after the sale consist of the typical, but dated, dealership follow up email of “congratulations” and maybe even a birthday card before they were receiving “pitches” for their next vehicle purchase?
Ask most any dealer principal or general manager and they’ll tell you that customer retention is front and center on their list of priorities. But with many dealers, when you measure the dollars formally allocated towards customer retention, those numbers are usually nowhere to be found.
Where are the Customer Experience Dollars?
As Customer Experience Manager for a large automotive dealer, I was fortunate enough to be invited to weekly advertising meetings between our leadership and ad agency. The purpose was to discuss what worked, what didn’t work and what was ahead.
But never, in all those weekly meetings, over almost three years of attending, did I ever witness one discussion about retaining past customers. There was time spent discussing community events, but no time spent on a formalized strategy for retention.
What was discussed? Facebook, YouTube, Snapchat, Pandora, Instagram, television, radio, on-site remotes, and even newspaper to the tune of tens of thousands of dollars spent each month on “getting them” and not one formal dollar designated for “keeping them”.
It is assumed in far too many dealerships that a respectable majority of past buyers will return because of the warranty or the free first maintenance offered by the manufacture. But after that, at roughly three years for leases and five to seven years for vehicle purchases, research reveals they begin to go elsewhere for service, mainly to an independent repair shop or franchise.
The Typical Dealership Sales Model
The sales funnel has been used in retail auto for decades, but where is the “retention” part of the model? Many dealers would answer that they have their have their own rewards program for retention, but is it a rewards program that provides surprise and delight on a continual basis? Or like most dealer rewards programs that only apply discounts on products and services? What’s surprising and delightful about that?! Will that be enough reason for the client to return if the previous sales or service was poor?
Candidly, most dealer “experiences” are transactional. And when the showroom sale is completed, and the vehicle is delivered to the customer, most of the focus is on the next prospect (new prospect generated by ad dollars). Dealership retention efforts are mainly focused on the experience of buying and servicing the car, but will that top-of-mind awareness remain in the vehicle owner’s mind three years later when the lease is up? Will it trigger an initial contact with that car buyer to return to that same store five to seven years later when the vehicle owner starts a new car search?
The Loyalty Loop: an inclusive model for sales and retention
Where is “the funnel” for client retention? Where is a formalized model for dealer retention of past customers? The Loyalty Loop was developed by Mckinsey and Company, a top consulting company used by many of the country’s top companies. But look how it focuses on a loyalty loop inside the traditional sales model. That inside loop consists of what the customer experiences with the dealer between car purchases.
While rewards programs are better than nothing, those rewards are not what I would call surprise and delight. They also offer discounts that involve coming to the dealership. Even though we know that vehicle owners are usually not surprised and delighted to return to the dealer for most anything.
Here’s an example of surprise and delight. Some dealers give FREE car washes as a retention tool. All the owner needs to do is come to the service lane to redeem it. But most customers don’t want to come to the dealer for anything. How about this, give them a free “mobile” car wash. Now that’s surprise and delight!
The Ownership Retention Gap
Consider these NADA statistics with respect to the retention of previously sold customers:
Dealers spent an average of $7.00 on retaining their already sold customers (2017)
Luxury dealers spent an average of $762.00 on each vehicle sold, non-luxury spent $670.00 (2017)
Average gross on referral vehicle sales was $1,200.00 vs $817.00 for fresh “ups”
Referrals have a 51% service usage vs 29% for fresh ups
Referrals have a 96% CSI score vs 73% for fresh ups
What’s is wrong with this picture? Far too many dealerships are ignoring their past customers who would be more loyal, produce more gross per vehicle, send referrals, deliver higher CSI scores and use their dealer service center more often than “newsuspects” who consume most all of the monthly ad budget for dealers.
You often hear of the positive power of a smile. A recent business trip brought this to light to me, as well as the negative power that is portrayed when it is missing. My colleague and I were on our way to see a client and we decided to stop and get a coffee. The first coffee shop we came upon is a nationally well-known one, and especially here in New England—and even especially more in Quincy, MA. It was a long drive and we still had a way to go. We were really looking forward to a nice coffee and having optimistic discussions about our upcoming meeting.
As we approached the counter, we were ignored for about minute while several employees chatted a bit amongst themselves. Of course, one minute can feel like ten when you are standing there awkwardly waiting for someone to acknowledge your presence. However, we patiently waited until the representative made eye contact with us. With no smile or greeting whatsoever, and with a clearly visible “I hate my job” look and tone, she said to us “What would you like?” We ordered, and once we got back to the car with our coffees, both looked at each other and at the very same time said “Wow!”. We could not believe the lack of customer service and left there feeling like we were a bother and not wanted. Why would we ever go back there? The answer is we wouldn’t, and we won’t. While the coffee was decent, the service certainly wasn’t.
As we reached our destination, we again stopped for another coffee, this time at another equally and nationally well-known coffee shop. That experience was the complete opposite. We were greeted with a smile, asked how our day was going, and how they could help us. We felt acknowledged, invited, appreciated, and left feeling quite pleased and positive.
This experience reminded me of a great article I read a few years back called, “4 Reasons Why Excellent Customer Service Should Start with a Smile,” by Kaan Turnali in Digitalist Magazine. In the article, Kann explains that what’s often missing is a smile, a key element of customer service and business interactions.
Here are four reasons why excellent customer service should start with a smile:
A Smile is More Than an Expression
Smiling isn’t just something your face does. It communicates your state of mind. A smile—or the nonvisual sense of a smile for telephone customer service representatives—can be the most significant part of a business transaction. In retail, it can influence people’s perception of a brand and their customer satisfaction.
It can enhance the exchange of a product, the sharing of knowledge, or the offer of a solution As Internet and mobile commerce take market share from traditional brick-and-mortar businesses, smiling as a state of mind is more important than ever.
A Smile is More About a Mindset
Smiling is as much a reflection of an organization as it is a validation of that organization’s promise. It helps form the customer’s first impression, an indication of a pledge to offer a satisfactory product or service. It plays a role in everything we do, in every transaction we touch, in our relationship with every customer we help. It starts before we first interact with our customers, and it certainly does not end when the transaction is complete.
A Smile is an Attitude
Smiling tells our story beyond first impressions. It is a personal touch that extends our customer service promise and reflects our passion. Smiling says that we want to be here serving our clients and customers. It says that we are ready and willing to go the extra mile. And we smile even when we are not face-to-face with clients or customers. Our tone of voice on the phone and style of our correspondence communicate a virtual smile—or the lack thereof.
We cannot control everything that unfolds during customer interactions, but we always control the attitude we convey, such as amiability, energy and excitement, as well as commitment to satisfying the customer’s wants or needs. Even though a smile can’t solve every problem, in many cases, our attitude can triumph over many complications that can occur during the transaction and our smile can become a competitive edge.
Most Important: A Smile is an Invitation
Smiling sets a tone. It establishes a rapport and initiates trust, the cornerstone of every business relationship. This last point is more relevant than ever as we struggle to retain that integral factor in our fast-paced, smartphone-addicted, multitask-driven culture. Technological advances, globalization and new business models have us spending more time working remotely on our devices, which also makes us more remote.
Bottom line: Whether the transaction is business-to-business (B2B) or business-to-consumer (B2C), a smile is one of the easiest components to get right. Omitting smiles from the equation leaves out the crucial ingredient in any business interaction.
So, as we learned from the experiences I shared above, it takes more than a good cup of coffee to keep customers coming back. Good service is just as important as a good product, and it all should begin with a smile.
Certified Customer Experience Professional (CCXP) Joe Camirand along with HorizonCX, LLC aims to improve operational and financial results for small and medium-sized businesses through Voice of the Customer (VoC) strategies. Learn more at www.horizoncx.com


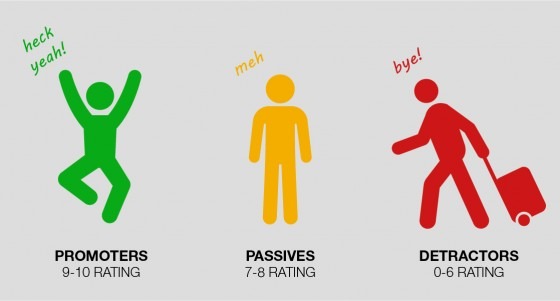
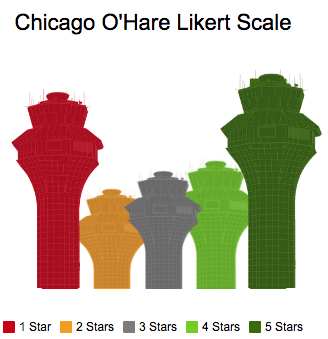

![[AtlantaThemeVolumeVersusNPS.png]](https://inmoment.com/wp-content/uploads/2022/03/AtlantaThemeVolumeVersusNPS.png)
![[woman feeling overwhelmed by customer reviews.png]](https://inmoment.com/wp-content/uploads/2022/03/squashed_gray01-300x291.png)
![[woman who used to be overwhelmed now inspired by sentiment-analyzed customer reviews.png]](https://inmoment.com/wp-content/uploads/2022/03/squashed_color01-300x291.png)
![[SFOReportsDashboard.png]](https://inmoment.com/wp-content/uploads/2022/03/TextAnalyticsReportsDashboard2-1024x576.png)
![[SuccessfulVoCProgram.png]](https://inmoment.com/wp-content/uploads/2022/03/Lexalytics-E_Book-2018-Graphics_5-Success-1024x966.png)