Choosing the right partner for your CX program is essential for creating a memorable customer experience and increasing customer loyalty. 73% of customers say that a good customer experience is one of the biggest deciding factors for brand loyalty.
It’s clear that creating memorable experiences can not be overlooked, which means choosing a partner for your CX program is one of the most important decisions you will make for your business.
InMoment recently held a webinar featuring Forrester, an independent, research and advisory firm. InMoment’s Principal CX Strategist Jim Katzman and guest speaker from Forrester, Senior Analyst Colleen Fazio discuss decision-making in regards to CX program initiatives, finding the right program size, proving ROI in your CX program, and more. Let’s dive into what we covered on our webinar.
Setting Up Your CX Program for Success
Whether you are a small startup or a large corporation, defining the right size for your CX program is the first step towards success. The scale of your CX program should align with your organization’s resources, goals, and customer base. If your program is too small, it may not move the needle at all. Conversely, an overly ambitious program can overwhelm your team and drain its resources.
The team designing your CX program plays a pivotal role here, as crafting a strategy that is neither too ambitious to execute nor too modest to make an impact. At InMoment, we share a framework for success with our clients which we call the Continuous Improvement Framework. This framework consists of five steps, the first of which is design. When designing a CX program, we guide our clients to “design with the end in mind.”
It is necessary for you to set clear, measurable objectives from the outset, which can guide the design and implementation phases of your CX program and provide a clear way for evaluating success. The team designing your CX program should work closely with other departments, such as marketing and operations, to ensure that the CX teams in an organization are aligned and do not operate siloed from one another.
Proving the ROI of Your CX Program
In an era marked by economic challenges, it is important that you embark in designing, actioning, and proving an ROI focused experience program. In today’s competitive and financially constrained environment, organizations are under more pressure than ever to justify their investments in customer experience.
You need to develop a well-defined and quantifiable approach to measuring the ROI of CX initiatives, which is essential for securing ongoing support and funding from senior leadership.
But as any CX professional knows, tracking the performance of your CX program is only half the battle. It is important to vocalize and share the wins your business has achieved through your CX program. InMoment believes that sharing your wins, whether that is increased sales, increased customer acquisition, or increased net promoter score, is the last step in how you prove the ROI of customer experience in your organization.
How to Find the Perfect Partner for your CX Program by Asking the Right Questions
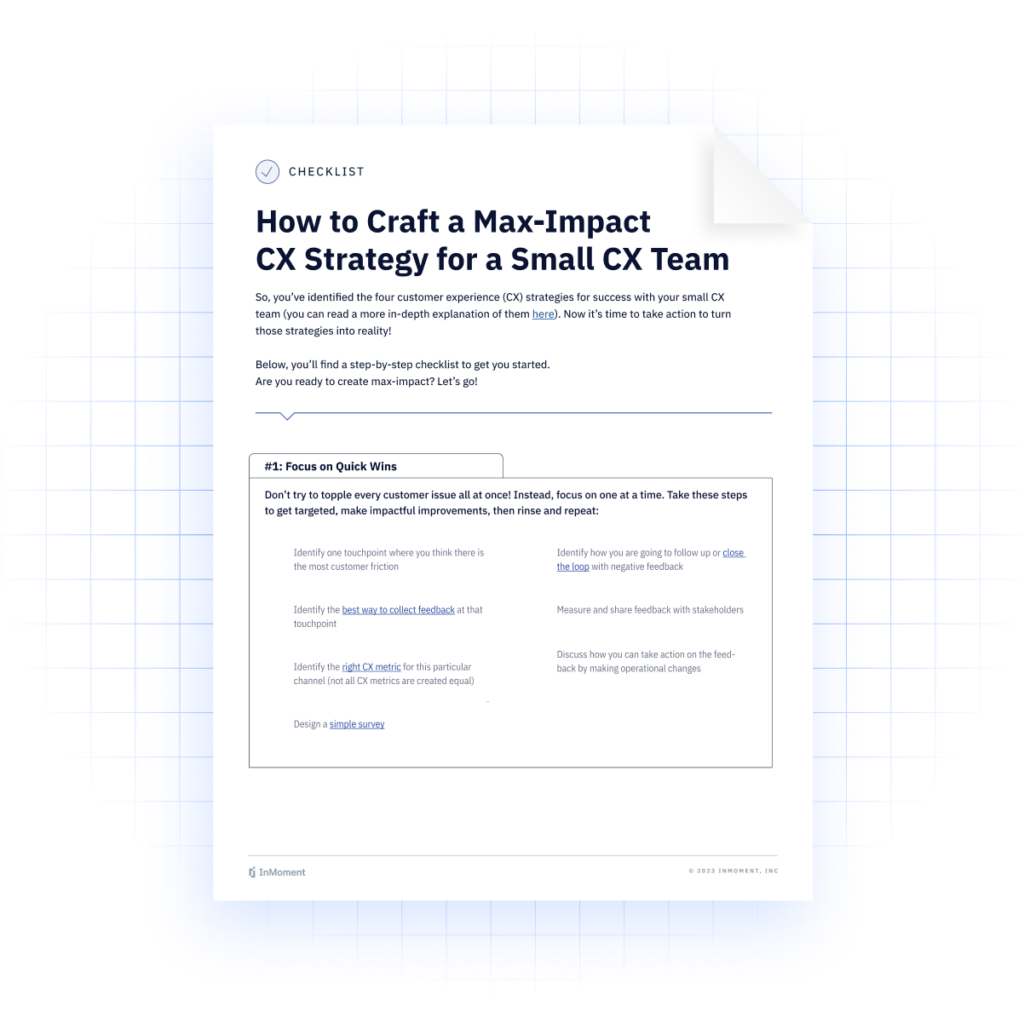
At this point, you should have the skeleton of your CX program built because you have already determined its size, and InMoment doesn’t think you need a huge team to be successful. Checkout how you can craft a max-impact CX strategy for a small CX team.
You should have also determined the metrics you are going to measure to track success and measure the ROI of your CX program.
Now, before choosing a partner for your CX program, there are questions that you need to ask yourself. It’s easy to get carried away here, so at InMoment we’ve narrowed it down to five questions that you can’t miss.
1. What are you trying to achieve with this partnership?
Before selecting any vendor or partner, you need to know what you are trying to get out of it. As we talked about earlier, you need to have a definition of success, and clarity on your objectives.
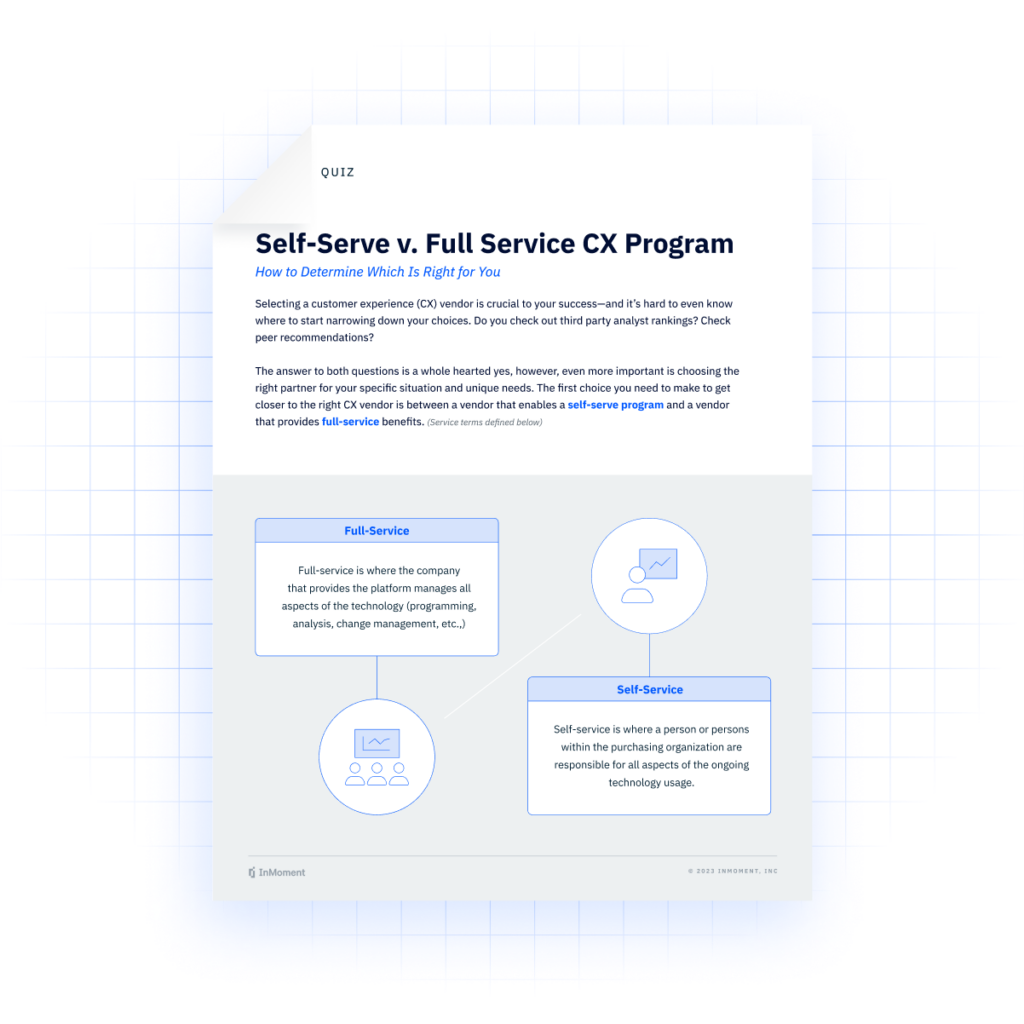
You also need to think about what you want a vendor to help you with in regards to your CX program. Are you looking for a self-serve solution or a full-service solution? Not sure? Then, you should start by taking our quiz that will help you do just that! Take our self-serve vs. full-service CX quiz here!
2. What are your non-negotiables for your CX Program?
Defining your non-negotiables upfront is crucial in selecting a CX partner that aligns with your business values and priorities. These could include factors like data security standards, cultural alignment, or specific service offerings that are indispensable for your organization. By identifying these essentials, you ensure that your partnership is built on a solid foundation, minimizing potential conflicts down the line.
3. How will this partnership support our strategic objectives?
Choosing a CX partner isn’t just about finding a solution; it’s about finding a strategic collaborator. Understanding how the potential vendor’s capabilities align with your broader business goals ensures that the partnership contributes to your overall growth strategy. A vendor that complements your strategic objectives can bring fresh insights and innovation, enhancing your CX program’s impact on customer satisfaction and customer loyalty.
4. What is your budget, and how does this vendor align with it?
Budget considerations play a pivotal role in vendor selection. Before committing to a partnership, it’s essential to have a clear picture of your budget and how the vendor’s pricing structure fits within it.
While cost is a significant factor, it’s equally important to assess the value the CX partner provides relative to the investment. This ensures that you make an informed decision that balances financial feasibility with long-term gains.
5. What are the potential risks of a CX partner, and how can they be mitigated?
No partnership is without risks, and understanding potential pitfalls is a crucial step in vendor selection. Identifying risks, whether they pertain to data privacy, service disruptions, or misalignment with your organization’s values, allows you to put mitigation strategies in place. By addressing these concerns proactively, you can safeguard your CX program and establish contingency plans that ensure business continuity even in challenging situations.
By encouraging a thoughtful and rigorous questioning process, organizations can avoid common pitfalls and establish partnerships that are both fruitful and sustainable in the long term.
InMoment CX Program Success Stories
Companies like Foot Locker and alphabroder are two companies that have chosen InMoment as their CX program partner and have improved their metrics by focusing on the customer experience and employee experience. They have managed to align their CX strategies closely with their business goals, providing a roadmap for other organizations aiming for similar success.
When crafting a CX strategy for your own organization, remember to look at what industry leaders are doing to see if any of their strategies can be adapted for your own organization. Remember, the most successful companies are those that are willing to regularly reassess their strategies, learn from their experiences, and make data-driven adjustments as needed.
In Moment’s take on Finding CX Program Success in the Future
Crafting a successful CX program demands a thoughtful, strategic approach rooted in the unique needs and goals of an organization. It’s crucial to establish clear objectives, aligning CX initiatives with broader business goals that drive tangible value.
The right CX platform should empower teams with immediate, actionable insights. Maintaining momentum in a CX program requires ongoing governance, regular reassessments, and a willingness to adapt as the business landscape evolves. It’s about building a culture that puts the customer at the heart of every decision, every process, and every interaction.
The experts at InMoment have developed a simple strategy to help you find ROI in your CX program. If you can master the four pillars of customer experience ROI, then you’ll never have a problem proving the business value of your CX program.
Want to see how InMoment can be just the partner that your CX program is missing? Click here to see what we can do for you!