Qualtrics acquires experience management leader Press Ganey Forsta, expanding the world’s largest human experience management AI & data platform.
|
Read more.
Do companies recognize the high customer experience (CX) value of employee advocates? Shouldn’t they want to cultivate the kind of behavior advocacy represents?
That’s my belief. And, because of dramatic, behavior-shaping trends in the world of talent and skills availability, significant and lasting disruptions in the way people work, and the greater independence of today’s employees, I’m convinced they should both recognize and cultivate it.
The EX/CX Connection
Employees are the key, critical common denominator in optimizing the customer experience. Very often, either directly or indirectly, they are at the intersection of customer/vendor experience. Making the experience for customers positive and attractive at each point where the company interacts with them requires an in-depth understanding of both customer needs and how what the company currently does achieves that goal, particularly through the employees. That means that companies must seek to understand, and leverage, the impact employees have on customer behavior. Further, and equally important, they must focus on optimizing the employee experience.
Supporters of employee satisfaction and engagement programs, research and training techniques, with their focus on retention, productivity, and fit or alignment with business objectives, have made some broad, bold, and often unchallenged, assertions with respect to how these states impact customer behavior. Chief among these is that, beyond skills, everyday performance, and even commitment to act in the best interest of their employers, employees have natural tendencies and abilities to deliver customer value, fueled by emotion and subconscious intuition.
Though on the surface this sounds plausible, and even rather convincing, a thorough examination of how employee satisfaction and engagement link to customer behavior will yield only a tenuous, assumptive and anecdotal connection. In other words, there is much vocal punditry, and even whole books, on this subject, but little substantive proof of connection or cause.
Powerful and advanced research can generate insights which enable B2B and B2C companies to identify current levels of employee commitment, and it provides actionable direction on how to help them become more contributory and active brand advocates. Employee advocacy, as an advanced EX core concept and research protocol, was designed to build and sustain stronger and more commitment-based and rewarding employee experiences and also improved customer experiences, driving the loyalty and advocacy behavior of both stakeholder groups, and in turn increasing sales and profits.
It is often stated (especially by corporate CEOs) that the greatest asset of a company is its employees. Emotionally-based research has uncovered specifically how an organization can link, drive and leverage employee attitudes and behavior to expand customer-brand bonding and bottom-line performance. This is advanced EX, some might even say it is revolutionary! Employee advocacy research can be combined with existing customer and employee loyalty solutions to provide companies with comprehensive and actionable insights on the state of their employees’ attitudes and action propensities, and how those may be affecting customer behavior.
Employee advocacy identifies new categories and key drivers of employee subconscious emotional and rational commitment, while it also links with the emotional and rational aspects of customer commitment. At the positive and negative poles, these employee-focused commitment categories include:
– Advocates, the employees who are most committed to their employer. Advocates represent employees who are strongly committed to the company’s brand promise, the organization itself, and its customers. They also behave and communicate in a consistently positive manner toward the company, both inside and outside.
– Saboteurs, the employees who are the least committed to their employer. Saboteurs are active and frequently vocal detractors about the organization itself, its culture and policies, and its products and services. These individuals are negative advocates, communicating their low opinions and unfavorable perspectives both to peers inside the company and to customers, and others, outside the company.
In any group of employees, irrespective of whether they are in a service department, technical specialty, or a branch office, there will be differing levels of commitment to the company, its value proposition and brands, and its customers. If employees are negative to the point of undermining, and even sabotaging customer experience value and company or brand reputation, they will actively work against business goals. However, if employees are advocates, and whether they interact with customers directly, indirectly, or even not at all, they will better serve and support the organization’s customers.
Employee Advocates are Essential to Customer Experience—and Overall—Success
Where customer experience is concerned, it is essential to remember that organizations and brands looking to succeed in today’s competitive climate have successfully embedded CX into their cultures, from the C-level executive to the frontline employee. They prosper by using insights generated from a variety of channels and touchpoints, including employees, integrated with customer data from multiple sources, mined by sophisticated text analytics technologies, and then channeled to steer and guide every corner of their businesses.
The more successful the brand and organization, the more evident that the approaches taken are both bottom-up and top-down. This helps ensure a more strategic and real-world view of stakeholder behavior. Truly effective organizations have wisely invested key resources in the stakeholder experience. and at every level of the enterprise. Their leaders, likewise, focus on both individual and collective accomplishment.
This kind of achievement and fulfillment requires that experiences be optimized for all stakeholders. It’s a simple, basic premise, but it works – now and for the future. Ideally, there should be a direct linkage back and forth between the leader, the employee, and the customer. This is where employee advocacy, like the edelweiss flower, can bloom and grow.
It is a fact that CX survey response rates have been declining. Additionally, we are being surveyed more and more every day about every mundane thing in our lives. Even the federal government is in on it—an executive order in 1993 directed federal agencies to gather public feedback on how well they delivered services and to strive to offer a comparable level of customer experience with private companies. Orders similar to that one have continued into the present day.
But, with surveys being the lifeblood of nearly all customer experience (CX) programs, what is a CX practitioner to do to improve their CX survey response rates? Much has been written about the tactical things a survey owner can do: list hygiene, fatigue or quarantine rules, visual appeal of the invitation, subject line, formatting, time estimates in the invitation, etc. And while these elements can have some impact, they are temporary band-aids for the over-surveying problem.
The Secret to Improving CX Survey Response Rates Is…
I’ll let you in on a secret: if you truly want to improve and sustain your response rates, look to your CX program (specifically your closed loop processes). There are two critical things any company can do to improve its response rates, and they tie back to the inner and outer loop concepts described in the Net Promoter SystemSM.
You’ve probably heard that it’s vital for organizations to close these loops, as doing so can help you achieve everything from Experience Improvement (XI) to enhanced customer retention and sustained business growth. That’s true! But effectively closing these loops also provides an incentive and opens a door for continuous feedback from your customers or members.
The Inner Loop
The inner loop refers to the systems, processes, and teams that organizations use to respond to customers one-on-one to address negative feedback. Having an effective inner closed loop process is of obvious importance to any company that wants to keep its doors open, let alone create a differentiated and meaningful experience for customers. Fail to close the inner loop, and you open the “leaky bucket.”
However, if you can build a system that allows you to receive customer feedback, analyze it for actionable insights, and respond both meaningfully and expediently, you’ll have a much easier time retaining customers and extending their lifetime value. You will learn more about their individual preferences and may even potentially cross-sell or upsell them to additional products and services.
There is also plenty of research that demonstrates that customers whose complaints have been successfully resolved tend to leave higher review scores than customers who never had a complaint in the first place! Finally, by responding to customers when they have complaints, you demonstrate that you have listened and acted on their feedback, giving them a strong incentive to provide feedback again in the future.
The Outer Loop
The scope of the outer loop is considerably wider than that of the inner loop and requires more organizational resources, cross-silo cooperation, and team coordination. Rather than focus on individual customer interactions and complaint resolution, the outer loop is about the actions your organization takes on the collective feedback you’re receiving to drive Experience Improvement and communicate those improvements back to a much broader segment of customers (if not your entire customer base). The one-on-one interactions that comprise the inner loop are certainly important, but the outer loop is all about incorporating those into a cumulative group effort to drive sustained Experience Improvement.
This improves your CX survey response rates by demonstrating to all customers that your organization truly does care about feedback and attempts to take action to improve the overall customer experience. This provides a feedback incentive even for customers who may not have shared it in the past, as they see the direct benefit.
Widening Focus
Click hereto read my full-length Point of View on how focusing on your CX program will actually help you achieve better outcomes. In the meantime, take advantage of anything you might have learned here to meaningfully improve your inner and outer loop processes. I promise you you’ll see a difference.
If we were to sum up what brands need to know about Gen Z customer experience preferences (and employee experience preferences) in a few words, it would go something like this: they’re different. Revolutionary even. This may seem like an oversimplification, but when you think about it, Gen Z grew up in a world that is more connected than ever, has more access than ever, and accomplishes everything faster than ever. It makes sense, then, that their standards for customer and employee experiences would be higher than ever, too.
Because Gen Z makes up 26% of the global population, their preferences should already be playing a significant role in your business strategy—and their influence will only grow! That’s why we put a magnifying glass over these emerging consumers and employees in our recent 2022 Experience Trends report, to give you the intelligence you need to create a positive impact with Gen Z, whether you’re trying to convince them to become loyal customers or recruit them to be engaged employees.
Here’s what you need to know according to our data:
What Is Most Important for the Gen Z Customer Experience & Employee Experience?
Tip #1: Seamless and Efficient Experiences Are a Must
We’ve spent a lot of time on the InMoment blog discussing the importance of a seamless experience. It doesn’t matter what channel or touchpoint, your customers and employees should have a sense of consistency every time they interact with your brand. And for Gen Z, seamless experiences are table stakes when it comes to maintaining their loyalty. Gen Z shops both online and in store, so it’s imperative that they are able to experience the same level of convenience, personalization, and general experience excellence across the board.
Tip #2: Gen Z Is Unlikely to Complete a Traditional CX or EX Survey
Get ready for a mic drop moment: Gen Z is simply less likely to fill out a traditional survey. In the course of our research we found that:
In the US:
Only 19% of your emerging customers (Gen Z) are likely to complete a traditional survey
Only 22% of your emerging employees (Gen Z) are likely to complete a traditional survey
In Canada:
Only 28% of your emerging customers (Gen Z) are likely to complete a traditional survey
Only 41% of your emerging employees (Gen Z) are likely to complete a traditional survey
So what feedback collection methods should you be using if you want to gauge the Gen Z customer experience? We suggest Microsurveys, social media and review sites, and live chat to gain the intelligence you need to compete for Gen Z’s loyalty.
Thinking of adapting your approach to customer experience surveys, and customer feedback in general? Our experts have derived a four step process to help you leverage all of your data, and only send surveys when they’ll be most effective. Check it out for free here!
Tip #3: Social Media Influencers Have Significant Reach
Gen Z’s first exposure to your brand is likely via social media, and more specifically, through social media influencers. We asked Gen Z consumers about whether they used an influencer code to make a purchase in 2021, and if they are likely to use influencer discount codes in the upcoming year. Here’s what they told us:
One of three emerging Gen Z customers had used a social influencer code in 2021
One of three emerging Gen Z customers were planning to use a code in 2022
From these numbers, it’s clear social media influencers will continue to, well, influence the emerging consumer. If you haven’t considered leveraging influences to acquire new customers, then it’s time to start!
Tip #4: Strong Brand Values Are Make-or-Break
Gen Z has high standards when it comes to the brands they support, and even higher standards for the brands they work for. When looking into a possible employer, our research found that Gen Z is looking for three primary values. Here they are as explained by Gen Z:
Culture: “[I] am likely to choose a [company] that allows me to express myself […] and [get] creative with mentorship and support.”
Diversity: “I’m looking for [a company] that bring in diverse [experiences and] talents that can challenge one another.”
Connectivity: “I believe that success [means] bringing everyone together […] we all [want] to be part of the equation [not just our executives].”
To successfully recruit this value-driven generation, brands should take care to emphasize these core values in job descriptions, internal messaging, and beyond.
Tip #5: Gen Z Has Little Tolerance for Bad Behavior
We’ve all seen the news stories: customers in store or aboard flights displaying outlandishly bad behavior when confronted with mask policies or low stock of desired items, and taking their anger out on employees. We were curious about what Gen Z thought of these displays and whether it affected their perception of the brand involved.
We asked, “What would you think if you witnessed a customer acting aggressively toward an employee at a place of business?” Gen Z responded with overwhelming compassion for the employee in the situation, and even mentioned that “I would interject […] No one should be treated that way.”
What Are You Doing to Prepare for the Next Generation of Consumers & Employees?
As Gen Z becomes an even more prominent customer and employee segment, their CX and and EX preferences will become even more important to your business. So what are you doing today to emphasize and enable Gen Z customer experience expectations? How are you connecting with them? How are you collecting feedback from them to understand how they perceive your brand?
You need to have a strategy in place, and our experts are here to help. Learn how our XI Platform can support your efforts to create optimize Gen Z customer experiences by reaching out to us here or in the chatbot at the lower right hand corner of your screen. You can also read more from our 2022 Experience Trends Report here!
You’ve been using Net Promoter Score in all the right ways, and now you’re looking to advance your CX program. Fear not, you’ve come to the right place!
The next level of CX for Growth Stage companies focuses on a few key things:
Taking a more holistic view of the entire customer journey
Leveraging technology to listen to hundreds and thousands of customer comments
Employing robust analytics
We’ve previously explained how to quickly build your first customer feedback program with a single survey like Net Promoter Score in a single channel. Now we’ll combine surveys with behaviors and concrete numbers to see how CX impacts metrics like product use, retention, and sales.
Yes, it’s time to level up your CX program!
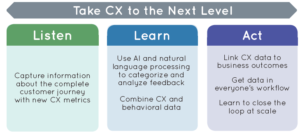
We’re sticking with the 3-step Listen, Learn, and Act model but upgrading each step’s activities from Early Stage to Growth Stage CX programs.
Step 1: Listen
In this step, you’ll gather information across the customer journey. Many people at the Growth Stage have already identified critical touchpoints in the customer journey that drive success, including:
Achieving first value
Support interactions
Using a new product or service
The Listen step focuses on asking the right questions at these touchpoints to help you optimize your CX. During the Early Stage, you offered up the Net Promoter Score survey. Now it’s time to move on to two other important customer experience metrics.
Customer Satisfaction Score (CSAT)
The Customer Satisfaction Score (CSAT) asks customers how satisfied they were with a recent interaction, like a support call. CSAT is the most popular CX metric for transactional interactions, and you use it to gauge how well these interactions are being handled.
How might you use CSAT? If you’re with an e-commerce company, you likely use it to get post-delivery feedback on a purchase. At SaaS companies, product teams use a CSAT variation called a Product Satisfaction survey (PSAT). It’s often triggered in-app to get feedback that helps product teams optimize the user experience.
Customer Effort Score (CES)
The CES survey asks, “How easy was it to _________?” CES is used to improve systems that may frustrate customers. It allows you to capture early feedback and discover ways to make sure the path to the all-important first value is smooth.
Use CES surveys to measure how customers feel about their onboarding, which is the critical first step of the customer journey. It’s much easier to retain a customer who has had an excellent first experience with your product than win over a customer reeling from poor onboarding that missed the mark.
When you combine the information gathered from NPS, CSAT/PSAT, and CES, you can uncover previously hidden areas of the customer journey and understand how those affect overall CX.
Step 2: Learn
You now have a plethora of customer feedback from your three surveys, and it’s time to extract actionable insights. The important thing to realize here is you’re collecting feedback from thousands of surveys. That amount of data quickly becomes hard to address at scale, and text-match tags won’t capture the wealth of information available. You’re going to need more advanced tools than what you used at the Early Stage.
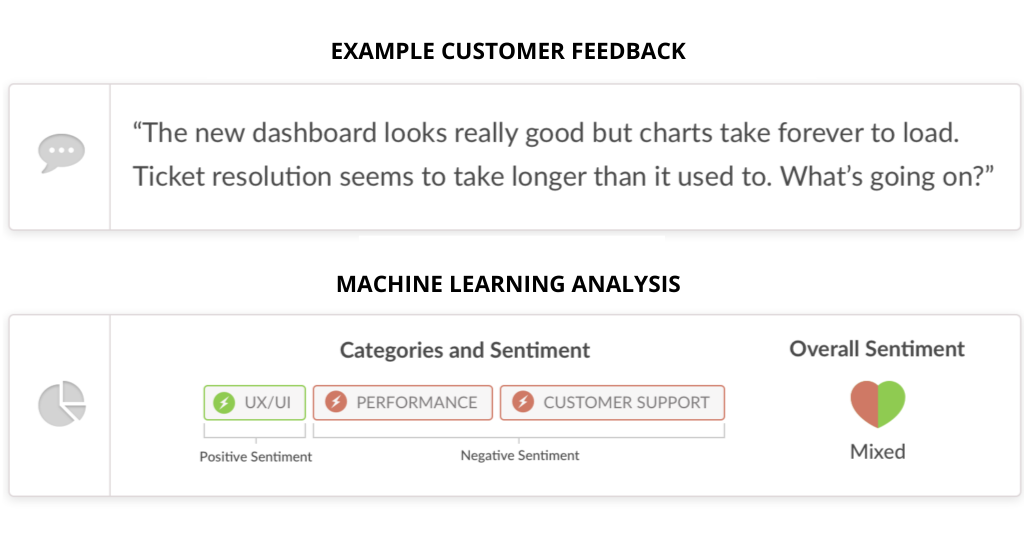
Customer insights through machine learning
The most insightful input from customers comes in the free-text portion of your surveys. To mine that rich data, you’ll need a tool that uses Natural Language Processing (NLP), a form of AI for real-time text categorization and sentiment analysis.
For many businesses, the wealth of customer experience data has become overwhelming. Artificial intelligence gives us the means to retake the initiative.
– Jessica Pfeifer CCO, Wootric
Advanced tools for the Growth Stage Learn step share two essential elements:
Categorization in real-time
One of the reasons you’re not manually analyzing the text is you don’t want to wait weeks for insights, and your customers certainly don’t want to wait that long for action. Natural Language Processing allows computers to auto-tag, interpret, and analyze text data as new topics arise, highlighting any issues immediately so you can take timely actions.
Sentiment analysis
Simply put, sentiment analysis tells you why your customers do or don’t love you. NLP performs sentiment analysis on your customer and user feedback, taking you way beyond the traditional text-match tagging. Not only is every topic tracked over time, but NLP also tracks the positive and negative tone and tenor of the customer voice. In a quick review, you can instantly gauge whether a specific product touchpoint performs well for your customers. This lets you see how your business initiatives are affecting your users in real-time.
Auto-categorizing feedback is a powerful step in VoC, taken with the help of new technologies like Natural Language Processing.
Link CX metrics to business outcomes
You can tie CX directly to business outcomes by linking customer survey data to business-focused metrics like purchases, conversions, churn, and sales.
Say you want to tie CX to churn through your mobile app. No problem!
Look at your post-survey 90-day churn metrics and see at what scores you begin to lose customers rapidly.
Compare that with your NPS. Let’s say your NPS shows you can tolerate some Passives and maybe even some Detractors scoring you at a 5 or 6. Cool, you can let those ride a bit if you’re resource light.
Detractors scoring you at a 0 or 4, however, could be at serious risk of leaving if they don’t receive the support they need to succeed. Put your resources there ASAP!
How else can you monitor the risk of churn? Well, if you’re a B2B business, you’re probably already looking at your Customer Health Score. Factor NPS and other CX metrics into your Customer Health Score and get even more insight with a system that takes into account behavioral metrics like the number of support tickets per user, usage of product features, and other engagement metrics.
Step 3: Act
You’ve listened, you’ve learned a lot, and now you’re ready to make an impact. But here’s the thing: CX is built by and affected by more than just one team at a company. So there are two critical parts to the Act step.
Get CX data into everyone’s workflow
A customer-centric organization relies on everyone having access to VoC data, so no individual or team at your company should ever have to search for it. All functions can drive better customer experiences and benefit from having CX data and analytics at their fingertips.
Sales needs CX metrics at the account level in Salesforce to prepare for an upsell conversation.
Customer Success uses Gainsight or other platforms for regular communications with customers.
Customer Support is in Intercom or ZenDesk.
Product may want data in their analytics platform like Tableau.
Analysts will want to pull CX data into their relational database.
By connecting your CX program to the applications and software used by other teams, you can destroy silos and create powerful interactions that delight your customers. Look for CX platforms with native integrations and open APIs to make these connections seamless.
Optimize your product with CX
It’s all good and well to gather and distribute essential data and insights, but a CX program’s real power comes from making your product and services better.
Use your CX data to rank and address the things that matter most to your customers and thus to your business’ success. We recommend creating a dual-axis plan of attack to prioritize what you optimize.
Look at the number of impacted customers and their average score for each issue.
Combine that number with a qualitative measure of the engineering and operational effort required to address the issue.
Close the loop at scale
Once you’ve taken actions to improve CX, don’t forget to communicate back to your customers who gave you the feedback to make those changes. Let them know you appreciate their input and that it made an impact.
You now have hundreds and thousands of customers giving your feedback, and you won’t have enough resources to call each one personally. Thus you’ll need a hybrid model to close the customer feedback loop.
High touch. A customer success agent or account manager can reach out to their customers when they respond, even if just to say “Thanks!” This connection lets customers know you’re listening and appreciate their feedback. For a B2B business, this is the way to go if you have the resources.
Medium touch.Segment the list by survey scores. Sync with a platform like Intercom to trigger automated messages or schedule a weekly email campaign to each group.
Thank Promoters and possibly offer them an incentive to be brand advocates, perhaps by sharing their positive feedback on social media.
Route Detractors to Customer Success or Customer Support. That team can devote time to understanding why the customer’s not happy — especially those who didn’t leave feedback — and make the CX and relationship better.
Automate a reply to Passives who didn’t leave feedback, spurring a “What would make you LOVE us?” conversation.
Low touch. Respond with information-sharing and transparency, such as a blog post or newsletter at the end of the month, summarizing the feedback you’ve received and stating your plans to address issues customers have raised.
A growing company needs to grow its CX program. By expanding your view to the full customer journey, expanding the feedback you’re requesting, and then using more advanced tools to pull insights from the feedback, you’ll be ready to optimize the customer experience you provide and enjoy the success it brings.
Text analytics, also called text mining, has countless applications. Businesses are taking advantage of text analytics to update their service offerings, improve compliance, get ahead of PR disasters, and more.
Here are 5 examples of the industries taking advantage of text analytics in 2021.
1. Hospitality
Hotels live and die by their reviews. Reviews are not only crucial to whether someone books a stay, but they also give valuable insight into what a business is doing well – or not. And while the hospitality industry has been decimated over the COVID-19 pandemic, the quickening vaccine deployment holds great promise for 2021 and beyond for the industry. Hotels use text analytics to get a deep understanding of where they excel and where they can improve, as well as what others are doing. Say some reviews mention poor wi-fi. A hotel can analyze these reviews deeper to nail down whether the wi-fi problem is a hotel-wide approach or just in some rooms. Once they’ve figured it out, they can make the fix, thank the reviewer for their feedback, and be on their way to improved reviews in the future.
2. Financial Services
The financial services sector is hugely complex. There’s an enormous amount of interaction, documentation, risk analysis, and compliance involved. Financial services firms are using text analytics to analyze customer feedback, evaluate customer interactions, assess claims, and to identify compliance risks. Take compliance. Staff can use an NLP-based text analytics solution to quickly and easily search internal legal documents for phrases relating to finance or fraud. This can save an enormous amount of time compared with doing so manually.
3. Medical Affairs and Pharma
Medical affairs specialists help move pharmaceutical products from R&D to commercialization. This involves an encyclopedic knowledge of drug body and government regulations, as well as drug compendia. Medical affairs specialists are using text analytics to parse each of these and automatically report back on changes. The specialists can then course correct depending on what these changes mean for the drug they’re developing. Using text analytics rather than human effort reduces the time spent on tracking these changes, and is more accurate and far-reaching as well. Download AI for Medical Affairs Whitepaper
4. PR and Advertising
Text analytics is brilliant at sentiment analysis – something that PR is all about monitoring. Text analytics can run in real-time to track the sentiment in mentions about a particular company, alerting them to potential brand reputation emergencies. In advertising, text analytics can help monitor the reach of a campaign and how it’s being received. For example, a leading provider of Media Monitoring and Social Influencing used Lexalytics’, an InMoment company, API to create custom dashboards to analyze its customers’ media relations programs in terms of sentiment, engagement, perception, and performance.
5. Retail
In retail, the customer is always right. E-eCommerce retailers in particular need to make sure that the customer experience is as positive as possible, and with the boon in online buying during the pandemic, this is more important than ever. A poor experience means a customer is unlikely to return – even more so than in physical stores that people frequent due to their proximity. Many e-tailers are turning to text analytics to curate, collate and analyze feedback that helps identify points of friction when using an ecommerce website or dealing with customer support.
Would you like to know how text analytics can help your business or industry? Get in touch
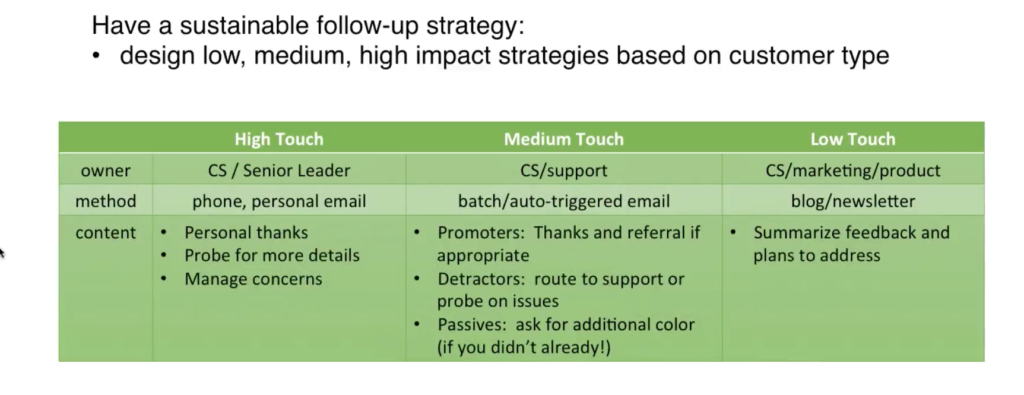
A good customer experience improvement program depends on two-way conversations between companies and their customers. It has been reported that nearly half (43%) of customers don’t bother complaining because they don’t believe companies care. Get ahead of that stat by demonstrating your company not only wants the feedback, you act on it. The three-tiered approach to customer follow-up (high touch, medium touch, and low touch) allows every company to effectively respond to customers, even if they can’t commit a lot of resources.
Treat customer feedback like a gift. It’s not enough to just gather Net Promoter Scores (NPS), you need to follow up with responders to let them know that 1) you appreciate their effort, and 2) their feedback has impact. Even if you can’t deliver everything customers ask for, they will remember that they were heard and appreciated. Closing the feedback loop will help you retain customers, increase response rates, and hopefully create loyal brand advocates.
Ready to respond? Good! Consider your resources and choose from three levels of engagement:
High Touch. This more resource-intensive approach has proven very effective for B2B companies. Every time a customer gives feedback, a Customer Success Manager or Account Manager contacts them. Don’t worry, it doesn’t have to be an in-depth correspondence. Sometimes a simple “thank you” is all that’s needed. Other times, you can dig deeper into their response (and deeper into the relationship) in order to make the feedback even more actionable.
Medium Touch. We get it — not every business has the headcount to personally respond to every piece of feedback they receive. Automating the feedback loop is a time and resource saver. Segment your customer responses by the rating each customer gives and you can still have a personalized impact where it counts most. Your follow up plan could look something like this:
Promoter. Send a “thank you” and possibly offer an incentive for the customer to share your product.
Detractor. Route the response to Customer Success or Customer Support to uncover why that responder isn’t happy, especially if they didn’t leave further feedback explaining their rating.
Passive. Deliver a message to passive raters who didn’t leave feedback, engaging them in a “What would make you LOVE us?” conversation.
Low Touch. If you have too many users to provide individual responses, or you don’t have contact information, you can still close the loop! Develop blanket communications that offer transparency and information sharing:
A monthly blog post or newsletter. Summarize the feedback you’ve received, and detail the actions you’ll be taking in response to issues customers have raised.
Product updates or release notes. CX champions in product or UX can use these to communicate “We heard you! Today we <fixed X or launched Z>.”
All three levels of engagement deliver impact, so choose the one that best fits your needs. InMoment customer Albacross chose a medium touch model, which resulted in 2X the NPS scores and a 2X ratings increase on Capterra.
By closing the loop with customers, you show them that you’re not only listening to their feedback, you consider it so important that you’re using it to make their experiences better. This simple step can turn ambivalent customers into vocal fans.
As we begin this new year, we want to share some great news.
Today we’re excited to announce that Wootric is joining InMoment, a market leader in customer and employee experience. InMoment serves many of the largest, most sophisticated global organizations from Starbucks to Ford to VMWare.
This next step in our evolution means great things for our customers and other businesses seeking a modern approach to CX improvement.
We will continue to deliver the world-class product experience you expect from us. In addition, our pace of innovation and our ability to support our customers around the globe will accelerate as we leverage the considerable resources and expertise of InMoment.
Our customers will also be able to tap into InMoment’s expertise and enterprise solutions as their CX needs evolve beyond our turnkey approach.
Seven years ago, we founded Wootric with a mission to empower customer-centricity in every organization through modern, always-on CX improvement. We launched with a high-response in-app microsurvey and quickly disrupted a dated approach to gathering and responding to Net Promoter Score feedback.
Guided by input from our customers, we invested in omni-channel feedback collection, AI-driven customer journey analytics, and native integrations with the modern tech stack — all the while staying true to the flexible, lightweight, user-centric approach to CX improvement that businesses expect from Wootric.
Wootric now delivers the fastest ROI in the Experience Management category on G2. Over 1200 businesses worldwide, including DocuSign, Zoom, and Comcast, use Wootric software to improve customer lifetime value with insights and action from voice of the customer data.
We thank our customers, partners, investors, advisors, and above all members of our exceptional team for their support, and for choosing to be on the CX journey with us.
Together, with InMoment, we will make 2021 an amazing year for customer experience!
With gratitude,
Deepa Subramanian, CEO & Jessica Pfeifer, Chief Customer Officer
The founders would also like to extend a special thank you to Steve Gurney at Viant Group for representing Wootric through this process.
Customer comments are the lifeblood of any CX program, giving you the “why” behind customers’ NPS, CES, and CSAT scores. But until recently, it’s been nearly impossible to make sense of feedback from hundreds of customers at a time. Using artificial intelligence (AI) to automate text analysis gives you the consistent and fast insights you need, at scale.
That said, automated text analysis isn’t just about technology. Humans need to put in the time upfront to teach the machine, by providing an accurately tagged set of feedback for AI to work from. The quality of that training data sets up the quality of your text analytics results, or as the old saying goes “garbage in, garbage out”.
Let’s look at what you need to be successful with automated text analytics. We’ll dig into the basics of text analytics, the inconsistencies of manual tagging, and how to create good training data and models.
A quick primer on AI training sets
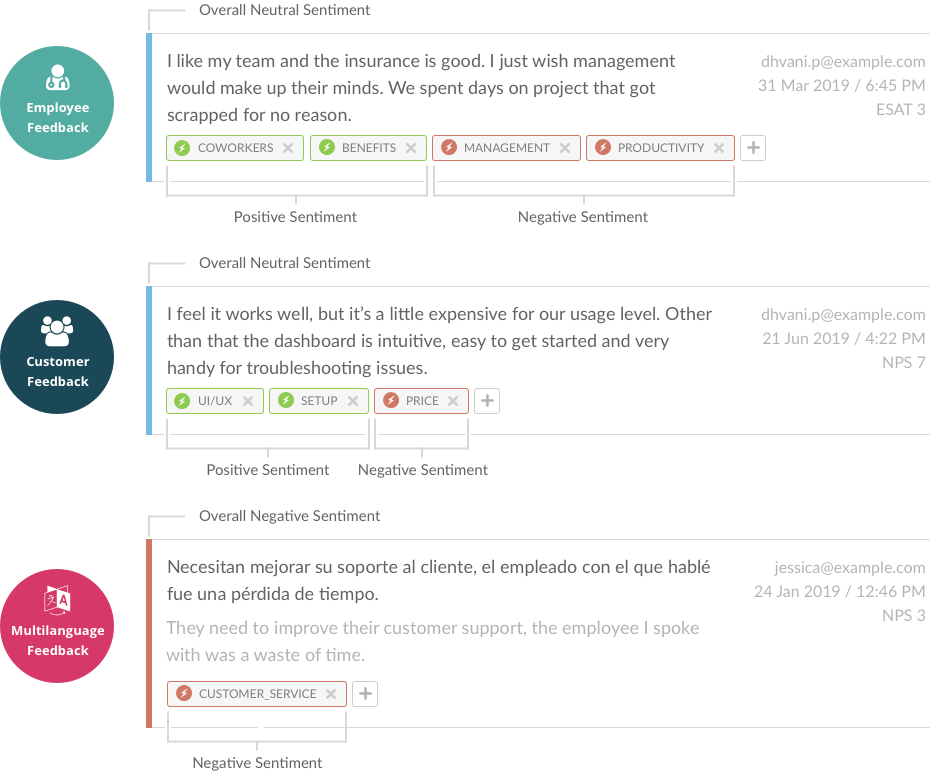
Analyzing customer feedback from unstructured text can be complex. In one sentence a customer may talk about a variety of topics, offering negative, neutral, or positive feedback (sentiment) about each of them. It’s the job of machine learning to recognize what the customer is talking about and identify how they are feeling about those topics. With text analytics, it only takes an instant to:
Tag comments / categorize themes
Assign sentiment to each of the tags and the comment overall
Aggregate results to find insights
Text analyzed for sentiment and themes
Again, machine learning is only as good and accurate as the data set you (the humans) provide to train the algorithm. So you need to do it right.
At Wootric, we have a lot of experience helping teams create training datasets. While we have sets of tags that are specific to various industry verticals, we also build custom machine learning models for many customers. Custom models are helpful for companies that are in a new vertical or a unique business.
Training model process
For the most part, companies have a good feel for what their users/customers are talking about and the topic tags they need. If they’re not sure, we can analyze their data and work with them to help them think through a set of tags to get them started. Once they have a set of agreed tags, they start creating the training data.
The process for creating this training dataset goes something like this.
Decide what tags are important to your business
Create definitions for those tags so everyone knows exactly what the tags mean
Pull 100-200 customer comments
Our customer assembles a team of at least 3-5 people who independently review each comment and determine:
If the comment sentiment is overall positive, neutral, or negative
Which tags apply to that comment
That last point is where things get interesting for a data analyst like me.
Manual tagging: an inconsistent truth
Many companies still believe having human tagging and analysis is superior to AI. We’ve seen one employee hired full-time to pour over spreadsheets, organizing data and pulling insights, which takes A LOT of time. Other companies bring in a team of people (the interns!), which introduces inconsistencies. Not only is it expensive and time-intensive, manual tagging isn’t necessarily accurate.
These same inconsistencies appear when creating training datasets because the process starts with manual tagging. Customer teams creating training data are always surprised by the level of disagreements on “defined” tags. It can take a few rounds of work to iron these out.
Tag definitions vary
Not all tags carry the same level of complexity. Some tags make it easy for people to agree upon a definition, while others may be more ill-defined. Vague tags tend to invite more disagreement between human labelers who label the same dataset independently.
Let’s look at a couple of examples from the software industry:
“MOBILE” — applied to any feedback containing references to a mobile app or website functionality. This should be straightforward for a group of human labelers to apply similarly, and would most likely only result in a few disagreements between them.
“USER EXPERIENCE” — a more complex phrase with many different definitions of what could be included in a user’s experience. When a comment mentions search functionality, is that UX? How about when they say something like “While using the search bar, I found information on…“? Or even “Great product”? Because there is so little clarity on what fits in this category, the training team will surely disagree, leading to more rounds of tagging and defining.
The good news is that at the end of the process, after a few rounds of defining the tags and applying them, the team REALLY knows what is meant by a given tag. The definition is sharper and less open to interpretation. This makes the machine learning categorization more meaningful, and more actionable for your company, which leads to an improved customer experience.
Getting to a good training model
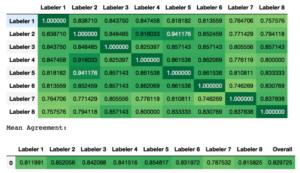
Let’s look at a real-world example of creating a training set, and the level of label agreement between the people creating those labels.
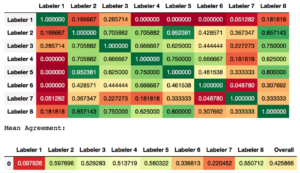
A recent enterprise customer used 8 human labelers on the same initial set of 100 comments, and we then evaluated the labeler-agreement of each tag. During this exercise, each labeler worked independently , and we charted the agreement scores.
In the following two charts, the number in each cell represents the strength of the agreement from 0 – 1 between two labelers (F1-Score calculated from Precision and Recall values).
1.0 would be the ideal labeler agreement value.
0 means no agreement.
The lower row of the chart contains the average agreement across all cells for that labeler.
In Figure 1, it’s clear that the tag is fairly well-defined, which results in an overall average labeler agreement of ~0.83. This is on the higher end of what we typically see.
Figure 1 – agreement on a well-defined tag
In other words, even a well-defined tag doesn’t garner complete agreement between labelers. Labeler 5, our most effective labeler, only scored a 0.85 average. Labeler 1 and 8, with an F-1 score of .75, didn’t apply the tag, in the same way, a significant portion of the time. But it’s still considered successful.
Now, look at Figure 2, which shows the first-round results of the team’s effort to consistently apply a more complex tag. It resulted in an overall average labeler agreement of only ~0.43.
Figure 2 – disagreement on a vague tag
For the same group of labelers tagging at the same time, two different tags demonstrate nearly 2x difference in overall agreement — showing again that even we humans aren’t as good at manually categorizing comments as we would like to think.
Even when teams agree on 1) what tags to use and 2) the definition of each tag, they don’t necessarily wind up applying tags in the same way. It takes a few rounds for teams to come close enough to consensus to be useful for machine learning.
Ready for autocategorization
Text analytics is not a perfect science. When are the label agreement results ready for prime time? Typically, we consider a model good enough to deploy once the F-1 score is around 0.6 (give or take a bit based on other factors). Like most things in life, when you invest more time upfront — in this case boosting F-1s with additional rounds of tagging/defining — you typically end up with better results.
Even if it’s just a quick trip to the grocery store, customers seek something more profound from brands than a mere product: meaningful customer experiences.
Conventional wisdom holds that customers shop the brands whose products and services best match their needs. But there’s more to the story than that. Even if it’s just a quick trip to the grocery store, customers seek something more profound from brands than a mere product: meaningful customer experiences.
There’s a lot for organizations to gain by orienting themselves around customers’ search for meaning. Experience programs can help them get there.
We’re going to go over exactly how companies can achieve that reorientation, create meaningful experiences for customers, and, ultimately, ride that heightened connectivity to the top of their respective verticals.
Right Audience, Right Problem
We touched on this in our last conversation about the importance of carefully designing your program before deploying it, but it’s worth saying again:
Some audiences are more worth brands’ time than others.
Sounds harsh, but let me explain. Some audiences offer context and solutions to problems that other groups may not even be aware of. Therefore, one of the first things brands should do to create meaning for their customers is consider the problems that can be solved by focusing on specific audiences.
This approach is vital is because it allows brands to hone in on customers’ “moment of truth.” This is the moment in which a customer finds significance in their interaction with a brand, not just a product or service.
What is preventing customers from finding their moment of truth? The answer to this question will dictate what you should design your listening program around.
Furthermore, that search will allow your company to create fundamental human relationships with customers. And those relationships will create positive buzz, build lifetime loyalty, and result in a much stronger bottom line.
Sharing the Love
Thinking how certain audiences can help solve business challenges is important, but it’s not the only step brands must take. Once a company’s experience team finds moments of truth, they absolutely must share the news across the organization! This sharing process is often called data democratization.
I really can’t say enough how important it is to share customers’ moments of truth. First, socializing that data across the organization gives every employee a glimpse of how their role affects the customer.
Second, sharing this intel makes it easier for brands to identify moments that matter out of mountains of experience program data. Ultimately, brands that intentionally democratize data from the beginning get so much more from their listening than companies who fail to design their strategy.
Listening Empathetically
The final key to creating meaningful customer experiences is on that is often overlooked: empathy. Empathy is the key to understanding moments of truth and, ultimately, business success.
Catering to customers’ search for meaning is neither a program luxury nor a saying you put on a wall sign. It’s a strategy that builds transformational brand success and the meaningful, emotional relationships that can sustain it indefinitely.
I go into greater depth about the importance of designing your experience program before listening in my article on the subject, which you can read here. Thank you!
Healthcare databases are growing exponentially. Today, healthcare providers, drug makers and others are turning this data into value by using text analytics and natural language processing to mine unstructured healthcare data and then doing something with the results. Here are some examples.
This article explores some new and emerging applications of text analytics and natural language processing (NLP) in healthcare. Each application demonstrates how HCPs and others use natural language processing to mine unstructured text-based healthcare data and then do something with the results.
Healthcare databases are growing exponentially, and text analytics and natural language processing (NLP) systems turn this data into value. Healthcare providers, pharmaceutical companies and biotechnology firms all use text analytics and NLP to improve patient outcomes, streamline operations and manage regulatory compliance.
In order, we’ll talk about:
Sources of healthcare data and how much is out there
Improving customer care while reducing Medical Information Department costs
Hearing how people really talk about and experience ADHD
Facilitating value-based care models by demonstrating real-world outcomes
Guiding communications between pharmaceutical companies and patients
Even more applications of text analytics and natural language processing in healthcare
Some more things to think about, including major ethical concerns
NLP in the Healthcare Industry: Sources of Data for Text Mining
Patient health records, order entries, and physician notes aren’t the only sources of data in healthcare. In fact, 26 million people have already added their genetic information to commercial databases through take-home kits. And wearable devices have opened new floodgates of consumer health data. All told, Emerj lists 7 healthcare data sources that, especially when taken together, form a veritable goldmine of healthcare data:
1. The Internet of Things (IoT) think FitBit data)
2. Electronic Medical Records (EMR)/Electronic Health Records (EHR) (classic)
3. Insurance Providers (claims from private and government payers)
4. Other Clinical Data (including computerized physician order entries, physician notes, medical imaging records, and more)
5. Opt-In Genome and Research Registries
6. Social Media (tweets, Facebook comments, message boards, etc.)
7. Web Knowledge (emergency care data, news feeds, and medical journals)
Just how much health data is there from these sources? More than 2,314 exabytes by 2020, says BIS Research. For reference, just 1 exabyte is 10^9 gigabytes. Or, written out, 1EB=1,000,000,000GB. That’s a lot of GB.
But adding to the ocean of healthcare data doesn’t do much if you’re not actually using it. And many experts agree that utilization of this data is… underwhelming. So let’s talk about text analytics and NLP in the health industry, particularly focusing on new and emerging applications of the technology.
Improving Customer Care While Reducing Medical Information Department Costs
Every physician knows how annoying it can be to get a drug-maker to give them a straight, clear answer. Many patients know it, too. For the rest of us, here’s how it works:
You (a physician, patient or media person) call into a biotechnology or pharmaceutical company’s Medical Information Department (MID)
Your call is routed to the MID contact center
MID operators reference all available documentation to provide an answer, or punt your question to a full clinician
Simple in theory, sure. Unfortunately, the pharma/biotech business is complicated. Biogen, for example, develops therapies for people living with serious neurological and neurodegenerative diseases. When you call into their MID to ask a question, Biogen’s operators are there to answer your inquiry. Naturally, you expect a quick, clear answer. At Biogen Japan, any call that lasts more than 1 minute is automatically escalated to an expensive second-line medical directors. Before, Biogen struggled with a high number of calls being escalated because their MID agents spent too long parsing through FAQs, product information brochures, and other resources.
Today, Biogen uses text analytics (and some other technologies) to answer these questions more quickly, thereby improving customer care while reducing their MID operating costs. When you call into their MID, operators use a Lexalytics-built search application that combines natural language processing and machine learning to immediately suggest best-fit answers and related resources to people’s inquiries. MID operators can type in keywords or exact questions and get what they need in seconds. (The system looks like this illustration.) Early testing already shows faster answers and fewer calls sent to medical directors, and the application also helps new hires work at the level of experienced operators, further reducing costs.
Hearing How People Really Talk About and Experience ADHD
The human brain is terribly complicated, and two people may experience the same condition in vastly different ways. This is especially true of conditions like Attention Deficit Hyperactivity Disorder (ADHD). In order to optimize treatment, physicians need to understand exactly how their individual patients experience it. But people often tell their doctor one thing, and then turn around and tell their friends and family something else entirely.
A Lexalytics (an InMoment company) data scientist used our text analytics and natural language processing to analyze data from Reddit, multiple ADHD blogs, news websites, and scientific papers sourced from the PubMed and HubMed databases. Based on the output, they modeled the conversations to show how people talk about ADHD in their own words.
The results showed stark differences in how people talk about ADHD in research papers, on the news, in Reddit comments and on ADHD blogs. Although our analysis was fairly basic, our methods show how using text analytics in this way can help healthcare organizations connect with their patients and develop personalized treatment plans.
Facilitating Value-Based Care Models by Demonstrating Real-World Outcomes
Our analysis of conversations surrounding ADHD is just one example in the large field of text analytics in healthcare. Everyone involved in the healthcare value chain, including HCPs, drug manufacturers, and insurance companies are using text analytics as part of the drive towards value-based care models.
Within the value-based care model, and outcome-based care in general, providers and payers all want to demonstrate that their patients are experiencing positive outcomes after they leave the clinical setting. To do this, more and more stakeholders are using text analytics systems to analyze social media posts, patient comments, and other sources of unstructured patient feedback. These insights help HCPs and others identify positive outcomes to highlight and negative outcomes to follow-up with.
Some HCPs even use text analytics to compare what patients say to their doctors, versus what they say to their friends, to identify how they can improve patient-clinician communication. In fact, the larger trend here almost exactly follows the push in more retail-focused industries towards data-driven Voice of Customer: using technology to understand how people talk about and experience products and services, in their own words.
Guiding Communications Between Pharmaceutical Companies and Patients
Pharmaceutical marketing teams face countless challenges. These include growing market share, demonstrating product value, increasing patient adherence and improving buy-in from healthcare professionals. Lexalytics customer AlternativesPharma helped those professionals by providing useful market insights and effective recommendations.
Before, companies like AlternativesPharma relied on basic customer surveys and some other quantitative data sources to create their recommendations. Using our text analytics and natural language processing, however, AlternativesPharma was able to categorize large quantities of qualitative, unstructured patient comments into “thematic maps.” The output of their analyses led to research publications at the 2015 Nephrology Professional Congress and in the Journal Néphrologie et Thérapeutiques.
Further, AlternativesPharma helped customers verify assumptions made by Key Opinion Leaders (KOLs) regarding the psychology of patients with schizophrenia. This theory was then documented in collateral and widely communicated to physicians. (Full case study)
More Applications of Text Analytics and Natural Language Processing in Healthcare
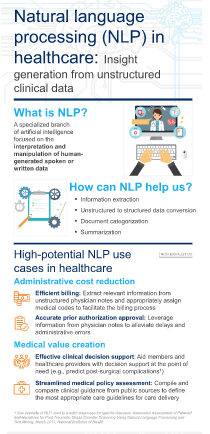
The above applications of text analytics in healthcare are just the tip of the iceberg. McKinsey has identified several more applications of NLP in healthcare, under the umbrellas of “Administrative cost reduction” and “Medical value creation”. Their detailed infographic is a good explainer. Click the image (or this link) to read the full infographic on McKinsey’s website.
Meanwhile, this 2018 paper in The University of Western Ontario Medical Journal titled “The promise of natural language processing in healthcare” dives into how and where NLP is improving healthcare. The authors, Rohin Attrey and Alexander Levitt, divide healthcare NLP applications into four categories. These cover NLP for:
Patients – including teletriage services, where NLP-powered chatbots could free up nurses and physicians
Physicians – where a computerized clinical decision support system using NLP has already demonstrated value in alerting clinicians to consider Kawasaki disease in emergency presentations
Researchers – where NLP helps enable, empower and accelerate qualitative studies across a number of vectors
Healthcare Management – where patient experience management is brought into the 21st-century by NLP used on qualitative data sources
Next, researchers from Sant Baba Bhag Singh University (former link) explored how healthcare groups can use sentiment analysis. The authors concluded that using sentiment analysis to examine social media data is an effective way for HCPs to improve treatments and patient services by understanding how patients talk about their Type-1 and Type-2 Diabetes treatments, drugs, and diet practices.
Finally, market research firm Emerj has written up a number of NLP applications for hospitals and other HCPs, including systems from IQVIA, 3M, Amazon and Nuance Communications. These applications include improving compliance with industry standards and regulations; accelerating and improving medical coding processes; building clinical study cohorts; and speech recognition and speech-to-text for doctors and healthcare providers.
Some More Things to Consider: Data Ethics, AI Fails, and Algorithmic Bias
If you’re thinking about building or buying any data analytics system for use in a healthcare or biopharma environment, here are some more things you should be aware of and take into account. All of these are especially relevant for text analytics in healthcare.
First: According to a study from the University of California Berkeley, advances in artificial intelligence (AI) have rendered the privacy standards set by the Health Insurance Portability and Accountability Act of 1996 (HIPAA) obsolete. We investigated and found some alarming data privacy and ethics concerns surrounding AI in healthcare.
Second: Companies with regulatory compliance burdens are flocking to AI for time savings and cost reductions. But costly failures of large-scale AI systems are also making companies more wary of investing millions into big projects with vague promises of future returns. How can AI deliver real value in the regulatory compliance space? We wrote a white paper on this very subject.
Third: The “moonshot” attitude of big tech companies comes with huge risk for the customer. And no AI project tells the story of large-scale AI failure quite like Watson for Oncology. In 2013, IBM partnered with The University of Texas MD Anderson Cancer Center to develop a new “Oncology Expert Advisor” system. The goal? Nothing less than to cure cancer. The result? “This product is a piece of sh–.”
Fourth: “Bias in AI” refers to situations where machine learning-based data analytics systems discriminate against particular groups of people. Algorithmic bias in healthcare AI systems manifests when data scientists building machine learning models for healthcare-related use cases train their algorithms on biased data from the start. Societal biases manifest when the output or usage of an AI-based healthcare system reinforces societal biases and discriminatory practices.
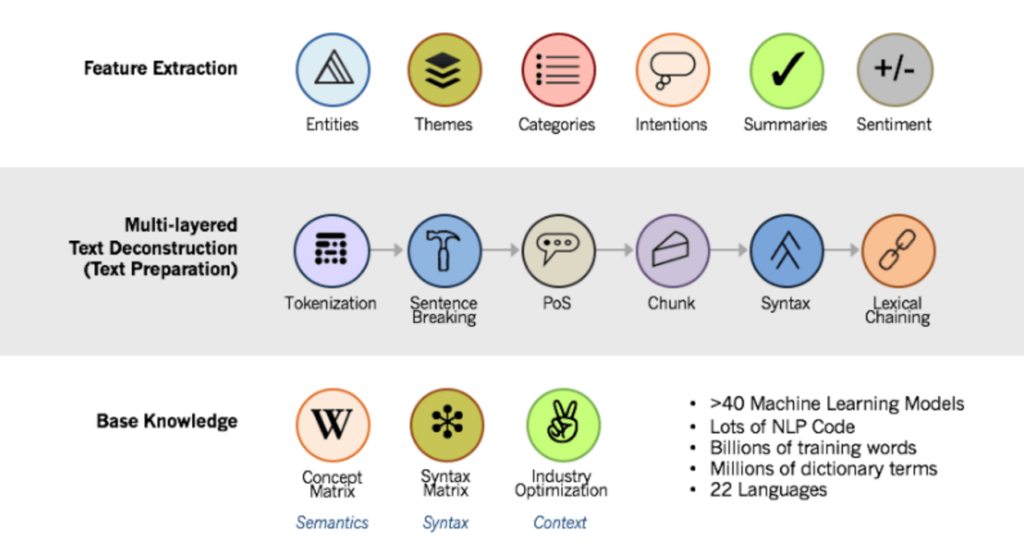
Improve Your Understanding: What Are Text Analytics and Natural Language Processing?
In order to put any tool to good use, you need to have some basic understanding of what it is and how it works. This is equally true of text analytics and natural language processing. So, what are they?
Text analytics and natural language processing are technologies for transforming unstructured data (i.e. free text) into structured data and insights (i.e. dashboards, spreadsheets and databases). Text analytics refers to breaking apart text documents into their component parts. Natural language processing then analyzes those parts to understand the entities, topics, opinions, and intentions within.
Lexalytics’ text analytics and NLP technology stack, showing the layers of processing each text document goes through to be transformed into structured data.
Experience programs can revolve around so much more than scoreboard-watching and reacting to challenges only as they arise—we’re going to go over how much more these programs can be and why brands should adjust their ambitions accordingly.
For a lot of companies, the phrase “experience programs” brings careful management and lots of metrics to mind. Both of those things are important components of any experience effort, but they can’t bring about meaningful change and improvement. Experience programs can revolve around so much more than scoreboard-watching and reacting to challenges only as they arise—we’re going to go over how much more these programs can be and why brands should adjust their ambitions accordingly.
Movement Over Metrics
Conventional wisdom holds that if an experience program is returning great measurements, that must mean it’s really working for a brand. However, this isn’t necessarily true. Metrics are effective for highlighting a brand’s high points and weak spots, but that’s about it. A true experience program’s job doesn’t end with better metrics—that’s actually where the work begins.
Companies can create a fundamentally better experience for their customers (and thus a stronger bottom line for themselves) by taking action on their program’s findings. This means sharing intelligence throughout an organization rather than leaving it siloed, as well as encouraging all stakeholders to own their part of the process. In short, taking action is what makes the difference between being really good at watching scores roll in and actually fixing problems that might be muddying up the customer journey.
Narratives Over Numbers
The phrase “program findings” from the preceding paragraph can also mean more than just numbers. It can also denote customer stories, employee reports, and other, more abstract forms of feedback. Many experience programs pick this information up as a matter of course, but it can be difficult to take action on that intel without a concrete action plan.
One reason why many companies encounter this difficulty is because their programs don’t acknowledge a simple truth: some customer segments are worth more to listen to than others. It doesn’t make much sense to try to listen to every segment for feedback on a loyalty program that only long-term customers use or know about. This is why it’s important for brands to consider which audiences they want to gather feedback from before even turning any listening posts on.
Once brands have matched the audiences they want to listen to to the goals they want to achieve, that’s when they can turn their ears on and start gathering that feedback. Companies that take this approach will find feedback significantly more relevant (and helpful) than intelligence gathered through a more catchall approach. They can then perform a key driver analysis on those customers and put their feedback against a backdrop of operational and financial data for further context, which goes a long way toward the goal of all of this: meaningful improvement.
Experience Improvement Over Experience Management
Experience improvement is not a goal that can be reached just by reading metrics. It demands more than turning listening posts on and hoping that a good piece of customer intel comes down the wire. Rather, experience improvement demands action. Much like water molecules, the forces that drive customer expectations, acquisition, churn, and other factors are in constant motion, and thus demand constant action to stay on top of it all.
Desiloing intelligence, motivating stakeholders, and expanding program awareness to customer stories instead of just higher scores and stats is what makes the difference between an industry-leading experience and everyone else’s. These actions create better experiences for customers, compel employees to become more invested in providing those experiences, and creates a marketplace-changing impact for the brand.
Click here to learn more about how to take your program from simple metric-watching to meaningful improvement for all.
While the impact of artificial intelligence (AI) is a bit of a mixed bag in a number of industries, we’re seeing some exciting traction in financial services. In this month’s article, I take a look at some specific examples of where machine learning and AI are helping financial services organizations improve their services, products, and processes.
AI Helps Financial Services Reduce Non-Disclosure Risk
Financial firms and banks are taking advantage of AI to ensure that their employees are meeting complex disclosure requirements.
Generally, financial advisors must make sure that their “client advice” documents include proper disclosures to demonstrate that they’re working in their client’s best interests. These disclosures may cover conflicts of interest, commission structure, cost of credit, own-product recommendations and more. For example, advisors must clearly disclose the fact that they’re encouraging a client to purchase a position in a company that the firm represents (a potential conflict of interest).
To ensure compliance, firm auditors randomly sample these documents and spot-check them by keyword or phrase searches. But this process is clunky and unreliable, and the cost of failure is high: Some estimates put the price of non-compliance as high as $39.22 million in lost revenue, business disruption, productivity loss and penalties.
To help financial services firms ensure disclosure compliance, companies like FINRA Technology, Quantiply and my company offer AI solutions that use semi-structured data parsing to analyze client advice documents and extract all of the component pieces of the document (including disclosures). Then, using natural language processing to understand the meaning of the underlying text, the AI structures this data into an easily-reviewable form (like an Excel document) where human auditors can quickly evaluate whether all necessary disclosures were made. Where before an auditor might spend hours to review 1% of their firm’s documents, AI solutions like this empower the same person to review more documents in less time.
AI Fights Elder Financial Exploitation
$1.7 billion. That’s the value of suspicious activities targeting the elderly, as reported by financial institutions in 2017 alone. In total, the United States Consumer Financial Protection Bureau (CFPB) says that older adults have lost $6 billion to exploitation since 2013. One-third of these people were aged 80 or older, some of whom lost more than $100,000.
Thankfully, tech companies and financial institutions are fighting back. The CFPB notes that “Regularly studying the trends, patterns and issues in EFE SARs [Elder Financial Exploitation Suspicious Activity Reports] can help stakeholders enhance protections through independent and collaborative work.” This is a great opportunity for machine learning and AI, which use reams of historical data to predict what is likely to happen next.
Wells Fargo, for example, uses machine learning and AI to identify suspicious transactions that merit further investigation. Ron Long, director of elder client initiatives for Wells Fargo Advisors, told American Banker earlier this year that their data scientists are constantly working to add new unstructured and structured data sources to improve their capabilities. “While a tool can’t replace human assessment,” he said, “machine-learning capabilities play an important part in our strategy to reduce the number of matters requiring a closer look so we can focus on actual cases of financial abuse.”
One example is EverSafe, an identity protection technology company founded in 2012, which draws on multiple data sources to train its AI. EverSafe places itself at the nexus of a user’s entire financial life, analyzing behavior across multiple accounts and financial advisors. This approach dramatically improves their AI’s ability to identify erratic activity or anomalous transactions. Eversafe’s founder, Howard Tischler, says he was inspired to create the company after his aging, legally blind mother was scammed multiple times, including by someone who sold her a deluxe auto club membership.
AI Adds A Crucial Competitive Edge In High-Frequency Trading
Back in the 1980s, Bloombergbuilt the first computer system for real-time financial trading. A decade later, computer-based high-frequency trading (HFT) had transformed professional investing. Some estimates put HFT at 1,000x faster than human-human trading. But since the 2010s, when trading speeds reached nanoseconds, industry leaders have been looking for a new competitive edge.
To keep up with (and ahead of) the competition, industry leaders are turning to algorithmic trading. The sheer volume of trading information available for machines to analyze makes artificial intelligence and machine learning formidable tools in financial marketplaces. Investment firms use AI to increase the predictive power of the neural networks that determine optimal portfolio allocation for different types of securities. In simpler terms: Data scientists use reams of historical prices to train computers to predict future price fluctuations.
AI has already proven its value in HFT. Renaissance Technologies, an early adopter of AI, boasted a return of 71.8% annually from 1994 to 2014 on its Medallion Fund (paywall). Domeyard, a hedge fund, uses machine learning to parse 300 million data points in the New York Stock Exchange, just in the opening hour. And PanAgora, a Boston-based quant fund, deployed a specialized NLP algorithm to quickly decipher the cyber-slang that Chinese investors use on social media to get around government censorship. These findings give PanAgora, a firm that operates at the speed of fiber optic cables, vital insights into investor sentiment fast enough to keep up with (and influence) its trading algorithms.
Wrapping Up: Tempering Expectations For AI In Financial Services
The value of AI in financial services is clear. But don’t get lost in the hype. For every useful AI system, you can find a dozen problematic algorithms and large-scale failures. To succeed, keep a realistic perspective of what AI can and can’t do to help.
The truth is that artificial intelligence is just a tool. Alone, AI doesn’t really “do” anything. What matters is how you combine AI with other technologies to solve a specific business problem.


 When you call into their MID, operators use a
  The human brain is terribly complicated, and two people may experience the same condition in vastly different ways. This is especially true of conditions like Attention Deficit Hyperactivity Disorder (ADHD). In order to optimize treatment, physicians need to understand exactly how their individual patients experience it. But people often tell their doctor one thing, and then turn around and tell their friends and family something else entirely.
 The above applications of text analytics in healthcare are just the tip of the iceberg.