You Ask, We Tell: How Do I Increase Survey Response Rates? Should I Shorten My Survey?

I’ve been looking back over my 20+ years of various research consulting roles and during that time, I’ve continuously fielded questions from clients and others within the industry. In this blog, I’m going to focus on one question that continues to come up in conversations with CX practitioners and data analysts and my answer may surprise you.
How Do I Increase Survey Response Rates? Should I Shorten My Survey?
My first instinct when asked this question is to ask, “are you really interested in only increasing your survey response rate, or are you interested in getting more responses?” Those are two different things. Survey response rates are the percentage of responses you receive from the survey invitations you send out. Responses are the absolute number of responses you receive, regardless of response rates. In many cases, you can actually increase the number of responses you receive while decreasing survey response rates by sending out more invitations.
In most cases survey response rates matter little in terms of your sample providing representation of a population. What’s most important is the absolute number of responses you have. For example, if I’m trying to represent the United States population of approximately 325 million people, I only need a little over 1000 respondents for a confidence level of +/- 3 percentage points. It doesn’t matter if those 1000 respondents are acquired from sending a survey invitation to 5000 people (20% response rate) or 100,000 people (1% response rate).
The only caveat here is that a lower survey response rate may be an indicator that some sort of response bias is occurring: certain types of people may be responding more in comparison to other types. If that’s the case, it doesn’t matter how many responses you have. Your sample will still not represent the population. If you fear response bias, you should do a response bias study, but that’s a topic for another blog post.
Usually, when I point out to clients that they should be more interested in increasing the absolute number of responses they receive rather than just increasing survey response rates, they agree.
Begin By Increasing the Number of Outgoing Survey Invitations
You should begin your efforts to increase responses by deciding if it makes sense to send out more survey invitations. Below, I’ve identified three specific things you can do:
- Consider Doing a Census: Some CX programs still engage in sampling instead of sending survey invitations to all eligible customers. If your program is sampling, consider doing a census. This will both increase the number of responses you receive and give you the opportunity to identify and rescue more at-risk customers.
- Scrutinize Your Contact Data: Are a significant portion of your records getting removed because contact information is either missing or wrong? If you obtain customer contact information from business units, such as stores, hotels, dealerships, etc., it’s important to look at sample quality at the unit level. It’s also helpful to examine the amount of sample records received from business units compared to their number of transactions. Units with low samples in proportion to their transactions probably need to focus on better ways to obtain customer contact information.
- Invite All Customer Segments: Are you missing some segments of your customer population? Not obtaining contact information for specific customer segments often has to do with information system issues. For instance, in the earlier days of automotive CX research most companies only surveyed warranty-service customers. They didn’t survey customers that went to a dealership and paid for the repair/service themselves (customer-pay events). The reason was simply a system issue. Companies didn’t receive those transaction records from their dealerships. Now, most automotive companies have remedied that issue and they survey both warranty and customer-pay service customers.
Next, Revise Your Survey Invitation
The next step is to look at your survey invitation process and the survey invitation itself. You should look for two general things. First, is there anything that might prohibit customers from receiving the invitation?
- Are You Triggering Spam Filters? Sending out too many invitations in too short a time frame can trigger spam filters. Sending out too many invitations with invalid email addresses can also trigger spam filters or even get your project’s IP address black-listed by internet service providers. Therefore, make sure to check to see if email addresses are correctly formatted. If you’re really worried about the quality of your contact information, there are services available to pre-identify valid email addresses.
- Are You Sending Survey Invitations to the Wrong Customers? Outdated databases can cause you to send surveys to people that are no longer customers. Obviously, these people probably won’t respond to your survey, thus reducing response rates.
- Are Your Customers Receiving the Invitations but Never Seeing Them: Most email domains use algorithms to sort emails into various folders such as Primary/Inbox, Promotions, and Spam. Keywords in your subject lines and invitation text can affect where your invitations go. Do some testing of your invitations to make sure they end up in the Primary/Inbox folder for the biggest email domains. Also, you need to repeat your tests periodically because sorting algorithms can change unexpectedly. An invitation that goes to the Primary/Inbox folder today will not necessarily go there next week or next year.
Second, is the invitation compelling enough that a customer or prospect will open it and take action?
- Is the Subject Line of the Email Engaging to the Customer? The subject line is the first thing the customer sees. If it’s not engaging, the customer won’t open the invitation email. It’s helpful to test various versions of the invitation with different subject lines to determine which yields the highest open rates.
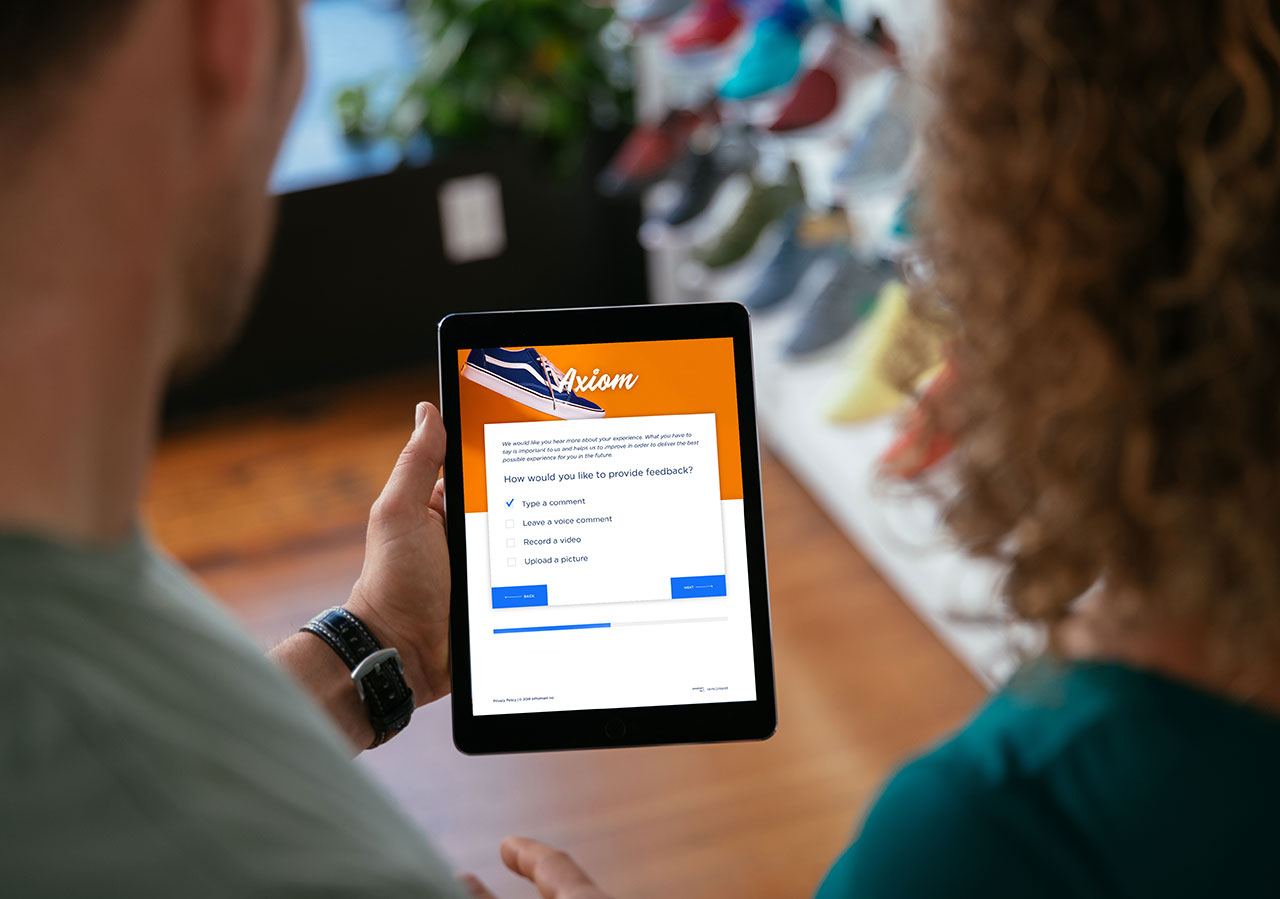
- Does the Invitation Display Well on a Smartphone? Over half of InMoment’s survey respondents are now completing their surveys on smartphones. Make sure your invitation (and the survey itself) displays well on smaller devices. You should also check to see how well your invitation and survey display in all major browsers.
- Do You Include a Realistic Time Estimate for How Long the Survey Will Take To Complete? This is especially important for shorter surveys, so that potential respondents know there will be only a small time commitment. It’s also a good idea for longer surveys because respondents will know what time commitment they’re getting into and they’ll be less likely to abandon the survey. If you are reluctant to tell the customer how long the survey will take to complete, your survey is probably too long.
- Is the Response Option Visible? When a customer opens the invitation, is the link or button to respond to the survey visible (front and center) without having to scroll down? Remember, this should be the case on a smartphone as well as on a tablet or computer.
- Is There a Call to Action? Your invitation should ask customers to respond and tell them why responding is important and what you’ll be doing with the information that will make their world and interaction with your product or service better.
- Are You Using Incentives to Increase Your Response Rate? Using incentives is complex and can be a bit tricky. But it’s always worth seeing if it is something that might work for you and your company. If you’re interested in testing it out, learn more about using incentives here.
Last but Not Least, Look at Revising the Survey Itself
Revising the survey itself may help increase responses. However, remember that revising the survey will only increase responses by reducing the number of people who abandon the survey after starting it. Typically, that number is quite small (about 5% for most CX surveys), so reducing abandonment probably won’t lead to a meaningful increase in the absolute number of responses. That being said, some of the things you should look for, in addition to the possibility that your survey is too long, are:
- Is Your Survey Simple and Easy to Use? You should keep your survey focused on the topic it is intended to measure and avoid “nice to know questions.” In addition, avoid mixing response scales as much as possible, as this can lead to confusion for the respondent.
- Does Your Survey Look Engaging? Your CX survey represents your brand. It should have the same voice and look and feel you use throughout all customer touch points-physical location, mobile app, website etc.
- Is the Language in Your Survey Easy for Customers To Understand? Don’t use industry jargon. That turns off respondents and can lead to confusion. Be your brand, upfront with your requests, and transparent.
- Does Your Survey Follow a Logical Flow to Walk the Customer Through the Experience Being Measured? This not only helps in reducing abandonment, but also helps customers recall the event accurately so they can give more thorough feedback.
When you want to increase the number of responses you receive, you should look beyond increasing your survey response rate and shortening your survey. There are much more effective ways to increase the number of responses that are often overlooked.
Remember that we’re here with the latest tips and tricks to help you figure out the best way to listen to your customers (via surveys or other feedback channels like social media, websites, apps, reviews etc.), understand customer behaviors and wants and needs, and act upon what customers are saying to create better experiences and ultimately drive business success.
Want to learn more about how you can boost your customer experience survey response rate? Check out these InMoment Assets to learn more:


