The Power of Brand Equity: Why It Matters for Your Business
Brand equity is the unique value people give to a business because they recognize and trust it. With positive brand equity, a company can charge higher prices since consumers perceive its products as of higher quality than those of its competitors. Thus, building brand equity is a crucial strategy for any company.
What is Brand Equity?
Brand equity is the measure of the perceived worth of a brand’s product, especially when compared to a generic equivalent product. Brand equity is a measurement of how much customers trust your brand’s product over another similar product, which can indicate how much more likely a customer is to pick your product over others.
For example, customers often turn to companies they trust when looking for a solution. Sometimes, they choose that company even if the product is slightly more expensive because they recognize and trust the name. For example, a customer looking for a quick OTC pain reliever may turn to Tylenol over a drugstore generic alternative because they know the brand and trust it. That is the essence of brand equity.
Why is Brand Equity Important?
Theoretically, the better your brand equity, the better your company will perform in sales and public perception compared to other brands. If your brand consistently impresses customers and reaches their expectations, you will develop more positive brand equity. If your brand fails to satisfy your customers because of negative experiences or perceptions, your brand will experience more negative brand equity.
Positive Brand Equity vs. Negative Brand Equity
When discussing brand equity, the terms positive and negative brand equity will arise. Understanding the difference between positive and negative brand equity is crucial for businesses aiming to build a strong, reputable brand.
Positive brand equity leads to high levels of customer loyalty and advocacy. Customers who perceive a brand positively are more likely to make repeat purchases and recommend the brand to others. This loyalty translates into stable revenue and organic growth through word-of-mouth marketing.
Conversely, negative brand equity results in customer distrust and attrition. Customers who have negative perceptions of a brand are likely to switch to competitors, leading to a decline in market share. Negative experiences, such as poor product quality or inadequate customer service, can severely damage a brand’s reputation. For example, scandals involving product safety can lead to widespread distrust and loss of customers.
Benefits of Brand Equity
Brand equity can have a meaningful impact on your company. While it’s obvious that brand equity improves public perception and recognition, there are several other benefits of nurturing brand equity that can help your company.
Increased Customer Loyalty
One of the primary benefits of strong brand equity is increased customer loyalty. Customers who trust and have positive associations with a brand are more likely to become repeat buyers. This loyalty not only ensures steady revenue but also reduces marketing costs, as retaining existing customers is often more cost-effective than acquiring new ones.
Enhanced Marketing Effectiveness
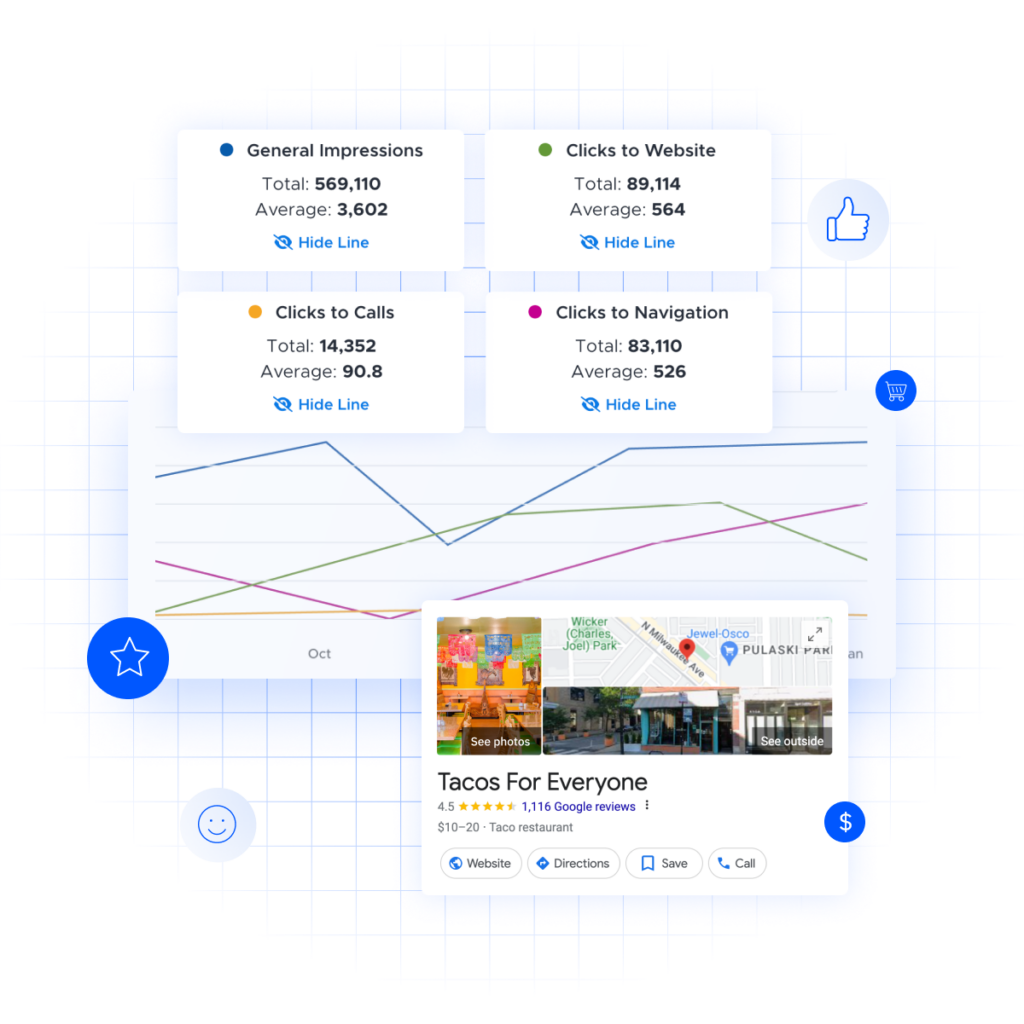
Marketing efforts are more effective when a brand has strong equity. Consumers are more receptive to marketing messages from brands they know and trust, leading to higher engagement and conversion rates. Additionally, positive customer feedback such as Google reviews from loyal customers can amplify marketing campaigns, extending their reach and impact without additional cost.
Competitive Advantage
Strong brand equity provides a significant competitive advantage. It differentiates a company’s products and services from those of competitors, making it harder for new entrants to capture market share. Established brands with strong equity enjoy top-of-mind awareness among consumers, making them the preferred choice in their respective categories. This competitive edge is crucial for long-term success and market leadership.

Increased ROI
When customers trust your brand, they are more likely to make future purchases from your company. If customers continue to purchase from your company, you are going to see a return on investment for what you put into improving your brand equity. Brand equity isn’t something that will leave your company without visible results. The ROI for your efforts can be seen in product lines. If you want to see how other efforts, such as a strong reputation management strategy, can provide you with ROI, check out our ROI calculator!
Overall, brand equity is an important measurement of the perceived worth of your company’s products and services over generic alternatives. Brand equity can be cultivated through many aspects of your business, including awareness and building relationships. When your company is nurturing brand equity, your brand can extend product lines and see ROI on investments made in brand equity.
What Makes Up Brand Equity?
Good brand equity comprises several elements. Nurturing each of these elements will help create full and balanced brand equity that can reach customers and improve public perception of your brand.
Brand Perception
Brand perception is how customers view and regard a product or service. This is separate from what a company is saying about its product. Essentially, brand perception is what a customer believes your product or service does—not what a marketing department publishes about the product. While it’s completely possible that brand perception of a product lines up with how a company discusses its product, it’s not a given.
There are two sub-stages of brand perception development: Brand recognition and brand awareness. Brand recognition is when products are identifiable as belonging to a particular brand. If a customer sees a product from your company, they would easily be able to identify that it belongs to your brand. Logos and jingles can all be a part of brand recognition. Brand recognition can help your brand become a household name and improve your brand equity.
Brand awareness is knowing what a brand stands for. While brand recognition means customers recognize your brand, brand awareness shows they understand your brand. Brand awareness is about knowledge, values, and beliefs. A way to think about brand awareness is to think about a customer choosing which brand of laptop to buy. If a customer has a lot of knowledge about how a company crafts their laptops, they have brand awareness for that company. That brand awareness may sway their choice of which laptop to buy, potentially over something like price. While one laptop may be cheaper, the customer may be more likely to buy the laptop they feel they understand better and can trust.
Customer Experience
Customers who have a positive experience with your company are more likely to trust your brand, which can increase your brand equity. Any time a customer comes into contact with your brand is an opportunity to improve their experience and ultimately their perception of your brand. That quality experience with your brand can create a positive impression of your company—and hopefully improve brand equity. The reverse can also be true. Bad experiences with a company can create a negative association with the brand. Doing what you can to improve your customer experience can go a long way with brand equity.
Quality
Your brand is associated with more than just a product or service. Brands are also associated with the supply chain, brand reputation, and trust. Quality across all of these parts of your brand can affect your brand equity. For example, a company that is effective at shipping quickly, restocking, and supplying vendors could increase the quality of its brand equity. In addition, a company with strong leadership, good financial performance, and excellent innovation will also have brand quality—ultimately creating more brand equity.
Customer Preference
Customers have preferences for brands they buy from, and that can come into play with your brand equity. For example, customers who grew up on a certain brand of cereal are more likely to choose that brand of cereal even as an adult. They simply have a preference for it—as well as more trust and experience with the brand. The same can be said for any brand in any industry. Working with customer preferences as part of your brand equity can help draw and keep customers in the long run.
How to Build Brand Equity
Actively investing in each component of brand equity can improve your brand equity. Refining customer experience, improving quality, and working with customer preferences can help build good brand equity. In addition, building brand awareness, emphasizing positive associations, and forming good relationships with customers are also important to building good brand equity.
1. Build Brand Awareness
It’s hard to have positive brand equity when potential customers aren’t sure what your brand is or what it stands for. When customers understand your brand and your products, they are more likely to consider buying them—even when there’s a price difference. You can build brand awareness with strong advertising and marketing, as well as make your brand’s values very clear and visible.
2. Emphasize Positive Associations
Making sure your brand is associated with positive things is an important part of improving your brand equity. To do this, ensure that your business is using responsible and ethical business practices. Those go a long way in giving your company a positive association with customers. In addition, emphasize any time your brand comes into contact with something positive or makes a positive connection or collaboration with an influential organization or person.
3. Form Good Relationships
In the end, good relationships with customers are what will truly strengthen your brand equity. Stay in touch with your customers on social media and through any other viable channels. In addition, provide them with excellent customer service through every step of the customer journey. Keep track of negative feedback and use it to smooth out problems in your customers’ experiences with your brand. Ultimately, be authentic with your customers and foster those relationships.
How to Measure Brand Equity
It can be difficult to definitively measure your brand equity, but there are a few ways to gain further insight into how your brand is doing. These are some of the quantitative methods that reflect your brand equity:
- Profit margins
- Price sensitivity
- Profitability
- Growth rate
- Market share percentage
- Purchasing frequency
Interviews, social media presence, and customer satisfaction surveys are another way to gauge how your brand equity is performing.
Brand equity can help increase your profit margins and how customers view your brand, so it’s an important aspect of your business to nurture.
You may also be able to measure your brand equity by tracking your business’ core customer experience metrics, as these indicators reflect how customers perceive and interact with your brand.

For example, an increase in customer satisfaction over a measured time may reflect that your efforts to improve product quality, customer service, or brand communication are resonating well with your audience, thereby enhancing your brand’s perceived value and trustworthiness.
Brand Equity Examples
Understanding brand equity can be significantly enhanced by looking at real-world examples of companies that have successfully built and leveraged their brand equity. These examples illustrate how strong brand equity can lead to customer loyalty, market dominance, and the ability to extend product lines.
Foot Locker
Foot Locker has built its brand equity on a foundation of trust within the athletic and sneaker communities. Known for its wide selection of athletic footwear and apparel, Foot Locker has leveraged endorsements from popular athletes and collaborations with top brands to strengthen its market position. By actively engaging with its target audience through social media, events, and sponsorships, Foot Locker has developed a loyal customer base that views the brand as an integral part of sports and street culture.
La-Z-Boy
La-Z-Boy has established strong brand equity through its reputation for comfort, quality, and durability in furniture. Known for its iconic recliners, La-Z-Boy has expanded its product line to include a variety of home furnishings. The brand’s commitment to providing high-quality, comfortable furniture has earned it a loyal customer base. La-Z-Boy’s emphasis on innovation in comfort technology and stylish design has further reinforced its brand equity, allowing it to maintain a premium positioning in the market.
Improve Your Brand Equity with InMoment
InMoment’s customer experience platform gives you the power to monitor feedback from every touchpoint, across every stage of the customer journey. Using the XI platform, your business will be able to track the progress of your business’ main metrics, which correlates to the growth of your brand equity. See what we can do for you by scheduling a demo today!