You Ask, We Tell: How Do I Increase Survey Response Rates? Should I Shorten My Survey?

I’ve been looking back over my 20+ years of various research consulting roles and during that time, I’ve continuously fielded questions from clients and others within the industry. In this blog, I’m going to focus on one question that continues to come up in conversations with CX practitioners and data analysts and my answer may surprise you.

How Do I Increase Survey Response Rates? Should I Shorten My Survey? 

My first instinct when asked this question is to ask, “are you really interested in only increasing your survey response rate, or are you interested in getting more responses?” Those are two different things. Survey response rates are the percentage of responses you receive from the survey invitations you send out. Responses are the absolute number of responses you receive, regardless of response rates. In many cases, you can actually increase the number of responses you receive while decreasing survey response rates by sending out more invitations.

In most cases survey response rates matter little in terms of your sample providing representation of a population. What’s most important is the absolute number of responses you have. For example, if I’m trying to represent the United States population of approximately 325 million people, I only need a little over 1000 respondents for a confidence level of +/- 3 percentage points. It doesn’t matter if those 1000 respondents are acquired from sending a survey invitation to 5000 people (20% response rate) or 100,000 people (1% response rate). 

The only caveat here is that a lower survey response rate may be an indicator that some sort of response bias is occurring: certain types of people may be responding more in comparison to other types. If that’s the case, it doesn’t matter how many responses you have. Your sample will still not represent the population. If you fear response bias, you should do a response bias study, but that’s a topic for another blog post.

Usually, when I point out to clients that they should be more interested in increasing the absolute number of responses they receive rather than just increasing survey response rates, they agree. 

Begin By Increasing the Number of Outgoing Survey Invitations 

You should begin your efforts to increase responses by deciding if it makes sense to send out more survey invitations. Below, I’ve identified three specific things you can do: 

  1. Consider Doing a Census: Some CX programs still engage in sampling instead of sending survey invitations to all eligible customers. If your program is sampling, consider doing a census. This will both increase the number of responses you receive and give you the opportunity to identify and rescue more at-risk customers.
  1. Scrutinize Your Contact Data: Are a significant portion of your records getting removed because contact information is either missing or wrong? If you obtain customer contact information from business units, such as stores, hotels, dealerships, etc., it’s important to look at sample quality at the unit level. It’s also helpful to examine the amount of sample records received from business units compared to their number of transactions. Units with low samples in proportion to their transactions probably need to focus on better ways to obtain customer contact information.
  1. Invite All Customer Segments: Are you missing some segments of your customer population? Not obtaining contact information for specific customer segments often has to do with information system issues. For instance, in the earlier days of automotive CX research most companies only surveyed warranty-service customers. They didn’t survey customers that went to a dealership and paid for the repair/service themselves (customer-pay events). The reason was simply a system issue. Companies didn’t receive those transaction records from their dealerships. Now, most automotive companies have remedied that issue and they survey both warranty and customer-pay service customers.

Next, Revise Your Survey Invitation

The next step is to look at your survey invitation process and the survey invitation itself. You should look for two general things. First, is there anything that might prohibit customers from receiving the invitation?

  • Are You Triggering Spam Filters? Sending out too many invitations in too short a time frame can trigger spam filters. Sending out too many invitations with invalid email addresses can also trigger spam filters or even get your project’s IP address black-listed by internet service providers. Therefore, make sure to check to see if email addresses are correctly formatted. If you’re really worried about the quality of your contact information, there are services available to pre-identify valid email addresses. 
  • Are You Sending Survey Invitations to the Wrong Customers? Outdated databases can cause you to send surveys to people that are no longer customers. Obviously, these people probably won’t respond to your survey, thus reducing response rates.
  • Are Your Customers Receiving the Invitations but Never Seeing Them: Most email domains use algorithms to sort emails into various folders such as Primary/Inbox, Promotions, and Spam. Keywords in your subject lines and invitation text can affect where your invitations go. Do some testing of your invitations to make sure they end up in the Primary/Inbox folder for the biggest email domains. Also, you need to repeat your tests periodically because sorting algorithms can change unexpectedly. An invitation that goes to the Primary/Inbox folder today will not necessarily go there next week or next year.

Second, is the invitation compelling enough that a customer or prospect will open it and take action?

  • Is the Subject Line of the Email Engaging to the Customer? The subject line is the first thing the customer sees. If it’s not engaging, the customer won’t open the invitation email. It’s helpful to test various versions of the invitation with different subject lines to determine which yields the highest open rates.
  • Does the Invitation Display Well on a Smartphone? Over half of InMoment’s survey respondents are now completing their surveys on smartphones. Make sure your invitation (and the survey itself) displays well on smaller devices. You should also check to see how well your invitation and survey display in all major browsers.
  • Do You Include a Realistic Time Estimate for How Long the Survey Will Take To Complete? This is especially important for shorter surveys, so that potential respondents know there will be only a small time commitment. It’s also a good idea for longer surveys because respondents will know what time commitment they’re getting into and they’ll be less likely to abandon the survey. If you are reluctant to tell the customer how long the survey will take to complete, your survey is probably too long.
  • Is the Response Option Visible? When a customer opens the invitation, is the link or button to respond to the survey visible (front and center) without having to scroll down? Remember, this should be the case on a smartphone as well as on a tablet or computer.
  • Is There a Call to Action? Your invitation should ask customers to respond and tell them why responding is important and what you’ll be doing with the information that will make their world and interaction with your product or service better. 
  • Are You Using Incentives to Increase Your Response Rate? Using incentives is complex and can be a bit tricky. But it’s always worth seeing if it is something that might work for you and your company. If you’re interested in testing it out, learn more about using incentives here.

Last but Not Least, Look at Revising the Survey Itself

Revising the survey itself may help increase responses. However, remember that revising the survey will only increase responses by reducing the number of people who abandon the survey after starting it. Typically, that number is quite small (about 5% for most CX surveys), so reducing abandonment probably won’t lead to a meaningful increase in the absolute number of responses. That being said, some of the things you should look for, in addition to the possibility that your survey is too long, are:

  • Is Your Survey Simple and Easy to Use? You should keep your survey focused on the topic it is intended to measure and avoid “nice to know questions.” In addition, avoid mixing response scales as much as possible, as this can lead to confusion for the respondent.
  • Does Your Survey Look Engaging? Your CX survey represents your brand. It should have the same voice and look and feel you use throughout all customer touch points-physical location, mobile app, website etc.
  • Is the Language in Your Survey Easy for Customers To Understand? Don’t use industry jargon. That turns off respondents and can lead to confusion. Be your brand, upfront with your requests, and transparent.
  • Does Your Survey Follow a Logical Flow to Walk the Customer Through the Experience Being Measured? This not only helps in reducing abandonment, but also helps customers recall the event accurately so they can give more thorough feedback.

When you want to increase the number of responses you receive, you should look beyond increasing your survey response rate and shortening your survey. There are much more effective ways to increase the number of responses that are often overlooked. 

Remember that we’re here with the latest tips and tricks to help you figure out the best way to listen to your customers (via surveys or other feedback channels like social media, websites, apps, reviews etc.), understand customer behaviors and wants and needs, and act upon what customers are saying to create better experiences and ultimately drive business success.

Want to learn more about how you can boost your customer experience survey response rate? Check out these InMoment Assets to learn more:

How Inferred Feedback Can Support Traditional CX Survey Solutions for Next-Level Intelligence

Whether your customers are visiting your storefront, browsing your website, unboxing your product on TikTok, or reading a review site, consumers interact with your brand in countless ways and places. But how do customer experience (CX) programs keep up with a customer journey that is constantly changing? A good place to start is going beyond traditional survey solutions to include more modern methods, listening posts, channels, and feedback types—solicited, unsolicited, and inferred. 

Not all valuable feedback gathered is solicited in the form of surveys, focus groups, or interviews (also known as direct feedback in the CX world). There is a wealth of unsolicited—or indirect feedback—in call centre recordings, social media feedback, and web chat transcripts. A company can also use inferred feedback by tracking customers’ behaviours, contact frequency or purchasing habits.

This post is all about going beyond direct and indirect survey options and questionnaires, and expanding your program to include inferred feedback. When you meet customers where they are, however and whenever they’re interacting with your brand, you are opening the door to big picture understanding, big picture improvements, and, most importantly, big picture results.

So, What’s Inferred Customer Feedback All About?

According to Gartner analysts, inferred feedback is operational and behavioural data associated with a customers experience or customer journey, like a website’s clickstream data, mobile app location data, contact centre operational data, or ecommerce purchase history. 

Bringing Inferred Feedback to Life 

As an example of all three feedback sources working together, let’s imagine a shoe retailer’s CX team launching a new release sneaker in store—and they’re on the hunt for actionable intelligence. There are multiple touchpoints along the journey to analyse in order to launch this product successfully.

When customers buy shoes (or anything else) at the store, they are given scannable QR codes on each receipt for direct feedback. They might take the survey, rate their in-store experience, and say they buy shoes there every 12 months, on average. 

For indirect feedback, the CX team would also look at reviews on their mobile app, Facebook, Instagram and YouTube to see what customers are saying about the latest and greatest sneakers. We can use text analytics tools to find common data themes as well as positive, negative, and neutral sentiment in a customer’s verbatim feedback. The CX team can also look into web chat notes, which might show how many people have contacted you asking for more details, stock levels or sneaker quality in the past. 

The last step is to look at inferred feedback. When it comes to sneakers, it will be useful to look at purchase history through a CRM, a loyalty program, or a  customer’s store account, which will show an important operational and segmentation piece of the puzzle. From your analysis, you might learn a few things:

  • the average repurchase cycle is 18 months
  • those customers purchasing more frequently are your fanatics, more likely to be singing your praises and spreading the word
  • your neutral customers are being nice and predictable
  • the skeptical, non-loyalists come and go as they please

When you combine this behavioural insight with the direct and indirect feedback that corresponds to each segment, you are painting a better picture of what is driving customers to act in certain ways. 

Are the fanatics more forgiving of experiences, more excited, or even demanding more of you? What does this intelligence tell you to do? Increase stock levels, super-charge loyalty bonuses, or pivot?

When you put all of these pieces into your data lake, you now have all the information you need to form a rich, single view of the customer. From there, you can start making sense of the data and creating a world-class action plan. 

How Do I Take Action on Inferred Customer Data? 

A problem many businesses are facing is how to link all sources of collected feedback together, turn it into something they can act on, and truly transform their business. Luckily, we have a few tips for going beyond insights to take action:

Action Step #1: Get the Right Reports to the Right People

When it comes to bringing inferred data to life, optimised reports are a superpower. Spend the time up front to figure out which insights deliver relevant, actionable, and effective intelligence, then to get that intelligence to the right people. We recommend creating reports that are customised, metric-specific, and delivered in real-time, and then looking for those CX advocates in your business who have the power to do something with them.

Action Step #2: Put Your CRM Data to Work

Integrating CRM data with your traditional feedback data can be a game changer. It helps you understand more about the customer to create more informed, personalised interactions that can boost average basket size, increase purchase frequency and drive brand advocacy to new levels. 

Action Step #3: Resolve Issues Quickly

Your inferred data will show when customers are at risk of churning. This is a great opportunity to intervene quickly, and turn an unhappy customer into a lifelong advocate. One of the most important actions your CX program should take is responding to customer issues quickly and efficiently, be it negative feedback, a bad social review, or knowing a customer had a difficult time processing a refund.

If you’re looking forward to leveling up your retail customer experiences, check out this white paper: “How to Modernise Your Customer Feedback.”

Surveys Are Boring, It’s What You Do with Them That’s Exciting: Three Ideas for Beating Survey Fatigue

In the world of customer experience, surveys have been a reliable feedback-collecting source for decades. As we make our way forward with new CX technologies and approaches, survey fatigue remains a key operational concern. CX professionals are finding it more challenging than ever to keep program momentum alive. Today, I’m going to share some tips for reviewing your survey program for better response rates, higher program engagement, and better representative results. Use these tips to deliver excellent experiences for your customers while demonstrating that their voice is being heard!

#1. Make Surveys Shorter. A LOT Shorter.

How many times have you called a customer service rep and thought, “I am your customer—you should already know all these details about me.” Well, people are potentially thinking this about your surveys, too. Ideally, experience surveys should take 2-4 minutes to complete, which can be easily achieved by cutting out the questions to which you already know the answers. Shorten surveys further by removing surplus demographic or operational data that could be sourced from your CRM or data lake (e.g. age, products held, customer tenure), and ultimately improved response rates.
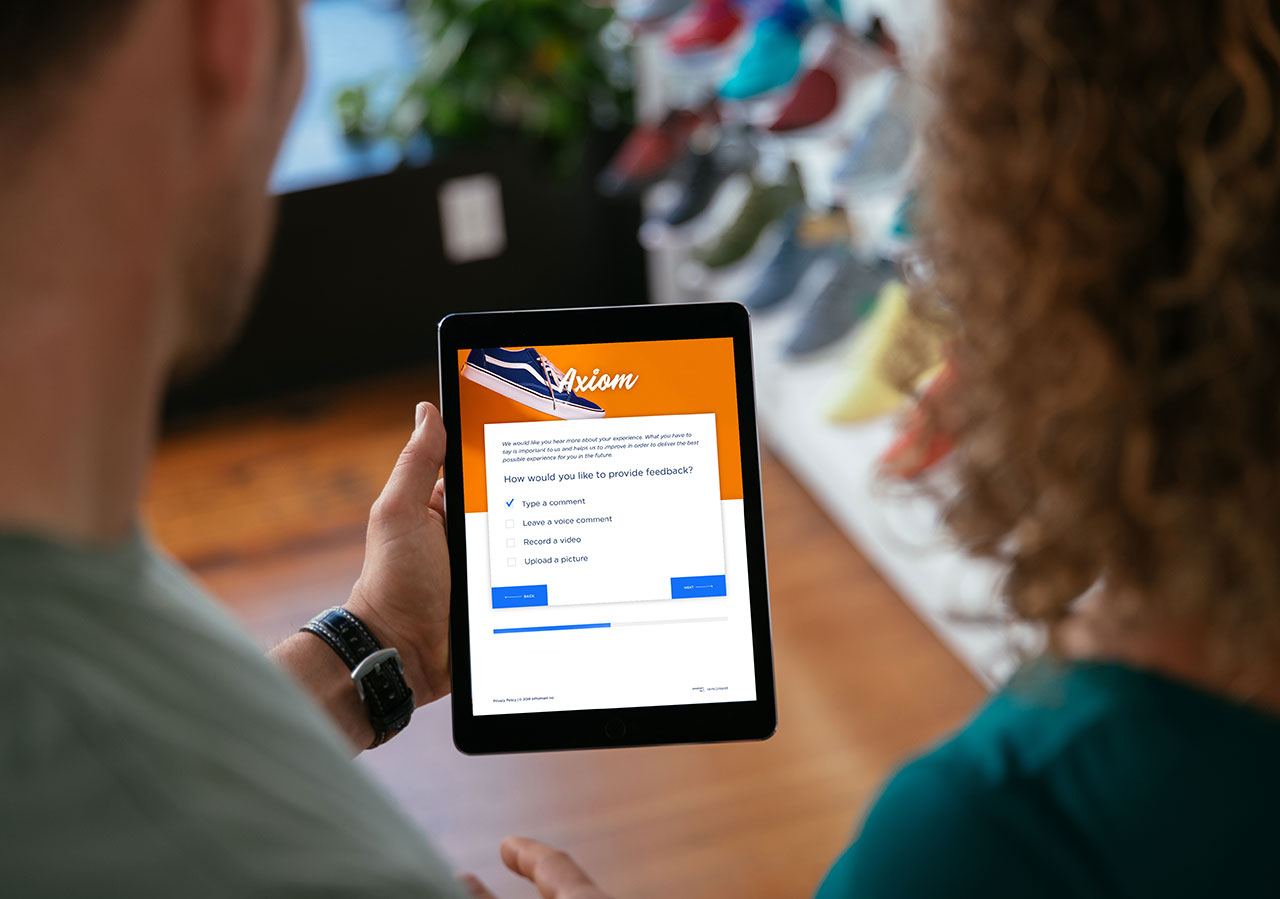
Another technique that is successful for many brands is to leverage microsurveys for mobile and other digital environments. A survey can be setup at each key digital touchpoint (like on a mobile app or website) to send a one or two question microsurvey with an open text box to capture immediate, in-the-moment responses from customers.

#2. Ask Survey Questions That Drive Action.

Whilst “good” survey questions vary from industry to industry, there are some overarching considerations needed to drive action from the customer’s voice:

  • Make sure each survey question has an owner within your organisation;
  • Consider the type of action that can be taken within your organisation from this question
  • Minimise words used in your questions. If the idea is clear without excess words, trim down wherever possible
  • Confirm each survey question is either aligned to customer experience goals and / or targets (e.g. expected front line behaviour or a KPI).

By keeping each of these principles in mind, you’ll ensure that each question can drive action within your organisation, which could in turn be used in comms to demonstrate you’ve: 

  • listened to customer’s feedback; and 
  • taken action to drive an improved experience.

#3. Make Your Surveys Count: Pull Transactional and Journey Surveys Into Your Case Management Program

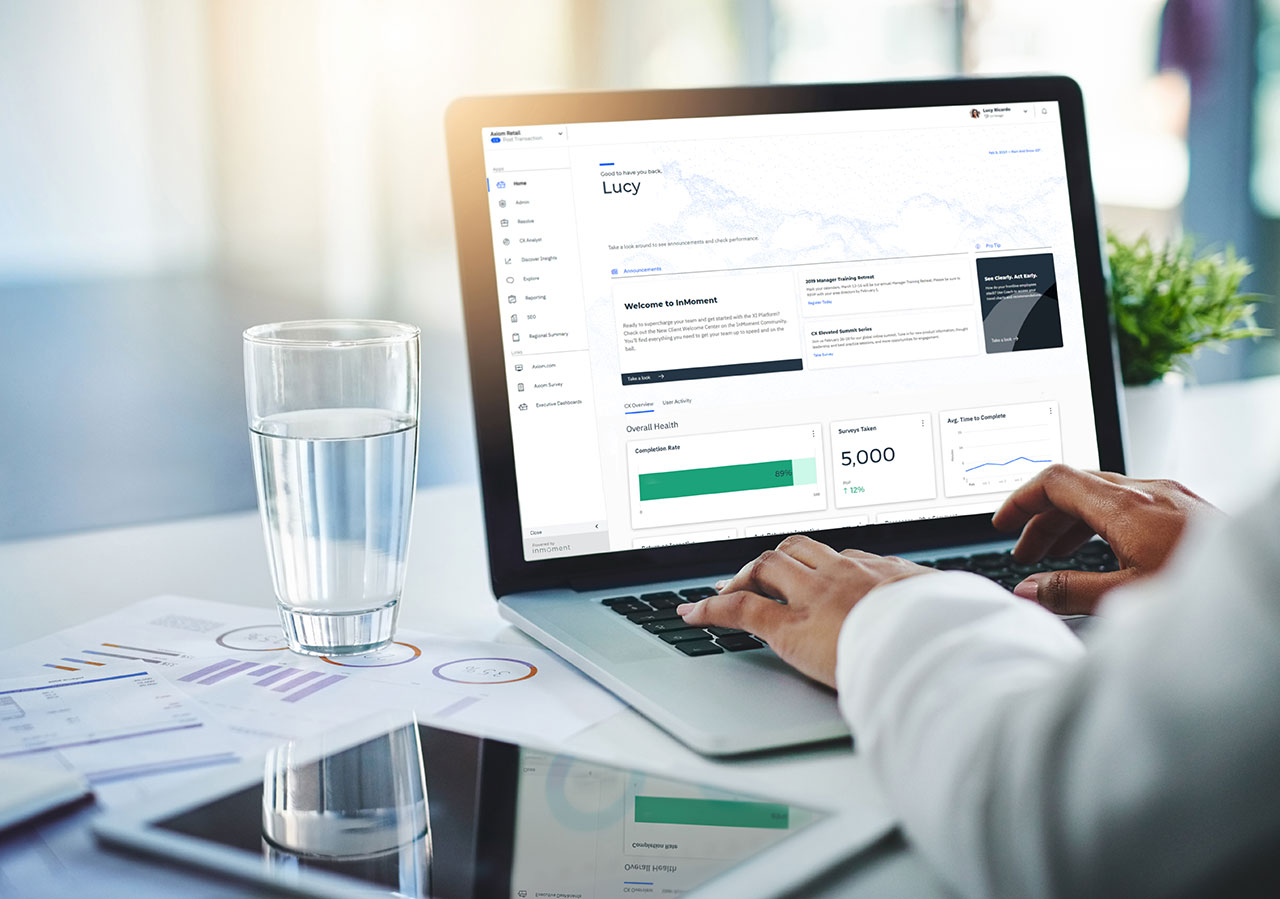
Surveys can be seen as the starting point of a customer conversation. Case management programs—also known as closed loop feedback (CLF) programs—enable trained staff to connect with customers one on one. Frontline staff call back customers to understand why an experience was either great or has room for improvement, and provide a chance to really connect with customers and hear their stories first hand. This can help drive continuous improvement initiatives, or provide  customer-driven evidence to support larger initiatives that may require a business-case. Further, and if conducted with a treatment / control approach (e.g. 50% of CLF qualifying customers receive a call), you can track how customers’ behaviour has changed after you close the loop. 

Don’t underestimate the potential positive brand impact you’ll see when customers receive a call from a representative after clicking “submit” on their survey. By optimising case management, it will give your program the opportunity to evolve outside of analytics, and start directly contributing more to other operational areas of the business.

In this world where we can reach customers in so many different ways, asking customers “how would you rate XYZ”, “why did you rate XYZ”, and “thinking over these elements, how would you rate…” can be boring, let’s be honest, especially if it is a long survey. Instead, we encourage you to make your surveys shorter to fight survey fatigue and look beyond the questions to discover how the customer’s voice can influence your organisation’s operational performance through CLF and actionable insights. 


To learn more about what makes a great survey and how to combat survey fatigue, we’ve put together a framework in this new paper, Transactional Customer Experience Survey Best Practices. Download for free today!

Three Ways to Find the Meaning Behind Ease & Effort Scores

For decades, brands have used metrics that gauge how easy (or difficult) a time customers have interacting with them, as well as how much effort it takes for customers to complete such transactions. At a glance, metrics that measure ease, effort, customer satisfaction, and the like can be very helpful for both alerting organizations to certain problems and giving them a surface-level idea of what those issues are. This makes them hand canaries in the coal mine.

While these metrics certainly have their uses, it’s much more difficult for brands to use them to find the deeper meaning behind problems. That is, unless they take part in a few brief exercises. Keep reading for the rundown on the exercises we suggest you apply to your own ease and effort scores.

Three Exercises to Help You Find the Meaning Behind Customer Ease & Effort Scores

  1. Driver Modelling
  2. Transaction Subgroups
  3. Customer Subgroups

Exercise #1: Driver Modelling

One of the best ways for brands to glean the meaning behind their metrics is to set them as the outcome measure of driver modelling. This technique enables organizations to not only better understand key parts of the customer experience, but also customers’ perceptions of those components. Driver modelling also lets organizations know whether they’ve used enough such metrics to adequately explain how effort is being impacted.

Exercise #2: Transaction Subgroups

Every interaction with your organization brings with it its unique amount of customer effort. Because of this, it’s handy to divide your transactions into groups depending on how much effort customers perceive they entail. Thus, diving deeper and analyzing transactions in this manner can help brands pinpoint friction or pain points, then create solutions to deal with them.

Exercise #3: Customer Subgroups

Your brand has a variety of different interactions—your customer base is even more diverse. Rather than study this base as a whole, brands can and should profile subgroups who, say, tend to report dissatisfaction more often than usual. Some groups of customers will, unfortunately, have a harder time interacting with your brand than the rest, and though the possible reasons behind that vary wildly from industry to industry, profiling subgroups like this can help brands further identify CX pain points and, more importantly, fix them in a way that those customers find meaningful.

Meaning Over Metrics

Like we said before, metrics have their uses and are helpful for letting brands know that customer satisfaction, ease, effort, etc are shifting in one direction or the other.

Applying these techniques to your metrics can make them much more powerful, giving your organization the context and the details it needs to meaningfully transform your customer experience. Your customers will thank you for it and feel much more valued, creating a human connection that transcends market forces and that builds a better bottom line for your brand.

Want to learn more about effort and ease and their purpose in customer experience? Check out our free white paper on the subject here!

Change Region

Selecting a different region will change the language and content of inmoment.com

North America
United States/Canada (English)
Europe
DACH (Deutsch) United Kingdom (English) France (français) Italy (Italian)
Asia Pacific
Australia (English) New Zealand (English) Singapore (English)