Qualtrics acquires experience management leader Press Ganey Forsta, expanding the world’s largest human experience management AI & data platform.
|
Read more.
You hear the term tossed around in most any meeting focused on customers: “What’s the NPS? How many Promoters do we have? How many Detractors?” You may be asking yourself “What is NPS and what should we be doing with it?”
Net Promoter Score (NPS) is a simple, powerful measure of customer loyalty. By asking customers to rate their likelihood to recommend a product or service on a 1-10 scale, you can gain actionable insights to guide decisions across your business.
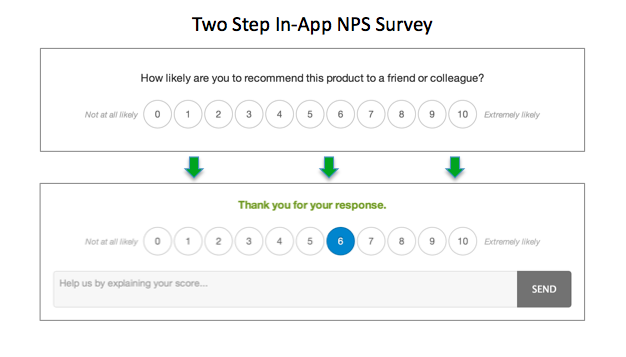
Let’s break down NPS calculation and see how it works.
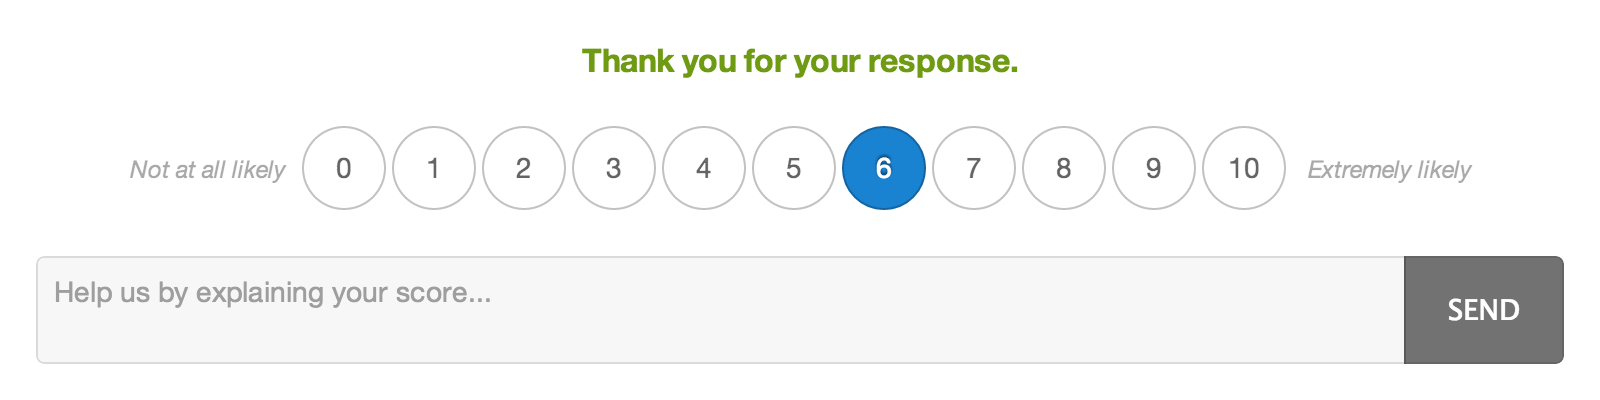
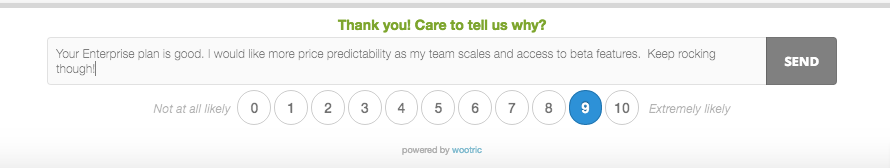
The survey then logs the response and gives the responder a chance to explain their answer in an open-text format.
That’s it! Because the survey is short, sweet, and to the point, customers are more likely to respond. And you’ve just gained valuable information ready to be turned into insights and used to improve your offerings.
Many NPS surveys offer this text box at the bottom of the questionnaire asking for reasoning behind their responses. This is also a valuable tool to gain better insight into your customer’s specific experiences.
Collect NPS Data with a Survey
Make sure that during the process of NPS calculation you are determining what specific information you are looking for from your audience. Make sure you know what you need feedback on, where you have the bandwidth to improve, and how you want to segment your customers in order to get the most specific results.
InMoment can help you get instant NPS analytics when you download the NPS software. Want to try it out? Get a free 30-day trial here.
How to Calculate NPS: The NPS Calculation Process
Once you have the customer feedback (step one), the fun part begins with NPS calculation.
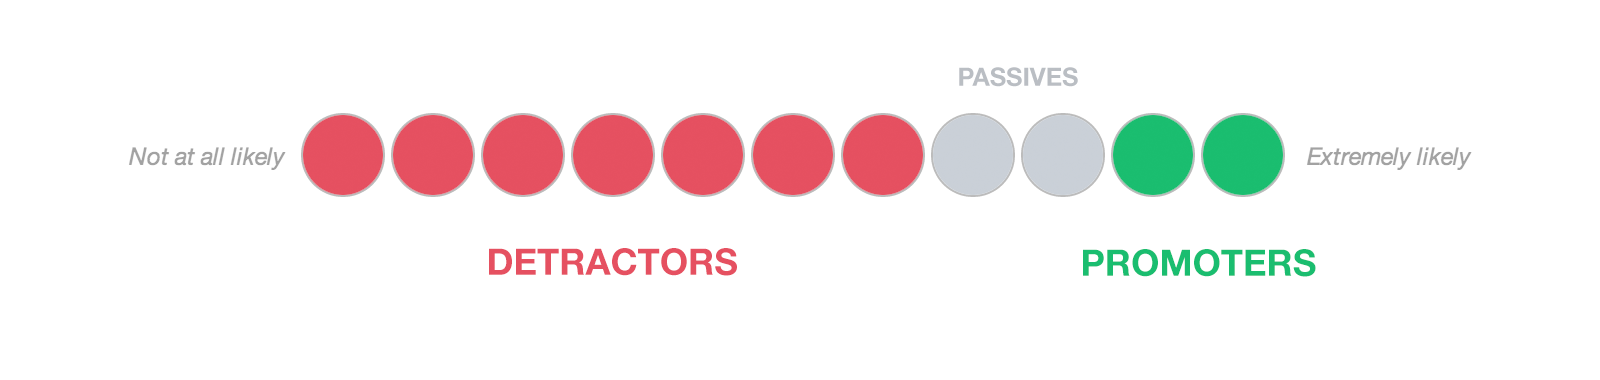
Respondents are classified into three groups based on their answers:
Promoters: Rating 9 or 10. Loyal customers who are a great source of referrals.
Passives: Rating 7 or 8. Customers who are satisfied with the service but are susceptible to competitors.
Detractors: Rating 0 – 6. Unhappy customers who can damage your brand.
What is the NPS Formula, and How Does it Work NPS Calculations?
NPS Calculation gives you a clear indication from one moment to the next of how happy your customers are. Real-time tracking can alert you to threats to your business, allowing you to take quick action. Tracked over time, it gives you insight into which of the company’s actions have resulted in the most customer value. Step three is to find the percentage of promoters and detractors. Lastly, step four is to calculate the NPS score using the information you have acquired so far.
To do the actual NPS calculation, subtract the % of respondents who are Detractors from the % of respondents who are Promoters.
NPS = ((# of Promoters – # of Detractors)/Total Survey Participants) x 100
Interpreting Your NPS Score
Now that you’ve calculated your net promoter score, of course you want to know what the number you ended up with actually means. Net promoter scores are expressed as a number ranging from -100 to +100. Any score above 50 is typically a good NPS. This would be because at least 50% of your company is a promoter, while less than 50% would fall under detractor. The most important thing you can do with your net promoter score is acknowledge it, and try to improve it.
Utilizing Customer Feedback
The answer to the open-ended NPS follow-up question tells you the “why” behind the rating. Mining this text for insights is what makes NPS calculation so powerful – because it gives you rich information on the customer experience you’re providing. Analyze the text answers and use them to guide the actions you take.
Don’t forget to follow up with the customer and close the feedback loop. Imagine immediately responding to a Detractor’s complaint, targeting your Passives with an information campaign, or asking a Promoter to review your product online.
Creating Additional Questions for Your NPS Survey
When you create an NPS survey, you typically do so with the sole purpose of measuring NPS. However, sometimes you need to measure NPS and acquire additional information that can help you to improve after you’ve learned your NPS score. This is where you need some key driver analysis. While it’s usually used for Customer Acquisition, key driver analysis can help you identify what your strengths and weaknesses are specifically and how you should address them in the future.
Ongoing Voice of the Customer
Repeat the NPS survey at regular intervals. Segment your NPS by types of customers to understand the “why” behind your score and how your decisions impact customer loyalty.
Once you have NPS calculation down, you’ll be ready to add in additional metrics over time at key customer journey touchpoints. When you combine the feedback from your NPS survey with feedback from CSAT (customer satisfaction) and CES (customer effort) surveys, these 3 core CX metrics give you a great foundation for making business decisions based on the authentic voice of the customer feedback.
Build end-user loyalty. Sign up today for free in-app NPS calculation feedback with InMoment.
Unlock Expert Guidance on Today’s CX Challenges & Opportunities
Whether you’re struggling with limited resources, data fragmentation, or evolving customer expectations, this guide offers the expert advice you need to elevate your CX strategy. Download now to discover how to transform these challenges into growth opportunities.
Thank you
Your download will begin shortly. If it doesn’t, click on the download button.
Get a first look at the trends that matter most and how they can impact your customer relationships, drive growth, and strengthen your overall strategy.
Thank you
Your download will begin shortly. If it doesn’t, click on the download button.
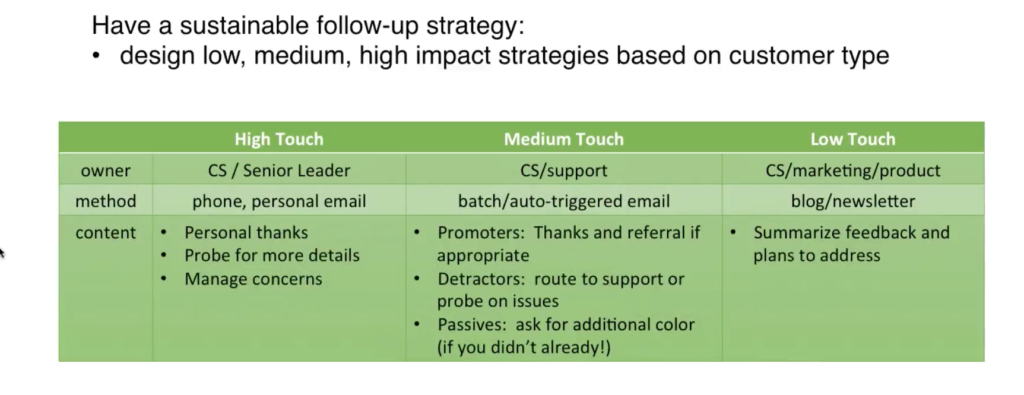
A good customer experience improvement program depends on two-way conversations between companies and their customers. It has been reported that nearly half (43%) of customers don’t bother complaining because they don’t believe companies care. Get ahead of that stat by demonstrating your company not only wants the feedback, you act on it. The three-tiered approach to customer follow-up (high touch, medium touch, and low touch) allows every company to effectively respond to customers, even if they can’t commit a lot of resources.
Treat customer feedback like a gift. It’s not enough to just gather Net Promoter Scores (NPS), you need to follow up with responders to let them know that 1) you appreciate their effort, and 2) their feedback has impact. Even if you can’t deliver everything customers ask for, they will remember that they were heard and appreciated. Closing the feedback loop will help you retain customers, increase response rates, and hopefully create loyal brand advocates.
Ready to respond? Good! Consider your resources and choose from three levels of engagement:
High Touch. This more resource-intensive approach has proven very effective for B2B companies. Every time a customer gives feedback, a Customer Success Manager or Account Manager contacts them. Don’t worry, it doesn’t have to be an in-depth correspondence. Sometimes a simple “thank you” is all that’s needed. Other times, you can dig deeper into their response (and deeper into the relationship) in order to make the feedback even more actionable.
Medium Touch. We get it — not every business has the headcount to personally respond to every piece of feedback they receive. Automating the feedback loop is a time and resource saver. Segment your customer responses by the rating each customer gives and you can still have a personalized impact where it counts most. Your follow up plan could look something like this:
Promoter. Send a “thank you” and possibly offer an incentive for the customer to share your product.
Detractor. Route the response to Customer Success or Customer Support to uncover why that responder isn’t happy, especially if they didn’t leave further feedback explaining their rating.
Passive. Deliver a message to passive raters who didn’t leave feedback, engaging them in a “What would make you LOVE us?” conversation.
Low Touch. If you have too many users to provide individual responses, or you don’t have contact information, you can still close the loop! Develop blanket communications that offer transparency and information sharing:
A monthly blog post or newsletter. Summarize the feedback you’ve received, and detail the actions you’ll be taking in response to issues customers have raised.
Product updates or release notes. CX champions in product or UX can use these to communicate “We heard you! Today we <fixed X or launched Z>.”
All three levels of engagement deliver impact, so choose the one that best fits your needs. InMoment customer Albacross chose a medium touch model, which resulted in 2X the NPS scores and a 2X ratings increase on Capterra.
By closing the loop with customers, you show them that you’re not only listening to their feedback, you consider it so important that you’re using it to make their experiences better. This simple step can turn ambivalent customers into vocal fans.
As we begin this new year, we want to share some great news.
Today we’re excited to announce that Wootric is joining InMoment, a market leader in customer and employee experience. InMoment serves many of the largest, most sophisticated global organizations from Starbucks to Ford to VMWare.
This next step in our evolution means great things for our customers and other businesses seeking a modern approach to CX improvement.
We will continue to deliver the world-class product experience you expect from us. In addition, our pace of innovation and our ability to support our customers around the globe will accelerate as we leverage the considerable resources and expertise of InMoment.
Our customers will also be able to tap into InMoment’s expertise and enterprise solutions as their CX needs evolve beyond our turnkey approach.
Seven years ago, we founded Wootric with a mission to empower customer-centricity in every organization through modern, always-on CX improvement. We launched with a high-response in-app microsurvey and quickly disrupted a dated approach to gathering and responding to Net Promoter Score feedback.
Guided by input from our customers, we invested in omni-channel feedback collection, AI-driven customer journey analytics, and native integrations with the modern tech stack — all the while staying true to the flexible, lightweight, user-centric approach to CX improvement that businesses expect from Wootric.
Wootric now delivers the fastest ROI in the Experience Management category on G2. Over 1200 businesses worldwide, including DocuSign, Zoom, and Comcast, use Wootric software to improve customer lifetime value with insights and action from voice of the customer data.
We thank our customers, partners, investors, advisors, and above all members of our exceptional team for their support, and for choosing to be on the CX journey with us.
Together, with InMoment, we will make 2021 an amazing year for customer experience!
With gratitude,
Deepa Subramanian, CEO & Jessica Pfeifer, Chief Customer Officer
The founders would also like to extend a special thank you to Steve Gurney at Viant Group for representing Wootric through this process.
Customer comments are the lifeblood of any CX program, giving you the “why” behind customers’ NPS, CES, and CSAT scores. But until recently, it’s been nearly impossible to make sense of feedback from hundreds of customers at a time. Using artificial intelligence (AI) to automate text analysis gives you the consistent and fast insights you need, at scale.
That said, automated text analysis isn’t just about technology. Humans need to put in the time upfront to teach the machine, by providing an accurately tagged set of feedback for AI to work from. The quality of that training data sets up the quality of your text analytics results, or as the old saying goes “garbage in, garbage out”.
Let’s look at what you need to be successful with automated text analytics. We’ll dig into the basics of text analytics, the inconsistencies of manual tagging, and how to create good training data and models.
A quick primer on AI training sets
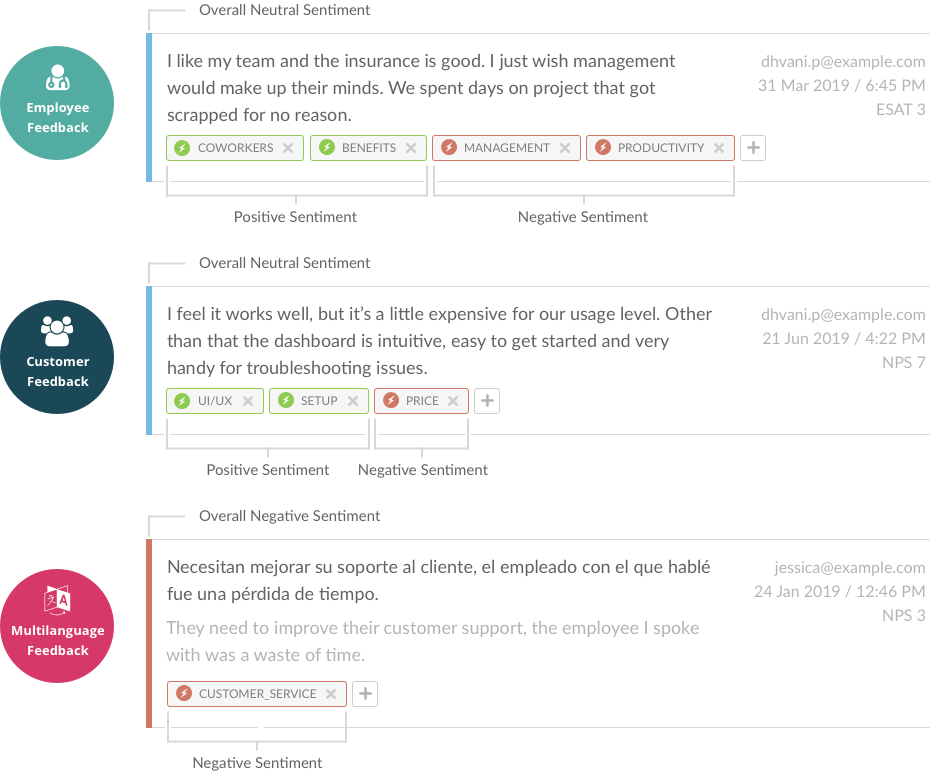
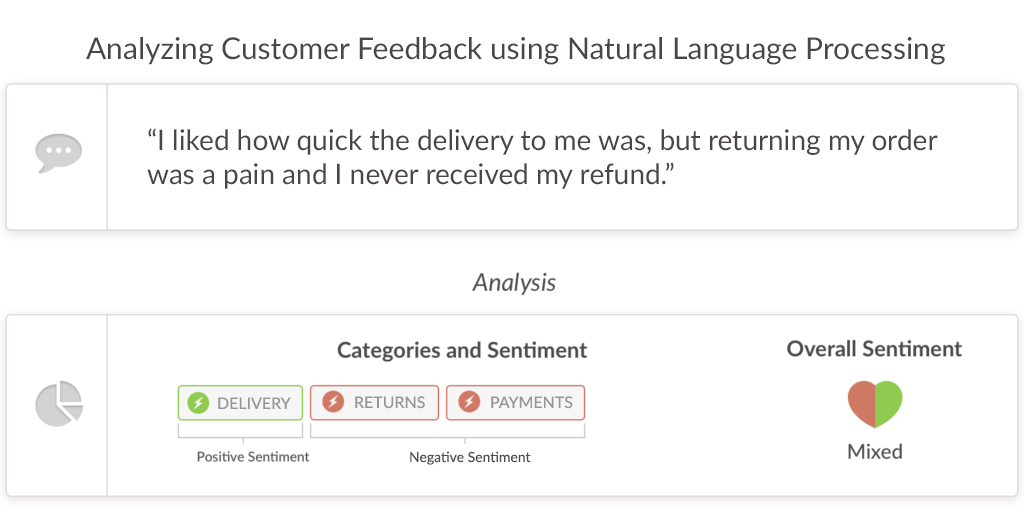
Analyzing customer feedback from unstructured text can be complex. In one sentence a customer may talk about a variety of topics, offering negative, neutral, or positive feedback (sentiment) about each of them. It’s the job of machine learning to recognize what the customer is talking about and identify how they are feeling about those topics. With text analytics, it only takes an instant to:
Tag comments / categorize themes
Assign sentiment to each of the tags and the comment overall
Aggregate results to find insights
Text analyzed for sentiment and themes
Again, machine learning is only as good and accurate as the data set you (the humans) provide to train the algorithm. So you need to do it right.
At Wootric, we have a lot of experience helping teams create training datasets. While we have sets of tags that are specific to various industry verticals, we also build custom machine learning models for many customers. Custom models are helpful for companies that are in a new vertical or a unique business.
Training model process
For the most part, companies have a good feel for what their users/customers are talking about and the topic tags they need. If they’re not sure, we can analyze their data and work with them to help them think through a set of tags to get them started. Once they have a set of agreed tags, they start creating the training data.
The process for creating this training dataset goes something like this.
Decide what tags are important to your business
Create definitions for those tags so everyone knows exactly what the tags mean
Pull 100-200 customer comments
Our customer assembles a team of at least 3-5 people who independently review each comment and determine:
If the comment sentiment is overall positive, neutral, or negative
Which tags apply to that comment
That last point is where things get interesting for a data analyst like me.
Manual tagging: an inconsistent truth
Many companies still believe having human tagging and analysis is superior to AI. We’ve seen one employee hired full-time to pour over spreadsheets, organizing data and pulling insights, which takes A LOT of time. Other companies bring in a team of people (the interns!), which introduces inconsistencies. Not only is it expensive and time-intensive, manual tagging isn’t necessarily accurate.
These same inconsistencies appear when creating training datasets because the process starts with manual tagging. Customer teams creating training data are always surprised by the level of disagreements on “defined” tags. It can take a few rounds of work to iron these out.
Tag definitions vary
Not all tags carry the same level of complexity. Some tags make it easy for people to agree upon a definition, while others may be more ill-defined. Vague tags tend to invite more disagreement between human labelers who label the same dataset independently.
Let’s look at a couple of examples from the software industry:
“MOBILE” — applied to any feedback containing references to a mobile app or website functionality. This should be straightforward for a group of human labelers to apply similarly, and would most likely only result in a few disagreements between them.
“USER EXPERIENCE” — a more complex phrase with many different definitions of what could be included in a user’s experience. When a comment mentions search functionality, is that UX? How about when they say something like “While using the search bar, I found information on…“? Or even “Great product”? Because there is so little clarity on what fits in this category, the training team will surely disagree, leading to more rounds of tagging and defining.
The good news is that at the end of the process, after a few rounds of defining the tags and applying them, the team REALLY knows what is meant by a given tag. The definition is sharper and less open to interpretation. This makes the machine learning categorization more meaningful, and more actionable for your company, which leads to an improved customer experience.
Getting to a good training model
Let’s look at a real-world example of creating a training set, and the level of label agreement between the people creating those labels.
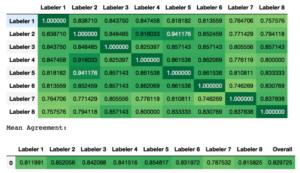
A recent enterprise customer used 8 human labelers on the same initial set of 100 comments, and we then evaluated the labeler-agreement of each tag. During this exercise, each labeler worked independently , and we charted the agreement scores.
In the following two charts, the number in each cell represents the strength of the agreement from 0 – 1 between two labelers (F1-Score calculated from Precision and Recall values).
1.0 would be the ideal labeler agreement value.
0 means no agreement.
The lower row of the chart contains the average agreement across all cells for that labeler.
In Figure 1, it’s clear that the tag is fairly well-defined, which results in an overall average labeler agreement of ~0.83. This is on the higher end of what we typically see.
Figure 1 – agreement on a well-defined tag
In other words, even a well-defined tag doesn’t garner complete agreement between labelers. Labeler 5, our most effective labeler, only scored a 0.85 average. Labeler 1 and 8, with an F-1 score of .75, didn’t apply the tag, in the same way, a significant portion of the time. But it’s still considered successful.
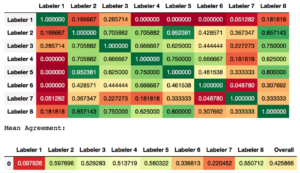
Now, look at Figure 2, which shows the first-round results of the team’s effort to consistently apply a more complex tag. It resulted in an overall average labeler agreement of only ~0.43.
Figure 2 – disagreement on a vague tag
For the same group of labelers tagging at the same time, two different tags demonstrate nearly 2x difference in overall agreement — showing again that even we humans aren’t as good at manually categorizing comments as we would like to think.
Even when teams agree on 1) what tags to use and 2) the definition of each tag, they don’t necessarily wind up applying tags in the same way. It takes a few rounds for teams to come close enough to consensus to be useful for machine learning.
Ready for autocategorization
Text analytics is not a perfect science. When are the label agreement results ready for prime time? Typically, we consider a model good enough to deploy once the F-1 score is around 0.6 (give or take a bit based on other factors). Like most things in life, when you invest more time upfront — in this case boosting F-1s with additional rounds of tagging/defining — you typically end up with better results.
The potential for machine learning to elevate the customer experience has everyone buzzing. AI-powered text and sentiment analysis can be an incredible solution for specific problems that CX pros face.
But how do you know when the time is right to move to the next level of CX? Are there new tools you can purchase to step your game up? How do you know they’ll be worth it?
There are clear signs that your CX program is ready for, and your company could quickly benefit from, text and sentiment analysis. And we’ll delve into them here.
Before we get going, some definitions:
Text analysis takes qualitative customer comments and determines relevant themes. Software companies might see themes such as ‘feature request’, ‘bug’, or ‘pricing’. This allows you to quickly see what your customers are focusing on, and then dive in to see what they’re specifically saying about each topic.
Sentiment analysis offers micro and macro insights into how your customers are feeling about your company and products. It determines whether the text received for each text theme is positive, negative, or neutral. It also analyzes the comment as a whole, assigning sentiment to the entire verbatim text.
Let’s look at the 7 signs text and sentiment analytics will be worth the investment for your company.
1. You have a mature or quickly-maturing CX program.
Those of you considering text and sentiment analytics probably already have a few key elements in place:
A customer experience strategy and a Voice of Customer listening system
A C-suite sponsor who has been fostering a customer-centric culture across the whole company with NPS as the guiding star
A system asking for feedback through the entire customer journey
Now that you have a relatively mature CX program, you’re wondering how to extract even more value out of it.
2. You receive 500+ comments per month (or you’re headed there.)
Ideally, you want to listen to all of your customers – not just a sample or the first to respond. In reality, at a certain point the sheer volume of incoming customer feedback is more than a CX program can handle without an upgrade. You know this is the case when:
You feel excitement and dread regarding the amount of feedback you receive.
You’re anticipating a whole lot more comments soon.
You’ve even had to cap the number of comments you receive in a day to avoid being overwhelmed with the task of organizing and responding to everyone.
Overwhelming amounts of feedback is an amazing problem to have, but a problem nonetheless. Using text and sentiment analytics, you can turn unstructured qualitative feedback, like NPS comments, into organized insight in a matter of minutes.
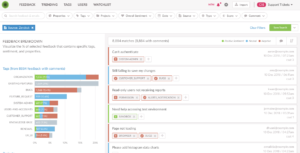
Text and sentiment analytics allow you to analyze customer feedback using Natural Language Processing, looking something like this:
By combining text and sentiment analytics, you can search negative comments and quickly assess, for example, that 80% of your negative comments are about pricing. Or 45% of your customers in the Northeast region are talking about slow delivery times. That summary lets you know where to focus resources, and how quickly you need to make the change relative to other company priorities.
3. You’re sitting on a goldmine of feedback, but unable to get actionable insights.
Do you have a backlog of comments waiting to be read and sorted? Or maybe you’ve skimmed a few comments to answer the urgent ones, but you keep putting off the others.
One of our clients came to us with NPS survey comments from thousands of users. But rather than mining that information, they were running focus groups to prioritize feature requests because it was easier. They were duplicating efforts to get information they already had but couldn’t access and act on.
“The two biggest mistakes [in CX] are not doing qualitative research in the first place and then not putting it to use.” –Morgan Brown, Product Manager at Facebook and coauthor of ‘Hacking Growth’
If you’re feeling this pain, it’s time to automatically mine the insight from that pile of comments you’ve been sitting on. Turn anecdotes and hunches that you’ve got about your customer experience into evidence-backed insight by using. And do it quickly with text and sentiment analytics.
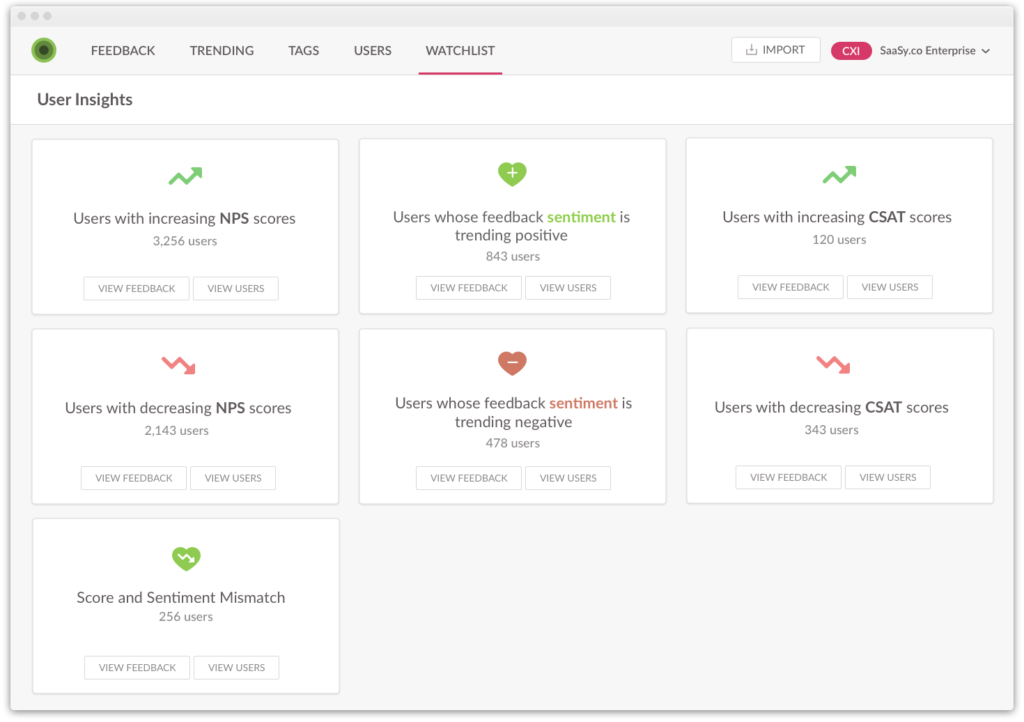
Source: CXInsight™ Dashboard
Sliced and diced organized feedback is easily available with many platforms that offer text and sentiment analytics. Doing this can help you understand the root cause of trends – like the needs of different customer personas or geographic regions – more comprehensively.
4. Manual feedback organization & categorization is insightful, but painfully slow.
While some customers duplicate efforts between data gathering and focus groups to get insight, other CX pros just bite the bullet and spend hours reading customer comments, labeling them, and funneling them into an unwieldy spreadsheet. They’re understandably frustrated by how difficult it is to get actionable insight.
By using text and sentiment analytics, humans can get huge quantities of customer feedback sorted and analyzed at the push of a button. Better yet, computers don’t have bad days or lose focus.
Once organized with tags, your time is freed up to look at the themes and trends that arise from the noise, then create actionable strategies based on those insights.
Now you can jump straight into action and the interns can work on more interesting, valuable projects!
PRO TIP: To get high quality insights at the push of a button, algorithms need to be trained. Be sure your feedback management software vendor has a team that will work with your data to ensure you get valuable insight from the start. With more data and occasional human guidance, you’ll get better and faster insight over time.
5. Your CX program lacks a real-time issue detection system.
An important element to providing a good customer experience is making sure any issues are handled quickly and efficiently. If you can detect and address them before your customer has a real issue, your CX program has paid for itself.
One of the benefits of having text and sentiment analysis is that your data and insights are updated in real-time. This means you have a new issue detection system.
Source: CXInsight™ Dashboard
This works best for a more mature customer feedback program with an established baseline, or status quo. For example, you know that on any given day, in any given geographic region, about 10% of your comments are tagged with ‘out of stock’ as an issue. When you check in and see that in Texas, 25% of comments coming in are tagged ‘out of stock’, that raises a red flag. You can immediately dig into specifics, read through the verbatims, and send those comments to the right people for follow up before the issue blows out of proportion.
The CX dream of being proactive in solving issues can be achieved with the help of automated organization of qualitative feedback.
6. Your internal teams aren’t agreeing on CX priorities.
It’s a given that successful companies focus on customer needs and experiences. The question is: is everyone at your company seeing the same information in the same way? If not, you’re wasting time and costly resources with competing priorities, and it is definitely time to invest in tools to fix it.
By having your CX tech parse the text and sentiment of your 1K+ daily inputs of customer feedback, you can democratize the information and insights across every team at your company. And that will ensure team leaders can quickly align to address the right priorities. So product development and customer support will be on the same page, and features will get developed (or possibly de-bugged) to meet the most important needs of the customer.
How does that happen? Feedback from every customer touchpoint is analyzed, from in-product surveys to emails. In this example, support ticket subject lines are auto-categorized and everyone from support to service to product to the c-level can see what issues are hot items to address.
Source: CXInsight™ Dashboard
Looking at the text analytics, it quickly becomes apparent that 15% of the support tickets are related to bugs that need to be addressed. On the proactive front, product could also delve into comments tagged “feature request” and focus on user concerns about UX/UI.
7. You need to demonstrate the ROI of your CX program.
Companies are eager to hop on the CX bandwagon, but it can still be a fight to get the proper resources to make a CX program thrive. You’ve probably already shown the C-suite the correlation between CX and revenue growth, but there’s pressure to squeeze a little more ROI out of what you’ve established.
Investing in a tool that pulls ROI from data is an expense. But it’s a more strategic spend than, and offers more immediate follow-up and action, than performing passive data review and organization. It’s also a moredirect value-add and much less expensive than hiring a third party human operation.
The cascading effects throughout the organization will increase ROI in the long-term as well.
Product teams can prioritize and build with evidence-based confidence.
Marketing teams will gain an understanding of different personas and see customers excited to spread the word about your business.
Support and operations teams will have early warning of potential issues and have more context when dealing with problems.
In the end, qualitative data is crucial to extracting value out of CX initiatives. Having more data from engaged customers should not be an obstacle.
Is this the point?
Are you seeing any of these 7 signs when you look at your company’s CX program? If so, do a cost benefit analysis. Typically, once your program has matured, the cost of tools that create actionable insights out of customer feedback are far cheaper than the cost of misaligned resources and long delivery times. Text and sentiment analytics make the resources you put into CX initiatives efficient, and turn the large quantity of unstructured data into an advantage by mining insight that would otherwise sit in limbo. Move this tipping point in your favor.
Get a first look at the trends that matter most and how they can impact your customer relationships, drive growth, and strengthen your overall strategy.
Thank you
Your download will begin shortly. If it doesn’t, click on the download button.
Healthcare databases are growing exponentially. Today, healthcare providers, drug makers and others are turning this data into value by using text analytics and natural language processing to mine unstructured healthcare data and then doing something with the results. Here are some examples.
This article explores some new and emerging applications of text analytics and natural language processing (NLP) in healthcare. Each application demonstrates how HCPs and others use natural language processing to mine unstructured text-based healthcare data and then do something with the results.
Healthcare databases are growing exponentially, and text analytics and natural language processing (NLP) systems turn this data into value. Healthcare providers, pharmaceutical companies and biotechnology firms all use text analytics and NLP to improve patient outcomes, streamline operations and manage regulatory compliance.
In order, we’ll talk about:
Sources of healthcare data and how much is out there
Improving customer care while reducing Medical Information Department costs
Hearing how people really talk about and experience ADHD
Facilitating value-based care models by demonstrating real-world outcomes
Guiding communications between pharmaceutical companies and patients
Even more applications of text analytics and natural language processing in healthcare
Some more things to think about, including major ethical concerns
NLP in the Healthcare Industry: Sources of Data for Text Mining
Patient health records, order entries, and physician notes aren’t the only sources of data in healthcare. In fact, 26 million people have already added their genetic information to commercial databases through take-home kits. And wearable devices have opened new floodgates of consumer health data. All told, Emerj lists 7 healthcare data sources that, especially when taken together, form a veritable goldmine of healthcare data:
1. The Internet of Things (IoT) think FitBit data)
2. Electronic Medical Records (EMR)/Electronic Health Records (EHR) (classic)
3. Insurance Providers (claims from private and government payers)
4. Other Clinical Data (including computerized physician order entries, physician notes, medical imaging records, and more)
5. Opt-In Genome and Research Registries
6. Social Media (tweets, Facebook comments, message boards, etc.)
7. Web Knowledge (emergency care data, news feeds, and medical journals)
Just how much health data is there from these sources? More than 2,314 exabytes by 2020, says BIS Research. For reference, just 1 exabyte is 10^9 gigabytes. Or, written out, 1EB=1,000,000,000GB. That’s a lot of GB.
But adding to the ocean of healthcare data doesn’t do much if you’re not actually using it. And many experts agree that utilization of this data is… underwhelming. So let’s talk about text analytics and NLP in the health industry, particularly focusing on new and emerging applications of the technology.
Improving Customer Care While Reducing Medical Information Department Costs
Every physician knows how annoying it can be to get a drug-maker to give them a straight, clear answer. Many patients know it, too. For the rest of us, here’s how it works:
You (a physician, patient or media person) call into a biotechnology or pharmaceutical company’s Medical Information Department (MID)
Your call is routed to the MID contact center
MID operators reference all available documentation to provide an answer, or punt your question to a full clinician
Simple in theory, sure. Unfortunately, the pharma/biotech business is complicated. Biogen, for example, develops therapies for people living with serious neurological and neurodegenerative diseases. When you call into their MID to ask a question, Biogen’s operators are there to answer your inquiry. Naturally, you expect a quick, clear answer. At Biogen Japan, any call that lasts more than 1 minute is automatically escalated to an expensive second-line medical directors. Before, Biogen struggled with a high number of calls being escalated because their MID agents spent too long parsing through FAQs, product information brochures, and other resources.
Today, Biogen uses text analytics (and some other technologies) to answer these questions more quickly, thereby improving customer care while reducing their MID operating costs. When you call into their MID, operators use a Lexalytics-built search application that combines natural language processing and machine learning to immediately suggest best-fit answers and related resources to people’s inquiries. MID operators can type in keywords or exact questions and get what they need in seconds. (The system looks like this illustration.) Early testing already shows faster answers and fewer calls sent to medical directors, and the application also helps new hires work at the level of experienced operators, further reducing costs.
Hearing How People Really Talk About and Experience ADHD
The human brain is terribly complicated, and two people may experience the same condition in vastly different ways. This is especially true of conditions like Attention Deficit Hyperactivity Disorder (ADHD). In order to optimize treatment, physicians need to understand exactly how their individual patients experience it. But people often tell their doctor one thing, and then turn around and tell their friends and family something else entirely.
A Lexalytics (an InMoment company) data scientist used our text analytics and natural language processing to analyze data from Reddit, multiple ADHD blogs, news websites, and scientific papers sourced from the PubMed and HubMed databases. Based on the output, they modeled the conversations to show how people talk about ADHD in their own words.
The results showed stark differences in how people talk about ADHD in research papers, on the news, in Reddit comments and on ADHD blogs. Although our analysis was fairly basic, our methods show how using text analytics in this way can help healthcare organizations connect with their patients and develop personalized treatment plans.
Facilitating Value-Based Care Models by Demonstrating Real-World Outcomes
Our analysis of conversations surrounding ADHD is just one example in the large field of text analytics in healthcare. Everyone involved in the healthcare value chain, including HCPs, drug manufacturers, and insurance companies are using text analytics as part of the drive towards value-based care models.
Within the value-based care model, and outcome-based care in general, providers and payers all want to demonstrate that their patients are experiencing positive outcomes after they leave the clinical setting. To do this, more and more stakeholders are using text analytics systems to analyze social media posts, patient comments, and other sources of unstructured patient feedback. These insights help HCPs and others identify positive outcomes to highlight and negative outcomes to follow-up with.
Some HCPs even use text analytics to compare what patients say to their doctors, versus what they say to their friends, to identify how they can improve patient-clinician communication. In fact, the larger trend here almost exactly follows the push in more retail-focused industries towards data-driven Voice of Customer: using technology to understand how people talk about and experience products and services, in their own words.
Guiding Communications Between Pharmaceutical Companies and Patients
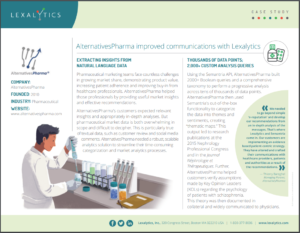
Pharmaceutical marketing teams face countless challenges. These include growing market share, demonstrating product value, increasing patient adherence and improving buy-in from healthcare professionals. Lexalytics customer AlternativesPharma helped those professionals by providing useful market insights and effective recommendations.
Before, companies like AlternativesPharma relied on basic customer surveys and some other quantitative data sources to create their recommendations. Using our text analytics and natural language processing, however, AlternativesPharma was able to categorize large quantities of qualitative, unstructured patient comments into “thematic maps.” The output of their analyses led to research publications at the 2015 Nephrology Professional Congress and in the Journal Néphrologie et Thérapeutiques.
Further, AlternativesPharma helped customers verify assumptions made by Key Opinion Leaders (KOLs) regarding the psychology of patients with schizophrenia. This theory was then documented in collateral and widely communicated to physicians. (Full case study)
More Applications of Text Analytics and Natural Language Processing in Healthcare
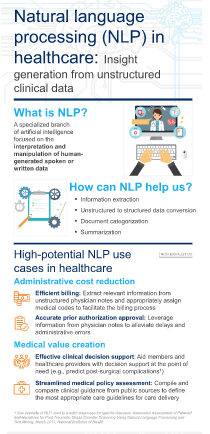
The above applications of text analytics in healthcare are just the tip of the iceberg. McKinsey has identified several more applications of NLP in healthcare, under the umbrellas of “Administrative cost reduction” and “Medical value creation”. Their detailed infographic is a good explainer. Click the image (or this link) to read the full infographic on McKinsey’s website.
Meanwhile, this 2018 paper in The University of Western Ontario Medical Journal titled “The promise of natural language processing in healthcare” dives into how and where NLP is improving healthcare. The authors, Rohin Attrey and Alexander Levitt, divide healthcare NLP applications into four categories. These cover NLP for:
Patients – including teletriage services, where NLP-powered chatbots could free up nurses and physicians
Physicians – where a computerized clinical decision support system using NLP has already demonstrated value in alerting clinicians to consider Kawasaki disease in emergency presentations
Researchers – where NLP helps enable, empower and accelerate qualitative studies across a number of vectors
Healthcare Management – where patient experience management is brought into the 21st-century by NLP used on qualitative data sources
Next, researchers from Sant Baba Bhag Singh University (former link) explored how healthcare groups can use sentiment analysis. The authors concluded that using sentiment analysis to examine social media data is an effective way for HCPs to improve treatments and patient services by understanding how patients talk about their Type-1 and Type-2 Diabetes treatments, drugs, and diet practices.
Finally, market research firm Emerj has written up a number of NLP applications for hospitals and other HCPs, including systems from IQVIA, 3M, Amazon and Nuance Communications. These applications include improving compliance with industry standards and regulations; accelerating and improving medical coding processes; building clinical study cohorts; and speech recognition and speech-to-text for doctors and healthcare providers.
Some More Things to Consider: Data Ethics, AI Fails, and Algorithmic Bias
If you’re thinking about building or buying any data analytics system for use in a healthcare or biopharma environment, here are some more things you should be aware of and take into account. All of these are especially relevant for text analytics in healthcare.
First: According to a study from the University of California Berkeley, advances in artificial intelligence (AI) have rendered the privacy standards set by the Health Insurance Portability and Accountability Act of 1996 (HIPAA) obsolete. We investigated and found some alarming data privacy and ethics concerns surrounding AI in healthcare.
Second: Companies with regulatory compliance burdens are flocking to AI for time savings and cost reductions. But costly failures of large-scale AI systems are also making companies more wary of investing millions into big projects with vague promises of future returns. How can AI deliver real value in the regulatory compliance space? We wrote a white paper on this very subject.
Third: The “moonshot” attitude of big tech companies comes with huge risk for the customer. And no AI project tells the story of large-scale AI failure quite like Watson for Oncology. In 2013, IBM partnered with The University of Texas MD Anderson Cancer Center to develop a new “Oncology Expert Advisor” system. The goal? Nothing less than to cure cancer. The result? “This product is a piece of sh–.”
Fourth: “Bias in AI” refers to situations where machine learning-based data analytics systems discriminate against particular groups of people. Algorithmic bias in healthcare AI systems manifests when data scientists building machine learning models for healthcare-related use cases train their algorithms on biased data from the start. Societal biases manifest when the output or usage of an AI-based healthcare system reinforces societal biases and discriminatory practices.
Improve Your Understanding: What Are Text Analytics and Natural Language Processing?
In order to put any tool to good use, you need to have some basic understanding of what it is and how it works. This is equally true of text analytics and natural language processing. So, what are they?
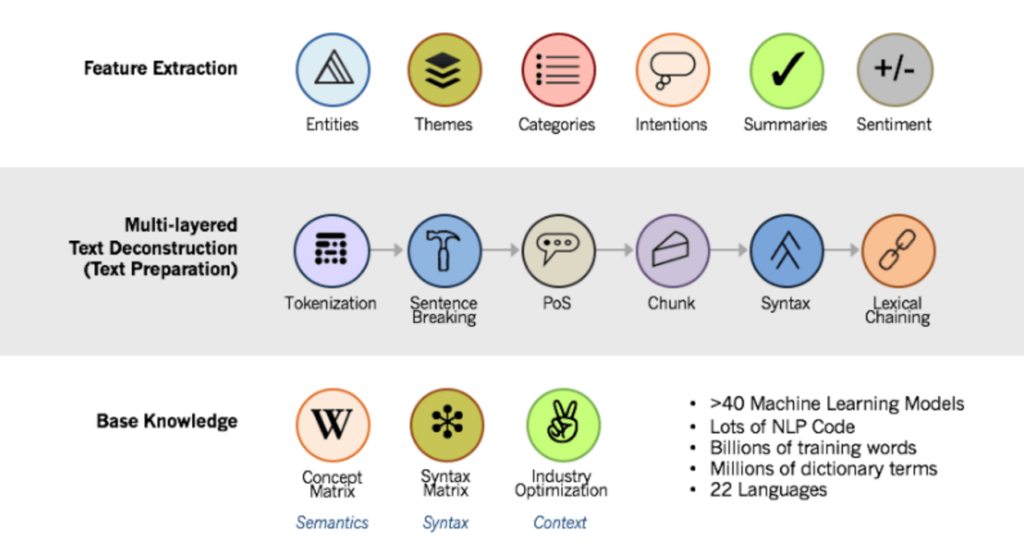
Text analytics and natural language processing are technologies for transforming unstructured data (i.e. free text) into structured data and insights (i.e. dashboards, spreadsheets and databases). Text analytics refers to breaking apart text documents into their component parts. Natural language processing then analyzes those parts to understand the entities, topics, opinions, and intentions within.
Lexalytics’ text analytics and NLP technology stack, showing the layers of processing each text document goes through to be transformed into structured data.
While the impact of artificial intelligence (AI) is a bit of a mixed bag in a number of industries, we’re seeing some exciting traction in financial services. In this month’s article, I take a look at some specific examples of where machine learning and AI are helping financial services organizations improve their services, products, and processes.
AI Helps Financial Services Reduce Non-Disclosure Risk
Financial firms and banks are taking advantage of AI to ensure that their employees are meeting complex disclosure requirements.
Generally, financial advisors must make sure that their “client advice” documents include proper disclosures to demonstrate that they’re working in their client’s best interests. These disclosures may cover conflicts of interest, commission structure, cost of credit, own-product recommendations and more. For example, advisors must clearly disclose the fact that they’re encouraging a client to purchase a position in a company that the firm represents (a potential conflict of interest).
To ensure compliance, firm auditors randomly sample these documents and spot-check them by keyword or phrase searches. But this process is clunky and unreliable, and the cost of failure is high: Some estimates put the price of non-compliance as high as $39.22 million in lost revenue, business disruption, productivity loss and penalties.
To help financial services firms ensure disclosure compliance, companies like FINRA Technology, Quantiply and my company offer AI solutions that use semi-structured data parsing to analyze client advice documents and extract all of the component pieces of the document (including disclosures). Then, using natural language processing to understand the meaning of the underlying text, the AI structures this data into an easily-reviewable form (like an Excel document) where human auditors can quickly evaluate whether all necessary disclosures were made. Where before an auditor might spend hours to review 1% of their firm’s documents, AI solutions like this empower the same person to review more documents in less time.
AI Fights Elder Financial Exploitation
$1.7 billion. That’s the value of suspicious activities targeting the elderly, as reported by financial institutions in 2017 alone. In total, the United States Consumer Financial Protection Bureau (CFPB) says that older adults have lost $6 billion to exploitation since 2013. One-third of these people were aged 80 or older, some of whom lost more than $100,000.
Thankfully, tech companies and financial institutions are fighting back. The CFPB notes that “Regularly studying the trends, patterns and issues in EFE SARs [Elder Financial Exploitation Suspicious Activity Reports] can help stakeholders enhance protections through independent and collaborative work.” This is a great opportunity for machine learning and AI, which use reams of historical data to predict what is likely to happen next.
Wells Fargo, for example, uses machine learning and AI to identify suspicious transactions that merit further investigation. Ron Long, director of elder client initiatives for Wells Fargo Advisors, told American Banker earlier this year that their data scientists are constantly working to add new unstructured and structured data sources to improve their capabilities. “While a tool can’t replace human assessment,” he said, “machine-learning capabilities play an important part in our strategy to reduce the number of matters requiring a closer look so we can focus on actual cases of financial abuse.”
One example is EverSafe, an identity protection technology company founded in 2012, which draws on multiple data sources to train its AI. EverSafe places itself at the nexus of a user’s entire financial life, analyzing behavior across multiple accounts and financial advisors. This approach dramatically improves their AI’s ability to identify erratic activity or anomalous transactions. Eversafe’s founder, Howard Tischler, says he was inspired to create the company after his aging, legally blind mother was scammed multiple times, including by someone who sold her a deluxe auto club membership.
AI Adds A Crucial Competitive Edge In High-Frequency Trading
Back in the 1980s, Bloombergbuilt the first computer system for real-time financial trading. A decade later, computer-based high-frequency trading (HFT) had transformed professional investing. Some estimates put HFT at 1,000x faster than human-human trading. But since the 2010s, when trading speeds reached nanoseconds, industry leaders have been looking for a new competitive edge.
To keep up with (and ahead of) the competition, industry leaders are turning to algorithmic trading. The sheer volume of trading information available for machines to analyze makes artificial intelligence and machine learning formidable tools in financial marketplaces. Investment firms use AI to increase the predictive power of the neural networks that determine optimal portfolio allocation for different types of securities. In simpler terms: Data scientists use reams of historical prices to train computers to predict future price fluctuations.
AI has already proven its value in HFT. Renaissance Technologies, an early adopter of AI, boasted a return of 71.8% annually from 1994 to 2014 on its Medallion Fund (paywall). Domeyard, a hedge fund, uses machine learning to parse 300 million data points in the New York Stock Exchange, just in the opening hour. And PanAgora, a Boston-based quant fund, deployed a specialized NLP algorithm to quickly decipher the cyber-slang that Chinese investors use on social media to get around government censorship. These findings give PanAgora, a firm that operates at the speed of fiber optic cables, vital insights into investor sentiment fast enough to keep up with (and influence) its trading algorithms.
Wrapping Up: Tempering Expectations For AI In Financial Services
The value of AI in financial services is clear. But don’t get lost in the hype. For every useful AI system, you can find a dozen problematic algorithms and large-scale failures. To succeed, keep a realistic perspective of what AI can and can’t do to help.
The truth is that artificial intelligence is just a tool. Alone, AI doesn’t really “do” anything. What matters is how you combine AI with other technologies to solve a specific business problem.
Most brands are keenly interested in creating experiences that move their customers on an emotional level—the trick lies in figuring out which factors companies can and should wield to elicit that response from the individuals they seek to serve.
Most brands are keenly interested in creating experiences that move their customers on an emotional level—the trick lies in figuring out which factors companies can and should wield to elicit that response from the individuals they seek to serve.
Experience outcomes have a lot to do with all the usual elements, like brand professionalism, but they also have everything to do with how customers feel before, during, and after an experience. Companies can only do so much to manage customers’ feelings, of course, but that does include evaluating how those individuals feel as they share experiences and using that feedback to make meaningful changes.
Empowering Staff & Processes with New Intelligence
Method #1: Identifying Customers’ Emotional State(s) of Mind
As we mentioned, companies can’t control customers’ emotions, but they can gauge how those individuals feel before and after an experience. Whether it’s via a quick post-purchase survey, social media, or other listening tools, organizations can easily learn not just how their customers are feeling, but also how those feelings inform their decision to come to the brand for a specific need and what their impression is after the interaction.
This information is invaluable for meaningfully changing and/or improving experiences, and gives brands a real shot at better managing customers’ emotions as they interact with the organization. Of course, it should also mean a better experience for all parties involved.
Method #2: Evaluating Emotions’ Impact on KPIs
This one probably goes without saying, but it really can’t be understated how large an impact customer emotion has on KPIs. A customer who’s made to feel angry, for example, probably isn’t going to do wonders for a brand’s retention or cross-sell/upsell KPI. Brands should thus always view KPI improvement through the lens of customer emotion.
This topic connects heavily to the idea of meaningful experience improvement as well. The most transformational process changes can ripple through an entire organization from the bottom up—a better experience occurs, customers become happier, and all the best KPIs light up as a result of the positive emotions that experience improvement instills toward the brand.
Method #3: Shifting Customer Emotions
This point definitely forms a Venn diagram with our first method, but the idea of shifting customer emotions during an experience really deserves its own bullet. Brands shouldn’t restrict their emotional evals to seeing how customers feel before and after an experience—they should also evaluate what can be done to elicit positive emotions (and quash negative ones) in the midst of customer interactions with a brand.
This lens affords customer experience (CX) practitioners a chance to tweak experiences in truly meaningful ways and can be thanked for conventions such as, say, auto dealerships offering customers coffee while they wait for repairs. Likewise, every experience a brand provides should also be thoroughly evaluated for pain points, bottlenecks, and other broken touchpoints that risk upsetting customers. Brands that find and fix these areas will have shifted their customers’ emotions mid-experience, which is powerful.
Method #4: Empowering Staff & Processes with New Intelligence
To expand upon the point made at the end of the last section, knowing how customers feel only really means something if brands execute on those emotions. It also means that companies shouldn’t confine that execution to a CX or customer-facing team. In fact, why not share those learnings throughout the business? Even teams who work far from the frontlines usually have something to do with providing a great experience, and should thus be let in on new learnings.
Finally, as we already talked about, process fixes are a must once companies have learned how experiences make their customers feel. Besides, actual fixes are really the only way that brands can create emotionally moving experiences for their customers in the first place. Using these methods as an improvement taxonomy can help any brand actually reach that goal.
Delivering promises is one of the most important things a brand must do for its customers. Keeping commitments is much easier said than done, but customer loyalty lives and dies by companies’ ability to follow through.
Delivering promises is one of the most important things a brand must do for its customers. Keeping commitments is much easier said than done, but customer loyalty lives and dies by companies’ ability to follow through. Succeed, and the brand generates loyalty and retention. Fail, and the organization ends up burning bridges—potentially permanently.
So, how can brands avoid breaking promises? Well, as I outline in my recent POV on this subject, one of the ways that companies can ensure that they consistently fulfill customer obligations is to create realistic brand promises in the first place. Here’s how brands can do that.
Know Your Customer
Brands should always evaluate the promises they make through a customer’s lens. That means knowing who their customers are, what they consider to be important, what they’re looking for in an experience, and why they come to you for it. This notion is sometimes referred to as the customer’s “moment of truth” and a brand has fulfilled a promise in their eyes when it delivers that moment consistently.
To many customers, the difference between failing to keep a promise and failing to deliver on a moment of truth is miniscule. In my aforementioned POV, I talk about how a colleague of mine experienced an especially brutal broken promise: an airline flight that didn’t uphold its promised anti-COVID safety measures. Not understanding the moments of truth is one thing; understanding and then failing to deliver can be a deal breaker. Additionally, depending on the severity of the problem, some customers will not give brands a second chance.
Delivering The Goods
Companies need to clearly understand what their customers want so they can both rise to the challenge and ensure that they deliver flawlessly on that desire. Brands can increase their likelihood to succeed by building a customer experience (CX) program as part of their business operation. A decent CX program can make brands aware of customers’ wants and needs—a great CX program unites customer, employee, and marketplace perspectives to give companies a continuous, 360-degree view of the experience(s) they provide.
This approach gives brands the opportunity to know what their customers value, so they can create grounded, realistic promises that can be delivered every time. If nothing else, it’s always better to underpromise and overdeliver than to overpromise and underdeliver.
Brands that take this tack will be positioned to create not just good promises for their customers, but the right promises. Companies that pick the right brand promises and deliver at the moments of truth create customer loyalty and a stronger bottom line for themselves.
Want to learn more about the importance of creating and keeping effective brand promises? Take a look at my article on the subject here.
Unanticipated costs can quickly become the bane of any business project, customer experience (CX) or otherwise, if they’re not carefully considered before pens have been put to paper. It’s thus imperative for CX practitioners who want to pitch their programs to anticipate and prepare for unexpected costs as much as possible.
Unanticipated costs can quickly become the bane of any business project, customer experience (CX) or otherwise, if they’re not carefully considered before pens have been put to paper. It’s thus imperative for CX practitioners who want to pitch their programs to anticipate and prepare for unexpected costs as much as possible.
We’ve listed the three most effective considerations that practitioners can use to anticipate and avoid unexpected experience program costs:
Vendor Scalability
Vendor Flexibility
Nonparticipation Costs
Factor #1: Vendor Scalability
This tip may seem gratuitous, but program scalability actually isn’t considered as often as it should be, and brands can end up paying extra for that mistake. Practitioners can avoid a lot of headaches with their own teams, the C-suite, and the accounting department by selecting an experience partner that can scale programs from the very beginning.
This approach enables brands to select and begin a program that grows alongside both their CX accomplishments and aspirations. It also allows organizations to reduce operating costs from the very beginning, which can result in both a much healthier program and a CX budget that always stays in the black. CX practitioners can use this method to strive for an ambitious program while still avoiding unanticipated costs.
Factor #2: Vendor Flexibility
Though picking an experience partner and implementing its capabilities is no small task, the days of rigid, prepackaged experience programs are drawing to a close. This is great news for businesses because they can now work with vendors to create a versatile experience solution instead of attempting to wrap themselves around an unflinching list of features (many of which a given company may not actually need).
Solution flexibility enables CX practitioners to avoid unanticipated costs by paying only for what they need from a vendor. For example, would your brand benefit from an analytics team or does that capability already exist within your organization? What about a self-service approach versus full management from the vendor? Once practitioners consider these questions, they should select a partner that’s flexible enough to meet their needs without showering them in unneeded extras and—you guessed it—unnecessary costs.
Factor #3: Nonparticipation Costs
There’s another element to cost consideration that often goes, well, unconsidered when brands talk about implementing an experience program, and that’s what happens when companies don’t have such an initiative in place.
Feedback collection, experience improvement, and customer centricity are all more important now than ever before. These ideas are the means by which brands can both create a better experience for customers and use that capability to plant a flag at the top of their vertical. Therefore, brands should consider the very real opportunity cost of not collecting, analyzing, and implementing feedback. An experience program isn’t a luxury anymore—it’s non-negotiable for any company that wants to succeed.
Taken together, these three methods can empower brands and the experience practitioners who work for them to avoid unanticipated costs and keep their programs viable. They can then use their programs to achieve what we just talked about: a meaningfully improved experience for customers and thus a more commanding presence in their marketplace.
Proving experience programs’ worth isn’t easy, but it needn’t be the bane of CX practitioners’ existence. In fact, we’ve discovered three ways to convince the C-suite that experience programs are much more than just a garnish.
It’s not uncommon for organizations to consider customer experience (CX) programs a nicety—something powerful, no doubt, but also just a luxury instead of an essential component of business success. This attitude prevails even as today’s marketplaces become more competitive and the COVID-19 pandemic changes customer wants and needs faster than many brands can keep pace with.
As we outline in our recent paper on this subject, proving experience programs’ worth isn’t easy, but it needn’t be the bane of CX practitioners’ existence. In fact, we’ve discovered three ways to convince the C-suite that experience programs are much more than just a garnish. These three methods are:
Aligning Capabilities With Strategic Objectives
Pitching Customer Centricity
Demonstrating The Power of Real-Time Feedback
Method #1: Aligning Capabilities With Strategic Objectives
As we just mentioned, marketplaces and industries are all becoming more competitive, which means that brands must strive to provide the best customer experience possible if they hope to stand out. The specific goals that businesses put forth to accomplish that vary wildly from industry to industry, but there’s one common denominator here: CX capabilities that enable these goals can take a company all the way to the top.
With that in mind, CX practitioners who want to prove the necessity of their programs need to select software that can enable business objectives. A lot of organizations take this to mean that CX software is useful only for measurement. Measurement is important, of course, but the best technology empowers brands to execute something much more important than measurement: action. A brand’s ability and willingness to take action on CX learnings determines whether that organization is a transformative leader, or a follower that’s content with management.
Method #2: Pitching Customer Centricity
This tip may sound too general, maybe even like it’s a Herculean task, but consider that the organizations that do best within their verticals are the ones that effectively disseminate CX learnings throughout the business rather than leave statistics siloed up with an experience team. CX practitioners can pitch their programs by pointing to this example and encouraging their organizations to follow suit. All it takes to create a culture of customer centricity is desiloing CX intelligence and handing it out to the right departments and stakeholders.
This approach has another advantage in that it can help CX practitioners create grassroots support for their initiatives. Creating customer centricity can help employees become more invested in their work and more strongly feel that it matters. Their own insights and feedback is also an invaluable component of any CX initiative, and collecting it can make them feel heard. With this approach, practitioners can ride a groundswell of bottom-to-top support all the way to the boardroom.
Method #3: Demonstrating The Power of Real-Time Feedback
This tip overlaps somewhat with the first method we talked about, but the power of real-time feedback truly deserves its own special mention. Real-time feedback is the only truly effective way for brands to know which customers are promoters and which are detractors, enabling them to both save at-risk customers and identify the themes common to both groups’ view of the business.
Real-time feedback also empowers brands to achieve four business goals that practitioners can use to further assert their programs’ value. These goals include acquiring customers, retaining existing ones, cross-selling or upselling to established customers, and lowering cost to serve. Practitioners who pitch real-time feedback through this paradigm can both better tie it to financial goals and give the C-suite something more specific to chew on than, say, “becoming more customer-centric.”
These three strategies are effective means of introducing or ensuring the longevity of CX programs at any brand, and can help CX teams make the case that experience initiatives are no mere flight of fancy but rather the key to transformational success in today’s business world.
Tying experience program results to improved outcomes often proves to be the most challenging aspect of running an experience program, especially since stakeholders usually express at least a little skepticism alongside all the buy-in. Luckily, there are several tried-and-true metrics that practitioners can track to justify ROI.
If you’re a practitioner who won support for your B2B experience program and have since implemented it across your organization, congratulations! Garnering sponsorship for experience programs is not easy, but doing so means that you’ve built trust at and received investment from both the frontline and executive levels.
Now comes the hard part: proving results and justifying ROI.
Tying experience program results to improved outcomes often proves to be the most challenging aspect of running an experience program, especially since stakeholders usually express at least a little skepticism alongside all the buy-in. Luckily, there are several tried-and-true metrics that practitioners can track to justify ROI, and we’re going to hit them all right now:
Customer Acquisition Growth
Customer Retention & Recovery
Upselling Established Customers
Profitability From Lowered Costs
Metric #1: Customer Acquisition Growth
This is one of the biggest goals that most brands set for their experience programs, which makes it a vital metric for practitioners to keep track of as their initiatives take off. Acquiring new customers is neither simple nor cheap, and if there’s one group of stakeholders who constantly bears this fact in mind, it’s the C-suite.
Tracking customer acquisition is thus a must for any B2B experience program. Doing so demonstrates an experience program’s merit to all stakeholders involved, especially since, as we just mentioned, acquiring new customers is no small task. Experience platforms that can track changes and monitor new growth are especially useful here since they make proving acquisition relatively straightforward.
Metric #2: Customer Retention & Recovery
There are two big reasons why customer retention is a powerful and pertinent B2B experience metric: first, retaining customers is far cheaper than acquiring new ones, and second, most brands begin experience programs to, well, improve experiences for their existing customer base. Experience practitioners can prove their programs’ effectiveness at hitting both goals by tracking customer retention and recovery.
There’s a myriad of ways to demonstrate experience initiatives’ value when it comes to customer recovery. For example, these programs often make it simple for practitioners to survey customers who reach out to contact centers, garner feedback, and turn it into actionable intelligence. That intelligence can then be used to meaningfully improve both call center processes and customer retention along with it. All of those metrics can be tied directly to experience programs.
Method #3: Upselling Established Customers
Retaining existing business is great, but many B2B brands set their sights on a more ambitious goal: increasing their share of wallet with their established customer pool. The tools, improvements, and processes afforded by experience programs make this goal possible, and practitioners can and should tether the improvements brought about by their efforts to any increase in share of wallet.
Practitioners commonly use experience programs to upsell existing customers by honing in on those individuals’ needs and wants. They can also use these programs to call upon a backdrop of operational and financial data, which grants B2B organizations a 360-degree view of who these individuals are. Practitioners and customer experience (CX) teams can then identify and act upon upsell opportunities.
Method #4: Profitability from Lowered Costs
This ROI metric can be less flashy than sporting new customers or increased share of wallet from existing ones, but the C-suite loves it no less.
In addition to providing meaningful experience improvement opportunities, a well-run experience program can help brands identify ways to eliminate waste and save costs. Experience practitioners can establish their programs’ value by showing stakeholders such opportunities as their initiatives reveal them, giving B2B organizations the chance to save money while also being empowered to improve experiences. To put it candidly, nothing screams “value” to an organization quite like increased profitability.
Acquiring sponsorship for an experience program isn’t easy. Harder still is proving that program’s worth. However, practitioners who focus on proving their programs’ worth through these four lenses will have a markedly easier time actually doing so. They can then secure additional resources to expand their programs’ scope and reap additional success for themselves, the B2B brands they serve, and the customers who sustain those organizations.
Learn more about B2B experience programs, proving ROI, and creating continued success here.


 When you call into their MID, operators use a
  The human brain is terribly complicated, and two people may experience the same condition in vastly different ways. This is especially true of conditions like Attention Deficit Hyperactivity Disorder (ADHD). In order to optimize treatment, physicians need to understand exactly how their individual patients experience it. But people often tell their doctor one thing, and then turn around and tell their friends and family something else entirely.
 The above applications of text analytics in healthcare are just the tip of the iceberg.