We are all competing in the End User Era now.
Investor Blake Bartlett coined the term “End User Era” to capture an important shift that is happening on an organizational level across industries: “Today, software just shows up in the workplace unannounced. End users are finding products on their own and telling their bosses which ones to buy. And it’s all happening at lightning speed.”
Companies like DocuSign, Slack, Zoom, and Hubspot are examples of SaaS companies that are thriving in the End User Era. Their success is rooted in products that end-users love. Product Led Growth codifies this end user-focused growth model. PLG relies on the product itself as the primary driver of customer acquisition, conversion and expansion. This approach goes all-in on end user ease and productivity to drive growth, and is a radical shift away from the acquisition growth model so familiar in the software industry.
Customer experience (CX) metrics have an important role to play in this strategy—something we explored in-depth in a previous post: Customer Experience in the Era of Product Led Growth.
Customers Will Tell You Where Your Product Led Growth Bottlenecks Are
Metrics are essential to understanding progress on the product led growth curve. Typically the PLG model evaluates business and pipeline health based on user actions (clicks) and subscription revenue.
This is where CX metrics are so valuable. Voice of customer data illuminates the “why” behind the clicks and the cash. Classic CX surveys like NPS, PSAT, CSAT, and Customer Effort Score(CES) monitor customer sentiment—providing critical insight into behavioral and revenue metrics.
By analyzing the open-ended comments that accompany the rating-scale questions you can identify positive and negative themes in what customers are saying. Based on what you learn, you can confidently prioritize improvements to your product that will remove bottlenecks, the enemy of PLG success.
At the core, product led growth is about taking tasks that would traditionally be done manually and putting them into the product to create efficiency and a better customer experience. Step back and map out all of the steps in your funnel from acquiring an initial lead all the way through to turning that lead into a paying customer who sees value in the product. Where are the bottlenecks?
How do you know where your bottlenecks are, and whether you are eliminating them?
Let’s explore each metric to understand how it can help you identify and address bottlenecks, with real-world examples from our customers.
Net Promoter Score (NPS): Loyalty and More
Net Promoter Score (NPS) surveys ask customers to evaluate how likely they are to recommend your product or company to a friend or colleague, this “propensity to refer” is an excellent predictor of future growth.
Unlike the other metrics covered here, which are flexible and easily customizable, true NPS surveys follow a very specific format when it comes to asking the first (of two) questions. By asking that first question in a specific way, using a standard scale, companies can compare their NPS scores to industry benchmarks. The second question, which gathers qualitative data regarding improvement opportunities, can (and often should) be customized.
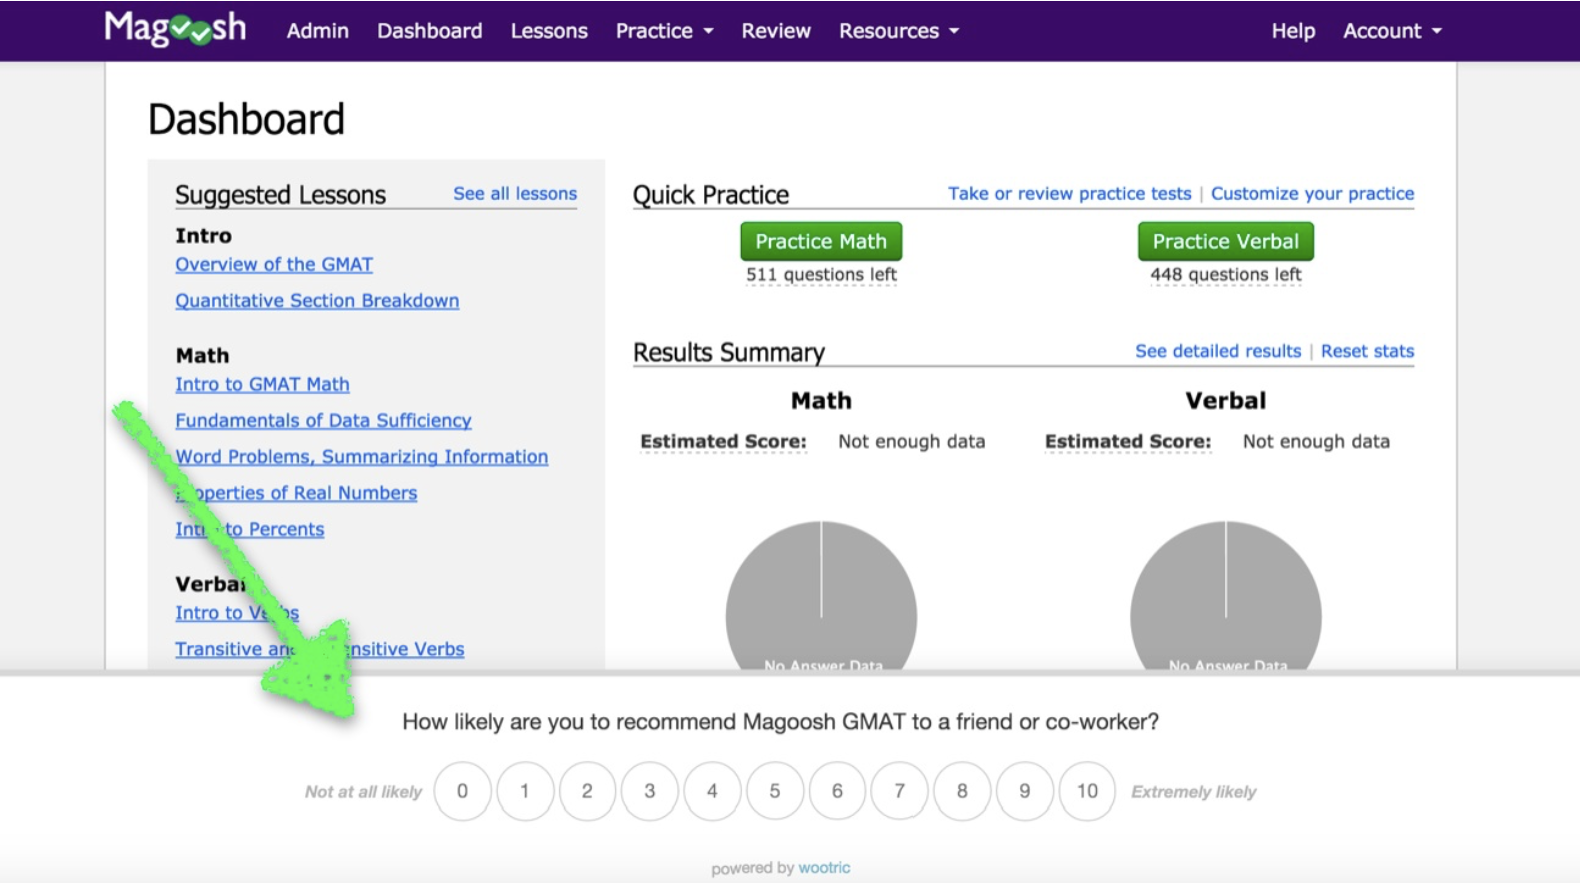
NPS Surveys ask two questions…
- Question #1: “How likely are you to recommend this product or company to a friend or colleague on a scale of 0-10?”
- Question #2: “What can we improve about this experience?” (if they rated you 0-8) or “What did you love about this experience” (if they rated you a 9 or 10).
The first question allows you to calculate your Net Promoter Score, which is a number between -100 and +100 and serves as a benchmark for progress. For detailed information on how to calculate NPS, and what the number really means, take a look at our Net Promoter Score post.
The second NPS survey question is just as important, if not more so, than the score itself because this qualitative data tells you what you need to do to improve end user experience.
Why is NPS key to Product Led Growth? Traditionally viewed as an indicator of growth (as mentioned above), NPS is also a crystal ball when it comes to retention. NPS gives you a glimpse into the minds and hearts of your end users. It can provide a constant stream of feedback about bottlenecks and that will help you create products that enable the ease and productivity you are going for.
In short, NPS captures what’s most important to users, whether it’s documentation, training, or aspects of the product itself. NPS is typically the foundation of any CX program, and since you don’t want to get overwhelmed in the beginning, there’s nothing wrong with making NPS your sole CX metric at this stage.
NPS Example: DocuSign
![]()
DocuSign uses NPS to gather feedback on product features and pinpoint any bottlenecks in the experience. They achieve this by customizing their NPS follow-up question (the one that asks users to explain their score). In the in-app survey pictured below, Docusign asks “Tell us about your experience sending an envelope.”

Guneet Singh, Director of CX at DocuSign, believes that regardless of which metric you use, it’s vital to understand how customers feel about your product at key points in their journey. In other words, don’t wait to conduct an annual survey—gather continuous data and refine your product based on that feedback.
Customer Satisfaction (CSAT): Because Support Is a Bottleneck
Customer Satisfaction (CSAT), like NPS, is another metric you can use at various points in the customer journey. The classic use case for CSAT is following up on a support interaction, where you can ask customers about their experience:
- Solving their specific problem
- Working with a particular CS agent
- Working with your company in general
CSAT surveys can use a scale ranging from “very satisfied” or “very dissatisfied,” often followed by a question that asks the user to share the reason behind their score.
What makes this touchpoint so vital from a PLG perspective? Support calls, by definition, are a point of friction—nobody contacts customer support when things are going right.
Product Led Growth endeavors to eliminate support interactions altogether. When was the last time you reached out to customer support at Slack or DocuSign? Chances are, it’s never happened. That’s the seamlessness you’re going for.
This touchpoint is a rich source of insight into frustrations that customers face. Product teams that prioritize end user experience pay close attention to feedback from support as they improve product and design new features.
CSAT Example: Glassdoor
Glassdoor, the popular site for job listings and anonymous employer reviews, uses Customer Satisfaction surveys to gather feedback on support interactions. When a support case is closed in Salesforce, end users receive a personalized CSAT survey via email.
Carmen Woo, Salesforce Solution Architect and Senior Application Engineer, holds the cross-functional CX technology vision at Glassdoor. “What is intriguing about our use case is that we use machine learning to analyze feedback. Comments are tagged by topic themes and are assigned sentiment to capture the emotion behind the user’s words.
“The [InMoment] platform allows our Support team to segment feedback by agent and other relevant business drivers to uncover insights that contribute to optimizing our support function, and it can also reveal bottlenecks that are best addressed by improving product features or design,” says Carmen.

Product Satisfaction (PSAT): Adoption and Engagement Bottlenecks
PSAT surveys are highly flexible, and they can be structured the same way you structure Customer Satisfaction survey questions—asking customers to rate their level of satisfaction with a product using a scale from “very satisfied” to “very dissatisfied” (e.g., 1-3 or 1-5) or through a binary response (e.g., “happy face” or “sad face”).
PSAT surveys are best delivered within an app, when customers are using your product and can give you fresh, timely feedback. The customer sentiment derived from PSAT surveys is the necessary complement to behavioral metrics. Sure, you can see in the clicks that users are not adopting a feature, but why? PSAT helps to answer that question and guides optimization efforts.
PSAT Example: HubSpot

Marketers that use HubSpot, the popular CRM software, may recall responding to a Product Satisfaction survey when using a new feature for the first time. PSAT gives Hubspot immediate feedback on whether a new feature is delivering value to the end-user.
Even if you’ve done extensive user testing, getting feedback on a feature within the context of a user’s experience of the whole product is valuable. Is there friction? Should the feature be tweaked in some way?
This approach, which is a key aspect of lean UX design, ensures you don’t go too far down the rabbit hole with a product feature that sounded great in theory but didn’t serve your end-users in the real world. New features can bring complexity — the bain of end user ease. By continually asking for feedback in-product, you can better calibrate that balance and maintain a frictionless, easeful end-user experience.

Customer Effort Score (CES): Identify Bottlenecks in Onboarding
A seamless onboarding experience is key to widespread adoption. If end-users have to work too hard to get up and running, they’ll give up and try a competitor’s product. Even if you have an enthusiastic champion within a company, if they have to prod others to adopt or spend time convincing them of your value, their own enthusiasm will wane. As such, it’s important to evaluate how much effort end users must put into getting started.
Customer Effort Score (CES) asks how difficult it was to accomplish a given task using a predefined scale (e.g., 1-7 or 1-5). Here is an example of a CES survey:

CES surveys are frequently used to follow up on support calls, but they’re also extremely valuable when evaluating the onboarding experience. Success teams know that the seeds of churn can be sown in the onboarding phase. They have been using feedback from CES surveys to both (1) follow up with that customer to fix the problem and (2) develop tasks and processes that will prevent future customers from experiencing the same bottlenecks.
However, in the context of PLG, addressing onboarding feedback isn’t just the domain of the Success or Support team. It is vital input to UX teams that seek to eliminate tasks that would traditionally be done manually and put them into the product to create efficiency and a better customer experience.
CES Example: Watermark
Watermark is in the EdTech space, and they’ve taken a comprehensive approach to optimizing user experience. Here’s how they do it, starting with Customer Effort Score surveys.
Watermark has a complex onboarding and training process, so they gather data at the end of each of three phases of training using CES surveys. The feedback goes to the implementation and training teams to both (1) improve the process and (2) identify customers who may need extra support. Then, of course, they look for larger trends and modify their onboarding experience accordingly.
Watermark also measures NPS & CSAT. NPS is measured across six product lines, and Watermark studies the correlation between NPS and renewals. Higher NPS scores predict a greater likelihood for renewal, and improving products based on NPS survey results is key to Watermark’s customer retention strategy. CSAT surveys, triggered from Salesforce Service Cloud when a case is closed, help to evaluate and improve Customer Support.
And as Dave Hansen, the CX champion at Watermark, points out, they dig into the data to identify points of friction. “The feedback we’re getting tells us that there isn’t necessarily an issue with our overall solutions,” says Dave. “You may have issues running a certain report, or you may have issues with the way you have to click through to something.”
Product Led Growth Strategy Is About End User Experience
The four CX metrics covered in this post (NPS, CSAT, PSAT, and CES) offer insight into end user experience and augment behavioral data with the voice of your customer.
Remember, don’t allow scores to be your sole focus. There is gold in the open-ended feedback you receive. Without analyzing the open-ended feedback you receive, the metrics are just benchmarks that you’ll aimlessly try to identify bottlenecks through guesswork. In the end, that won’t get you very far.
Product Led Growth is all about creating a smoother experience in the moments that matter. CX metrics and voice of the customer comments help technology companies do just that.
Get the ebook, “CX FOR EVERY STAGE: How to Scale Your Voice of Customer Program from Startup to Enterprise.’ Learn how to improve user experience for product led growth and loyalty.