Surveys are not dead.
You can find a lot of articles, point-of-views, or CX pundits on social media preaching that the survey is dead. Admittedly, we here at InMoment tell our current and prospective clients that they may be focusing too much on surveys and that less than 10% of their customer feedback is likely to come from surveys. An IDG stat says unstructured feedback is growing at 85% year over year which also threatens the value of traditional score-based surveys.
All this being said, the survey is not dead. As a matter of fact, it isn’t going away any time soon. And, I hope it never does! Surveys still present a unique opportunity to have a 1:1 conversation with your customer. And, to illustrate our support for this concept, we’ve developed some ‘Survey Bumpers’—much like the rails in bowling—to help guide you toward crafting a survey that achieves a ‘strike.’ These tips are designed to ensure that your survey stays on track to hit all the right points and maximize its effectiveness in a world where the reality is that surveys may no longer represent the lion’s share of feedback. However, they are still a critical part of what we refer to as an integrated customer experience.
Survey 101
Before we dive into the survey bumpers, let’s recap surveys as a whole. When it comes to surveys, they can all generally fall under two categories: Transactional and Relationship. To be honest, I still talk to prospects (not as many clients) who don’t always understand this difference.
Transactional surveys are typically conducted following a specific transaction or interaction between a customer and a company. The primary goal of transactional surveys is to gather feedback on the customer’s experience during that specific interaction – or as we like to say (tongue in cheek) in the moment. They are often used to assess satisfaction levels, understand the ease of doing business, identify areas for improvement, and address any issues or concerns in real-time.
Relationship surveys, on the other hand, focus on measuring the overall satisfaction and loyalty (to the brand and the products) of customers over a longer period. Rather than targeting a single transaction, relationship surveys aim to understand the broader relationship between the customer and the company. These surveys typically cover various touchpoints and interactions across the customer journey over a longer period, providing insights into overall brand perception, loyalty, and advocacy.

For many companies, relationship surveys rely on the Net Promoter Score (NPS) as the primary metric. This can help them understand several factors including the customer’s likelihood to recommend or repurchase, and overall satisfaction with the brand.
Understanding the basics of surveys is important to know before moving on to survey design. While the designs of surveys may vary from one to the other, the fundamentals of surveys will always remain the same.
What Is Survey Design?
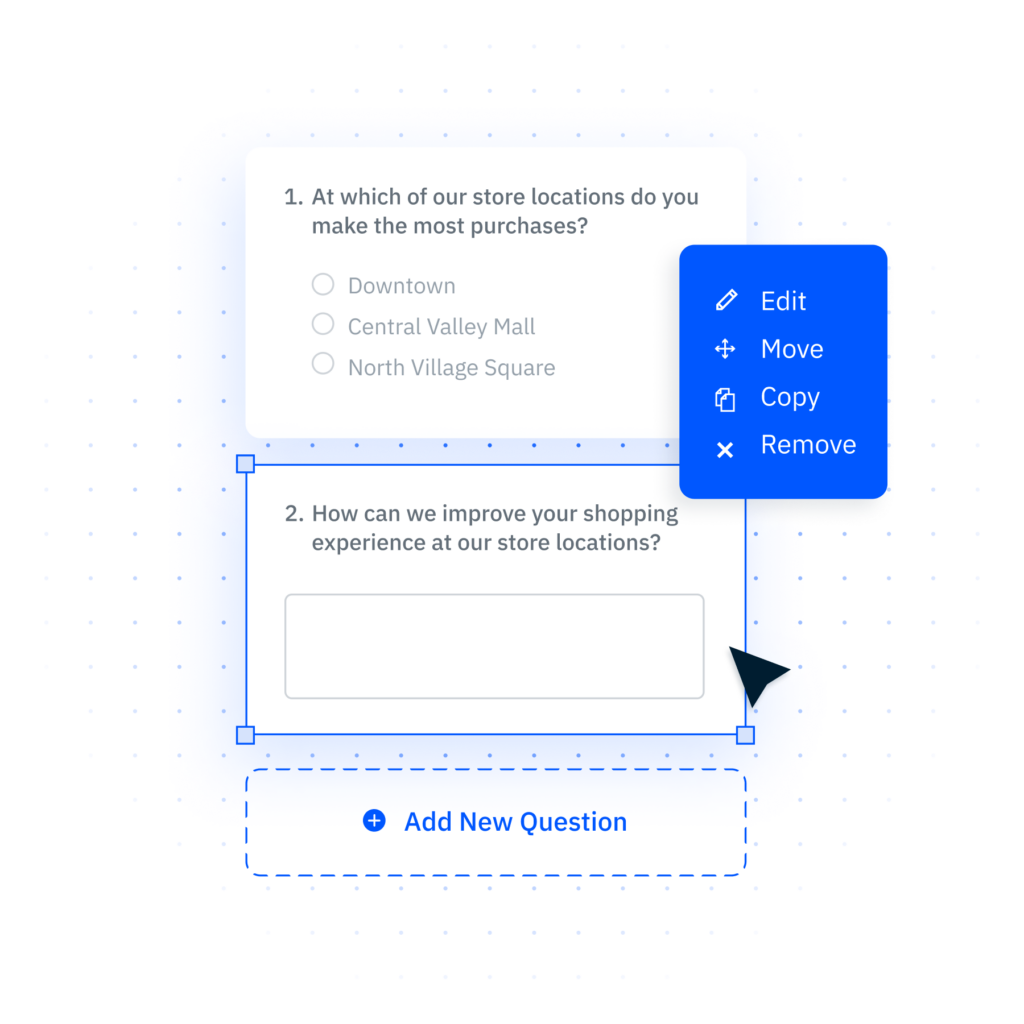
Survey design is the detailed process of creating surveys that optimize the potential results that can be collected from a well-made questionnaire. Decent design takes into account the kind of questions, the quality of questions, the flow and organization of the survey, and the possible biases or conflicts of both questions and participants.
Though creating a questionnaire may seem simple at first, it can be a complicated and tedious process. Questions can be asked in different ways, both in form and language. How much context or detail is provided can sway a participant’s opinion. What questions are presented first will likely influence the questions posed later in the survey, which can impact results.
How to Design A Survey
Outside of the types of surveys, we believe that every survey should have a “North Star Metric” to anchor on. This metric does not have to be the same for every touch point, but it should directly correlate with a business goal. Referencing my bowling metaphor from earlier, a survey with no goal is like bowling into a lane with no pins: pointless.
How Long Should a Survey Be?
When it comes to survey design, shorter is better. Your customers don’t want to take long surveys. Nobody does. Research shows that surveys that take just a few minutes to complete (4-7 questions max) have the highest percentage of completion rates. Not only should your survey be short, it should be targeted. All surveys, regardless of objective or format, should have the same structure of concise language, open-ended questions, and confirmation texts.
Concise, Inviting Language
Surveys should open with a brief introduction that is on brand and invites the users to complete the survey. For example, some common intros include:
- We want to hear from you
- Tell us how we did
- Your feedback is important to us
Regardless of the approach you choose, the user should immediately feel like their feedback is valuable and will be used to direct business decisions, not just improve a score.
Open-Ended Question
One of my biggest survey design peeves is the “conditional” open end that is based on a good score (“Great – tell us what was awesome”) or a bad score (“Sorry we failed you”). We want our clients to get both sides every time they survey. To do that, you need to pose a question that allows the user to explain the good and the bad from their recent experience. An example of this would be:
- “Please tell us why you gave that score including what wowed you and where we need to improve.”
Confirmation Text
Whenever a survey has been submitted, make sure you add a step in your workflows that thanks the user for their time. In this step, being short, sweet, and on-brand is key. Just extend a small gesture that shows the user they have completed the survey process. An example might look like this:
- “Thank you for taking the time to share your feedback. We use this feedback to improve our products, service, and experience.”
Survey Design Best Practices
Now that we have the basics covered, let’s dive into a few survey bumpers that will lead you toward gathering insights – not just completion rates. These survey bumpers are aimed at outlining a strategy centered around business improvement. Rather than sending a survey for the sake of sending it, this strategy will help you achieve data that can be used, not just analyzed and archived. We want to pick up the spare – not leave the 7-10 split.
Design with the End in Mind
Before you start this process, you need to establish your objectives, goals, and desired outcomes. This foundational step lays the groundwork for a strategic approach to survey design, ensuring that every question and element serves a purpose in driving toward a measurable business outcome. By clearly identifying measurable outcomes, your survey will have a much better probability of capturing insights that you can turn into actions. By answering these questions, you will have a clear understanding of the goal of your survey:
1. What business problem(s) are you trying to solve?
Understanding the specific business problem(s) or challenge that the survey aims to address is arguably the most important part of this process. It helps define the scope of the survey, frame relevant questions, and ensure that the collected customer feedback directly contributes to solving the problem. Without a clear understanding of the problem, the survey will render itself useless. And, for anyone who works with me or has read my POVs, your business problem must have a financial lens. CX programs sustain and grow if they drive a financial return to the business.
2. Who will be the internal champions of the data?
As part of a program design discussion, the target customer personas will evolve based on what you are measuring and who you can contact based on the availability of data and accessibility to it. But, to me, the more important question to answer is who in the company will be accountable for taking action based on the insights captured by the survey. Another rule I try to follow is that every question needs to have an owner – someone who wants the customer’s voice to take measurable action toward a business. No owner or no goal? Don’t ask the question.
For example, if we offer a closed-loop system, is there a resource aligned to close the loop? Or, if our goal is to understand the ease of completing a purchase on our website, is there an e-commerce team leveraging the customer feedback?
3. What are you doing today? How are you measuring success?
Assessing the current state of the union within your organization provides context for interpreting survey results and evaluating the effectiveness of existing strategies. By understanding what your organization is currently doing, and whether or not it is achieving the desired results, can help identify areas of success and areas for improvement. Related to this, has the program been continuously updated to reflect changing team players and changing business conditions
4. Do people across the organization care about the score or the insights?
If the answer is the score – how do I say this nicely – I would suggest stepping back to see what role scores play in your CX strategy and what role they should play moving forward. If I can offer any wisdom it’s this: score-focused CX programs fail over time. Don’t let score trends paralyze modernization. To truly understand your customers and improve their experience, you need to care about the insights that come from these types of initiatives. And, broken record time, you need to be able to point to financial proof points from the actions taken.
Just to be clear, scores are a critical part of a survey program. Understanding the impact of elements of your product/service delivery as measured by customer scores is important. Culturally, scores can be a rallying cry across the business. Advanced financial models can show how scores impact the bottom line. My “parting shot” for this topic is to just make sure the scores don’t become the program’s primary success metric.
How to Design the Best Survey for Your Business
Now that we have our bumpers in place. Let’s get into the details of how your business can bowl that perfect game. These steps to survey design are designed to get your business the cleanest, most actionable feedback that can be combined with other omnichannel data to round out a complete view of the customer experience so you can start improving it.
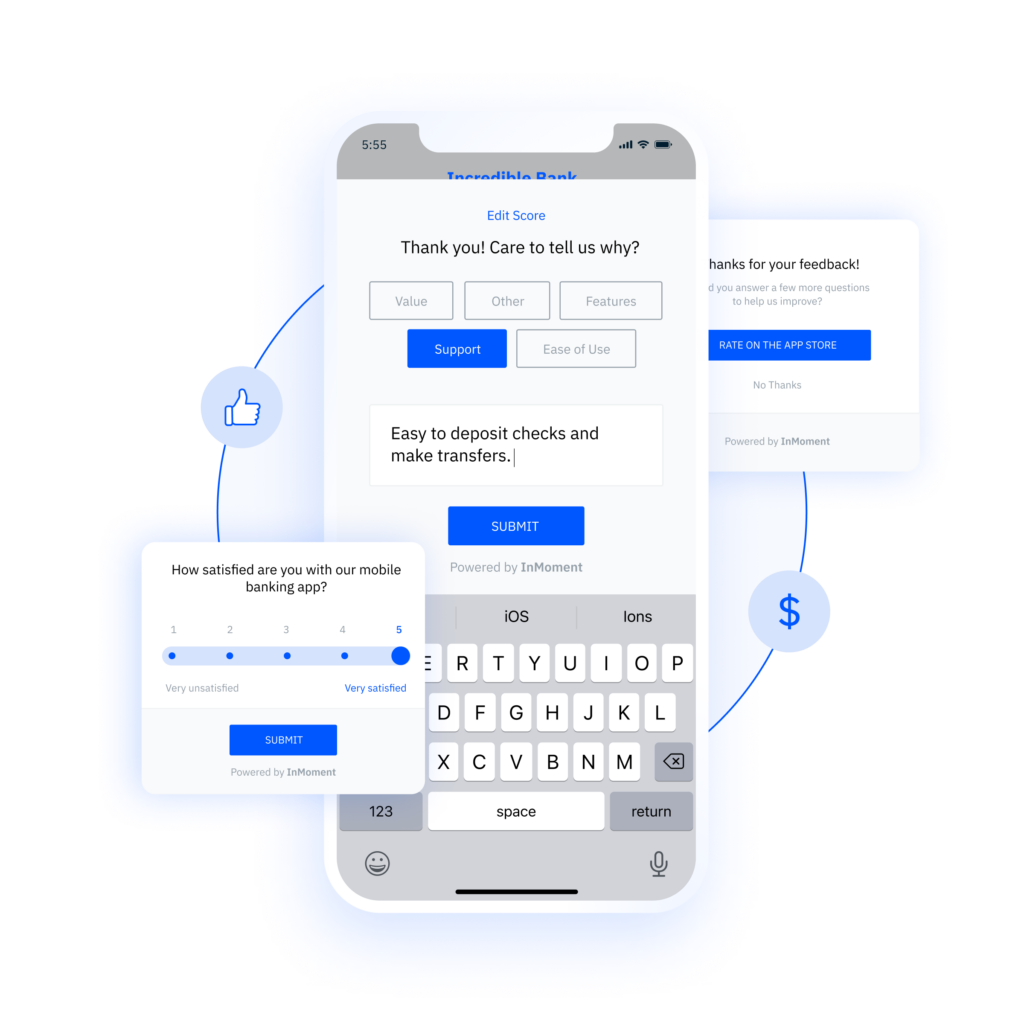
1. Ask the Main Metric Question First
Starting with the main metric question allows you to capture the customer’s overall perception without any bias from subsequent questions. This question – and metric – should tie to the business outcome you are trying to achieve.
2. Follow Up with A Non-Conditional Open Ended Question
Following up the main metric question with an open-ended question encourages respondents to elaborate on their initial response. Open-ended questions allow for more conversational and qualitative feedback that provides deeper insights into the reasons behind their initial answer. See the guidance earlier in this article about ensuring this question is unconditional.
3. Identify A Small Group of Business drivers Related to Your Problem
This step involves selecting a focused set of business drivers or factors that are directly relevant to the business outcome you are hoping to achieve. By narrowing down the scope to a small group of key elements, you can ensure that your survey remains concise and targeted, making it easier for respondents to provide meaningful feedback.
4. Offer to Follow Up
A recommended next step in this process is to offer to follow up or close the loop with the customer. Closing the loop is important because it demonstrates to customers that their feedback is valued and taken seriously. Research shows that when a company closes the loop with a customer, the customer is more likely to respond to subsequent surveys. It also allows you to save an at-risk customer if they have an issue you can fix. When customers see that their input leads to tangible changes or improvements in products, services, or processes, they feel heard and appreciated.
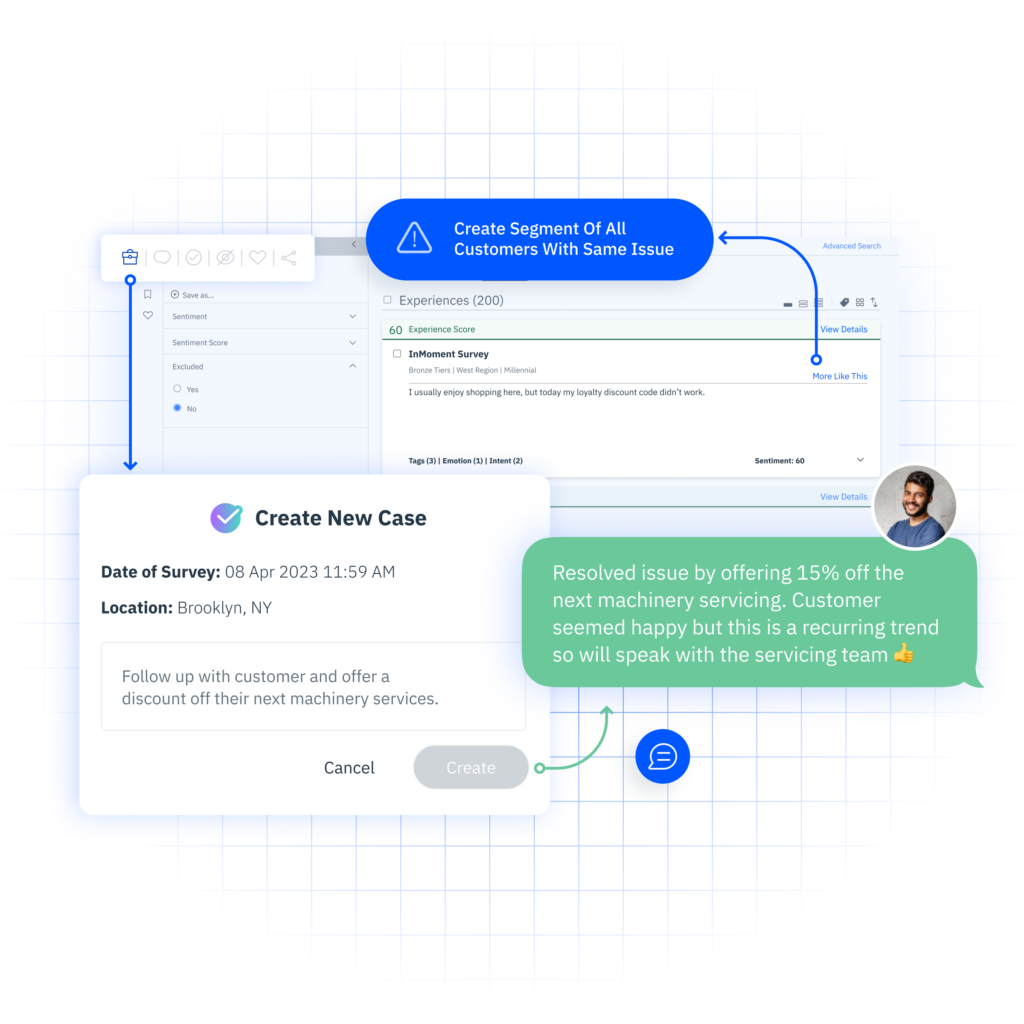
However, you should only offer to do this if you have the staff to support it. Otherwise, you are only hurting yourself and negatively impacting the customer experience.
5. Thank the Customer
Always end the survey by expressing gratitude to respondents for taking the time to participate in the survey. This step is important for fostering goodwill and encouraging future engagement. A simple thank-you message at the end of the survey acknowledges the respondents’ contribution and reinforces the idea that their feedback is valuable to the business. Even better, I worked with a client who used their “thank you” page to highlight a couple of changes they made as a direct result of their survey program.
The Future of Surveys with InMoment
To reiterate, surveys need to remain an important element of your customer listening strategy. While it is easy to say they are “dead,” the truth is that their role is simply evolving to fit the modern landscape of customer feedback. Rather than being viewed as the endpoint of customer feedback, we see them as the first rung on the ladder of an integrated customer experience program – the opening frame to go back to our bowling analogy.
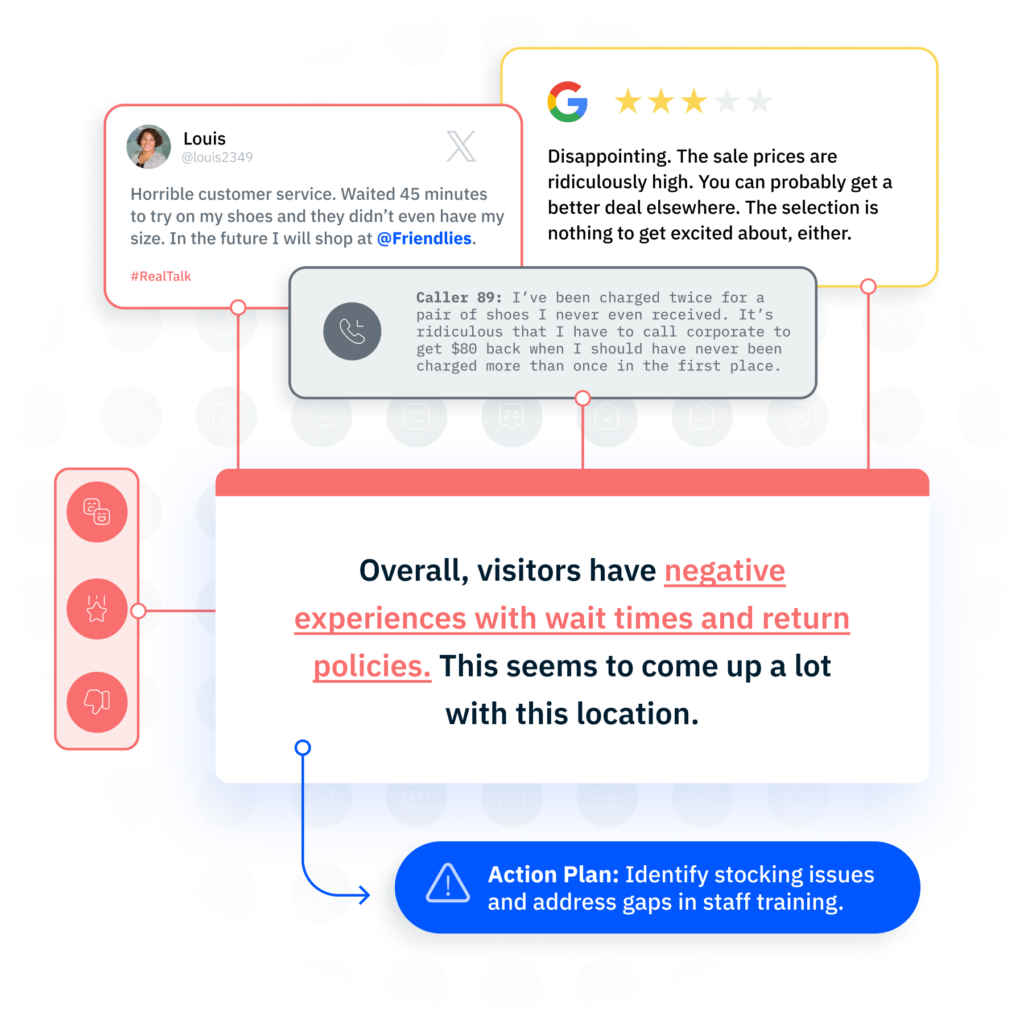
For them to continue to be useful surveys need to be integrated into a broader strategy that encompasses various feedback channels such as social media, online reviews, customer service interactions, and more. By building out an integrated customer experience program that brings in a wide variety of data sources, businesses can capture a more comprehensive understanding of the customer journey and tailor their strategies accordingly.
Think of this article as an InMoment PSA: Since surveys are still a vital channel to hear from your customers, you should make them the best they can be.
See how Barry Nash & Company partnered with InMoment to merge traditional survey data with text analytics and market research to develop groundbreaking research and reports for the entertainment industry!