Qualtrics acquires experience management leader Press Ganey Forsta, expanding the world’s largest human experience management AI & data platform.
|
Read more.
In our recent virtual panel discussion, we explored how different financial firms are embracing the Consumer Duty Act and identified areas where most of their resources have been designated. The panelists engaged in insightful discussions, sharing their organisational challenges and best practices, while attendees were to engage in polls aimed at answering three key questions on preparedness, challenges, and changes related to Consumer Duty.
And because at InMoment, we value sharing knowledge as widely as possible, I’m going to share the results of that in-event poll with you here, along with a few thoughts about our learnings.
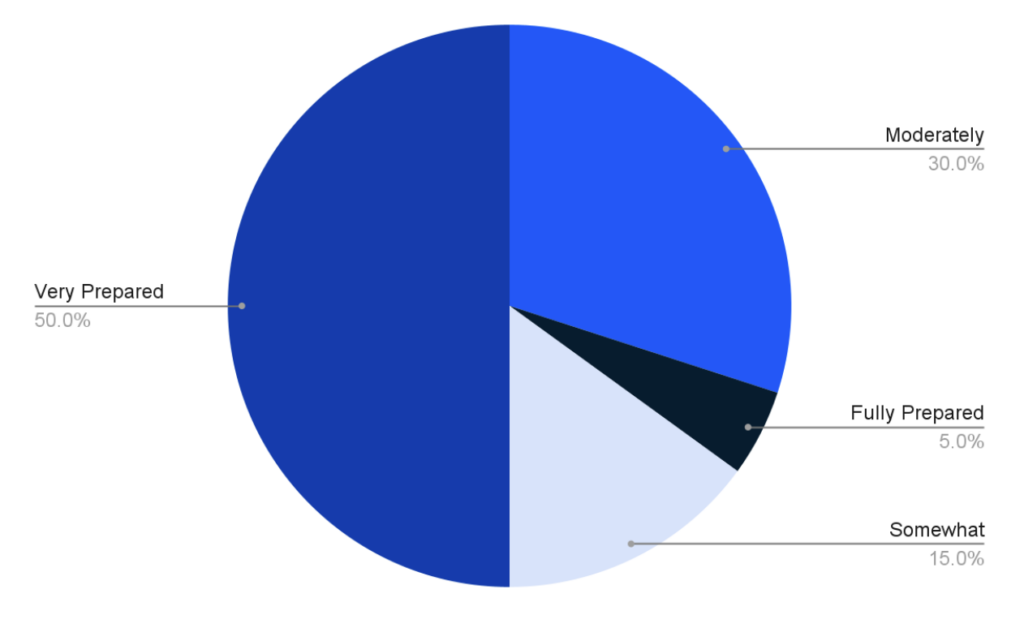
How Prepared Do You Feel for Consumer Duty?
We were pleased to see that the majority of firms who joined us felt very prepared, with 50% selecting this option, and no one stating that they weren’t prepared at all.
The panelists shared valuable insights on embracing changes and putting customers at the center of their business. A key takeaway was the importance of ensuring that everyone in the organisation was informed and that they understood what Consumer Duty means for the whole business, but also their specific accountability in delivering against it. Increasing awareness and providing comprehensive training to employees are crucial steps toward ensuring adherence to the act’s expectations.
The discussion around preparation also highlighted the importance of assessing product alignment with target customers, the risks of non-compliance, and the benefits of adopting a customer-first approach.
Furthermore, the concept of “substantive compliance” was emphasized as a means to exceed expectations and gain a competitive advantage. Ensuring the needs of vulnerable customers are met was also discussed as a crucial aspect of achieving desired outcomes.
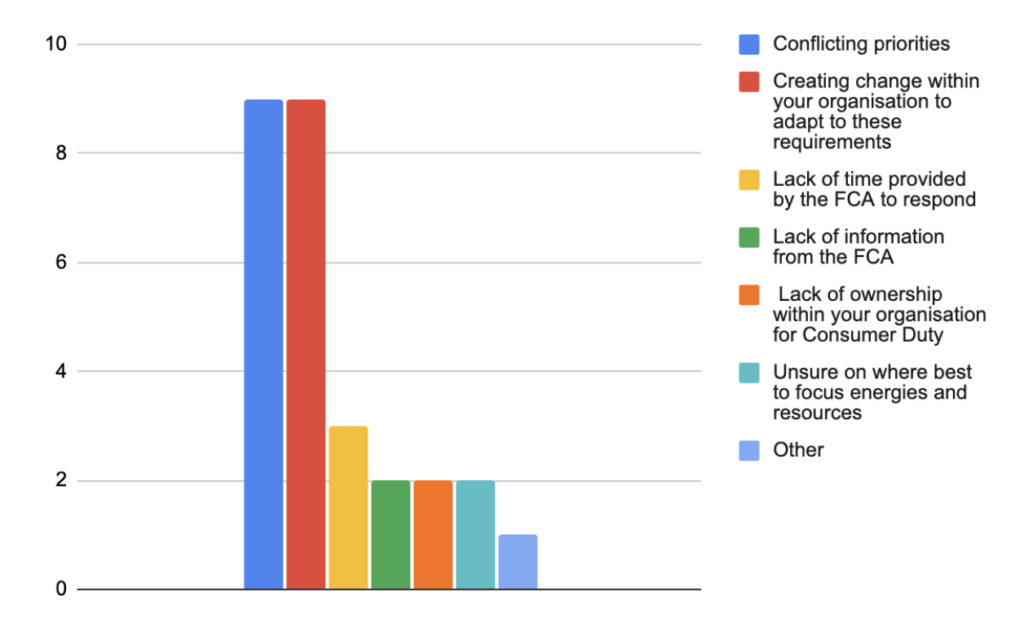
What Have Been Your Biggest Challenges in Getting Ready for Consumer Duty?
When asked about the biggest challenges they have faced, there was an equal split between “creating change within the organisation to adapt to the FCA requirements” and “conflicting priorities.” Both challenges undoubtedly speak to the need to implement new processes as well as ways of thinking, especially when strategic plans or other requirements such as digital transformation were already planned as necessities.
Solving for these challenges requires an organisation to embrace the Consumer Duty Act as an opportunity for a strategic evolution, rather than a complete upheaval of existing business strategies. The key is in adapting your perspective to see these adjustments as a fine tuning rather than a complete abandonment of the preexisting travel plan.
There was also emphasis on fostering a culture of ongoing learning and improvement. By embracing a mindset of adaptability and remaining attuned to shifting customer expectations and regulatory landscapes, organisations will be best able to meet the challenges and seize the opportunities presented by the act.
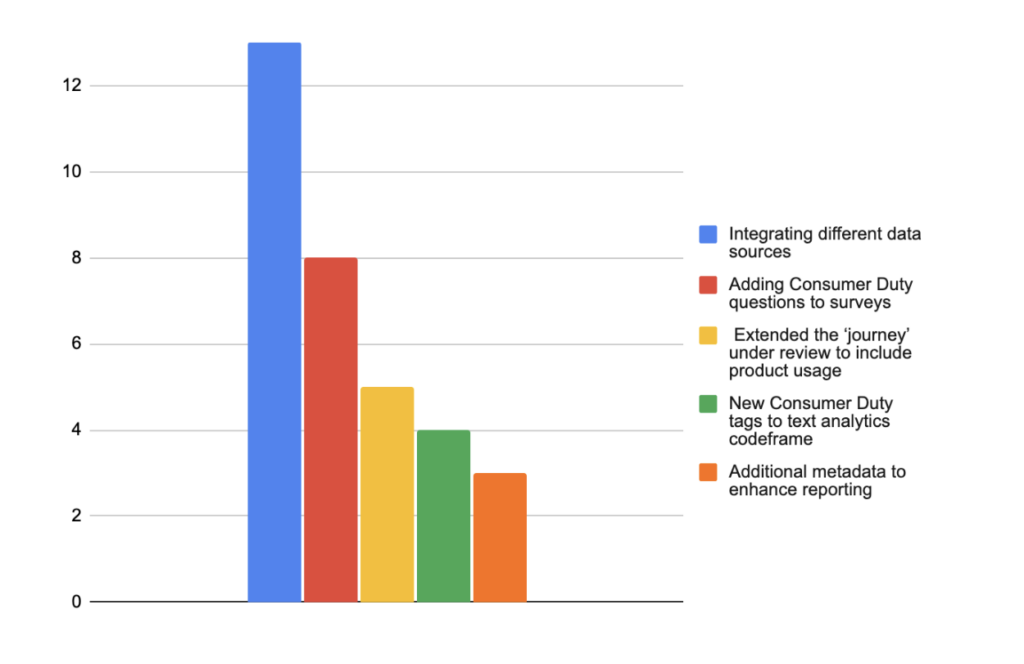
What Are the Biggest Changes That You Have Made Towards Identifying Risk Amongst Your Customers?
Lastly, we asked attendees about the biggest changes they had made to identify at-risk customers. The poll and the subsequent discussion revealed the significant industry-wide adoption of integrating diverse data sources (other than traditional surveys) into Marketing Intelligence (MI), with the third poll showing that 81% had integrated different data sources into their reporting. This integration empowers organisations to leverage comprehensive data, driving focus and strategic changes that are aligned with evolving customer needs.
Leaders in this space have continued to make adjustments to their CX programmes to support Consumer Duty requirements such as reviewing touchpoints and customer journeys to bridge gaps, more effective dissemination of customer insights to stakeholders, and a greater focus on measuring consumer understanding in order to take proactive action to address improvement areas. This final action leads to not only improved communication out to customers but also improved internal communication around expectations and making material more inclusive to drive better understanding.
“Firms should harness the benefits of data and technology to improve their services and understand the outcomes they achieve for their customers.”
The FCA
To get access to detailed notes, poll data and more, you can click here for a full summary of the Consumer Duty Panel Discussion!
It’s clear that the most successful brands will be those that focus on enhancing their customer-centric culture, putting the customer at the heart of all decision making, rather than focusing only on a compliance-first approach.
Having the right experience programme in place can help build customer centricity and use it to your advantage!
Find out how InMoment can help you embrace these changes to:
Deliver positive outcomes for your customers
Gain an improved consumer understanding
Identify customers at risk to complain and churn
Develop a culture of continuous experience improvement
Click the link if you would like to learn more about how InMoment can help you with Consumer Duty Compliance!
Unlock Expert Guidance on Today’s CX Challenges & Opportunities
Whether you’re struggling with limited resources, data fragmentation, or evolving customer expectations, this guide offers the expert advice you need to elevate your CX strategy. Download now to discover how to transform these challenges into growth opportunities.
Thank you
Your download will begin shortly. If it doesn’t, click on the download button.
Get a first look at the trends that matter most and how they can impact your customer relationships, drive growth, and strengthen your overall strategy.
Thank you
Your download will begin shortly. If it doesn’t, click on the download button.
Customer experience surveys have served us well when it comes to collecting customer feedback data. When we have questions about our brand’s customer experience (CX), there’s no better way to get answers than by asking our customers directly, right? But how do you make sure you’re sending the best possible customer experience survey? Asking the right questions? Sending your survey at time?
Keep reading to find the answers to these questions and more in this overview of customer experience survey facts, best practices, and beyond.
What Is a Customer Experience Survey?
Customer experience surveys are customizable questionnaires sent to targeted customer segments to determine how a brand is performing, uncover areas where customers are satisfied, and detect areas in need of improvement across the customer journey. The end goal of these surveys is to improve customer experiences and impact business metrics.
Why Use Customer Experience Surveys?
Customer experience surveys are more vital than ever before due to an extremely competitive market in every industry as well as empowered consumers. In mere seconds, customers can compare your brand’s products and services with that of your competitors. Therefore, you cannot afford to overlook any areas of dissatisfaction that may prevent customers from purchasing from you.
When you deploy customer experience surveys and other methods of customer listening, however, you are placing your customer and their satisfaction at the heart of everything you do—and that pays. In fact, customer-centric companies are 60% more profitable than companies who don’t focus on customers. This is largely due to the fact that brands who are customer centric leverage the insights they gain from customer experience surveys to make improvements for their customers, which improve the following metrics:
Customer Acquisition: Create exceptional experiences that attract new customers via word of mouth, and also leverage your voice of customer to create more targeted marketing campaigns.
Customer Retention: Reduce customer churn by resolving points of friction throughout your customer journey and leverage predictive analytics to identify customers who are likely to leave so you can implement a rescue plan.
Higher Customer Lifetime Value (CLV): Understand what keeps customers around so you can continue to not only satisfy their needs, but go above and beyond to delight them, keeping them around for a lifetime
Lower Cost to Serve: Identify areas where you can eliminate duplicate efforts and inefficient processes so you can fine tune your approach to save time, effort, and money.
Different Types of Customer Experience Surveys
There are four popular types of customer experience surveys many businesses leverage across the customer journey to gauge their brand reputation, customer satisfaction, customer effort, and other more targeted metrics.
#1: Net Promoter Score (NPS)
What Is Net Promoter Score?
Net Promoter Score (NPS) is a method of measuring brand customer satisfaction that was released in 2003 by Fred Reichheld, a partner at Bain & Company. It is among the most popular customer experience metrics as 48% of companies with more than $500 million
in revenue are using NPS as their primary indicator for measuring the customer experience success.
How Is Net Promoter Score Measured?
The Net Promoter Score is based on one question: “What is the likelihood that you would recommend company x to a friend or colleague?” NPS then categorizes customers into three types. The customer type is based on their likelihood to recommend your brand on a scale of 0-10:
Promoters (10-9)
Passives (8-7)
Detractors (6-0)
Your Net Promoter Score is calculated by subtracting the percentage total of detractors from the percentage total of promoters.
Why Does Net Promoter Score Matter?
NPS helps brands to get a brand-level tracking study of their overall customer experience because it gives them a single metric to measure their brand health. Additionally, NPS helps brands adopt an easy-to-understand, common language by giving them one singular metric to keep track of.
Net Promoter Score Survey Template
If you are looking to deploy a NPS customer experience survey, you can use the following template to craft a Microsurvey for in-app, in-site, or in-platform feedback, or even for an email survey or SMS survey.
Net Promoter Score Customer Experience Survey Example
#2: Customer Satisfaction Score
What Is a Customer Satisfaction Score?
Customer Satisfaction Score or CSAT measures a customer’s level of contentment after a specific interaction, transaction, or general satisfaction with a specific feature within a product or service.
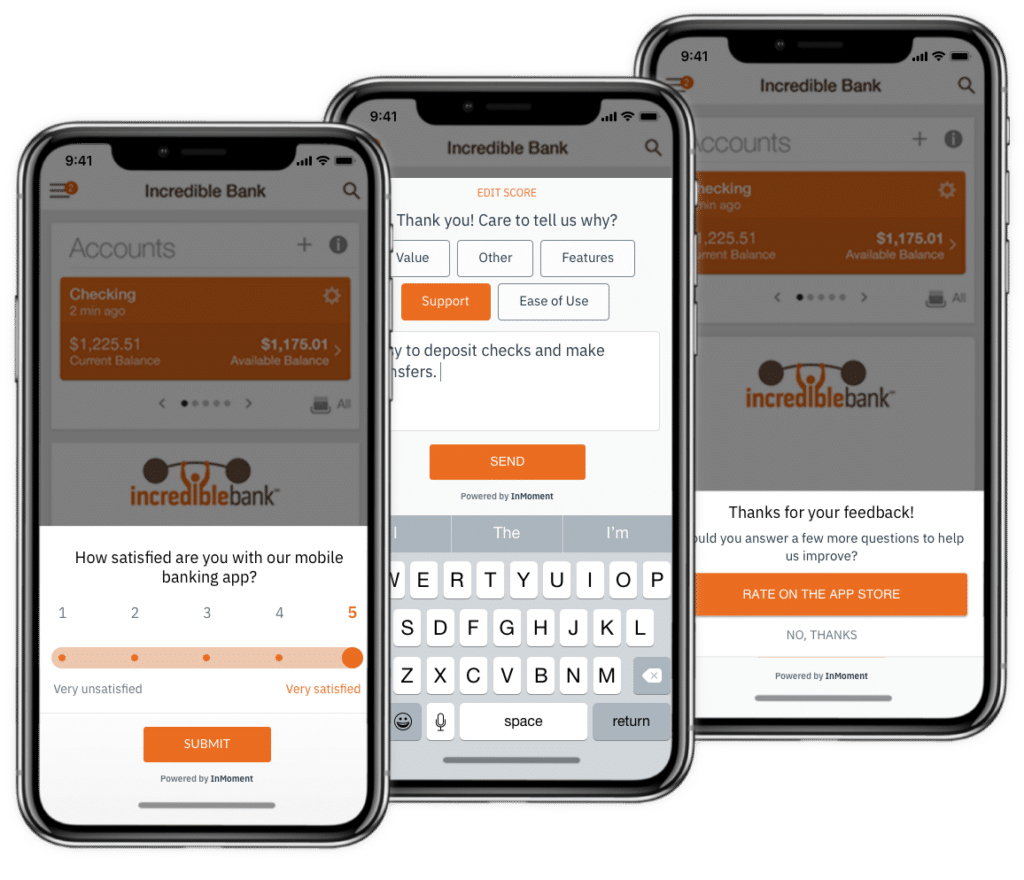
CSAT customer experience surveys ask “how satisfied are you with your recent experience at BRAND X?”
How Is Customer Satisfaction Score Measured?
Customer Satisfaction Score is equal to the total number of satisfied responses (with respondents who rated a 4-5 on a scale of 1-5 considered to be “Satisfied Responses”) divided by the total number of responses, then multiplied by 100. The final results should be rounded to the nearest whole number.
Why Does Customer Satisfaction Score Matter?
Customer Satisfaction Score is relatively easy to understand as it correlates to a single question on a survey. Also, it makes benchmarking against other brands simple and straightforward.
Additionally, CSAT customer experience surveys allow brands to get a snapshot of the customer experience at a specific touchpoint, which allows them to more easily identify areas that need improvement.
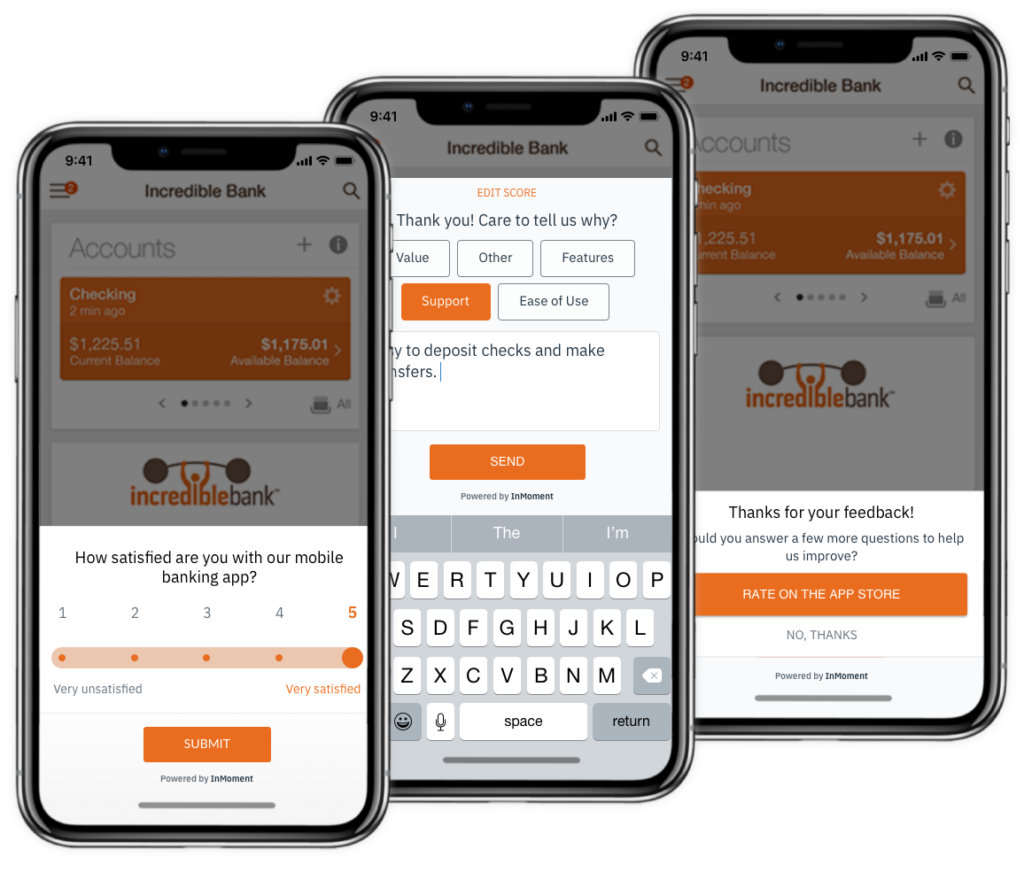
Customer Satisfaction Score Template
Looking to use CSAT post transaction or at another touchpoint? Check out this customer satisfaction score template:
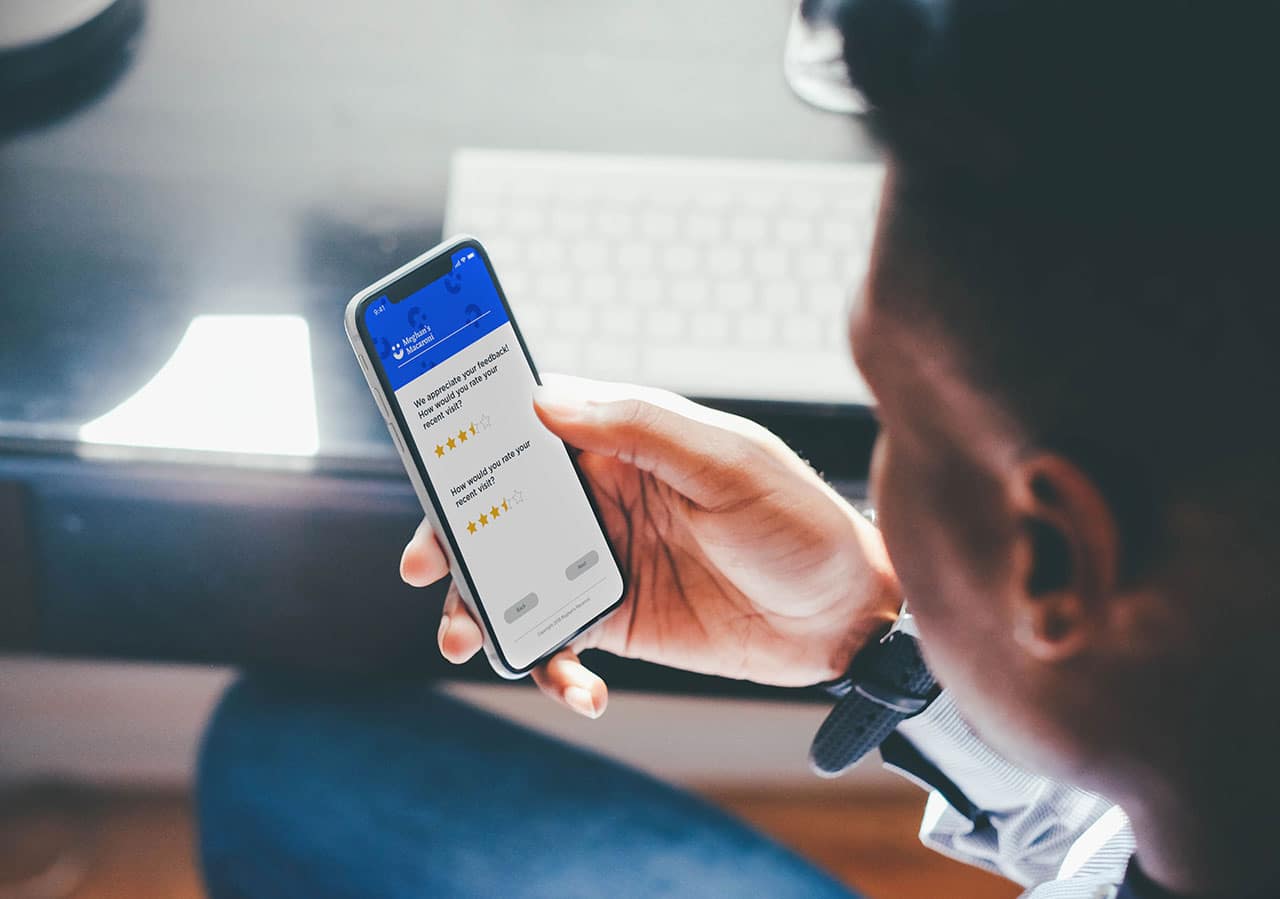
Customer Satisfaction Score Customer Experience Survey on Mobile
#3: Customer Effort Score
What Is Customer Effort Score?
Customer Effort Score or CES is a customer experience survey metric that allows brands to measure the ease of customer interaction and resolution during a request.
The Customer Effort metric became popular in the 1990s as companies realized that understanding the amount of effort it takes a customer to do business with them is critical. The thinking was that effort should be low for easy interactions whereas customers should expect to put in more effort for complicated or involved experiences. Effort plus satisfaction would help the organizations understand whether they were delivering on expectations.
How Is Customer Effort Score Calculated?
CES appears on a customer experience survey by asking customers to rate whether they agree or disagree with this statement: “The company made it easy for me to handle my issue.”Customers answer according to a scale from 1-7 with 1 being “Strongly Disagree” and 7 being “Strongly Agree.”
Organizations then take the number of those who responded with 5 and above then divide by the total respondents to calculate the CES.
Why Does Customer Effort Score Matter?
CES is especially popular in contact centers, but it is becoming more popular with other industries. It also allows companies to focus on one goal: doing whatever it takes to make things easy for their customers. Therefore, they can unify their efforts and work toward
that desired outcome.
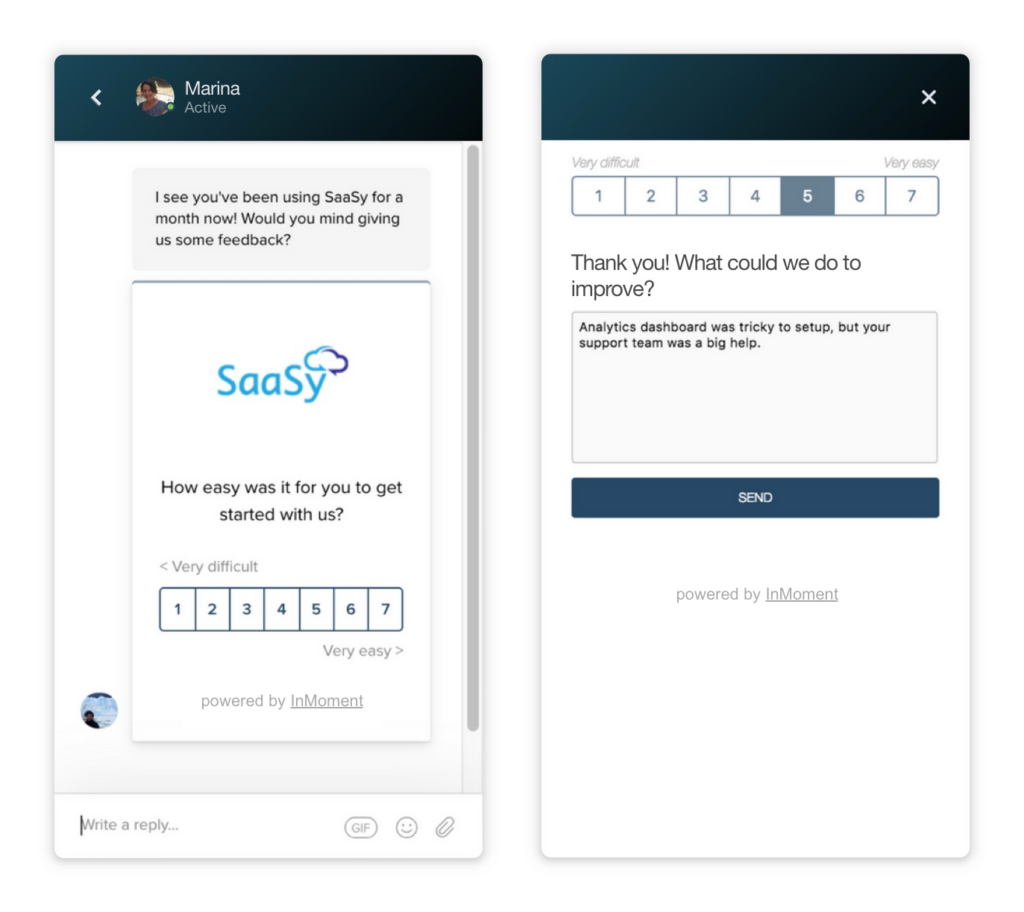
Customer Effort Score Template
If you’re looking for a Customer Effort Score template, you’ve come to the right place! Take a look below:
Customer Effort Score Customer Experience Survey via Chat
#4: Custom Customer Experience Surveys
When to Use a Custom Customer Experience Survey?
A customer CX survey allows you to ask more specific questions to targeted customer segments about a product, interaction, or service. These questions allow you to get into the details of your customer experiences to add more context to specific initiatives, such as product development, employee training initiatives, and beyond.
These customer customer experience surveys should be extremely targeted and designed to trigger at a very specific time, for instance, right after a customer performs the specific action your team is trying to fine tune.
There are plenty of benefits to using custom customer experience surveys, but the primary benefit has to be the fact that these surveys allow you to fill in any knowledge gaps or blind spots in your brand’s customer journey (more on this later).
How to Take Action on a Customer Experience Survey
Leveraging the metrics we’ve discussed so far is a great way to get a specific score associated with either your overall customer experience or customer satisfaction or ease at a specific touchpoint, but what about taking action on that metric to improve experiences? That’s why you need to get the story behind the score with a follow up question.
A follow up question comes after a metric-based question and simply asks, “What is the reason behind your score?” (or a variation of that question) and then leaves a text box open for customers to type in their explanation.
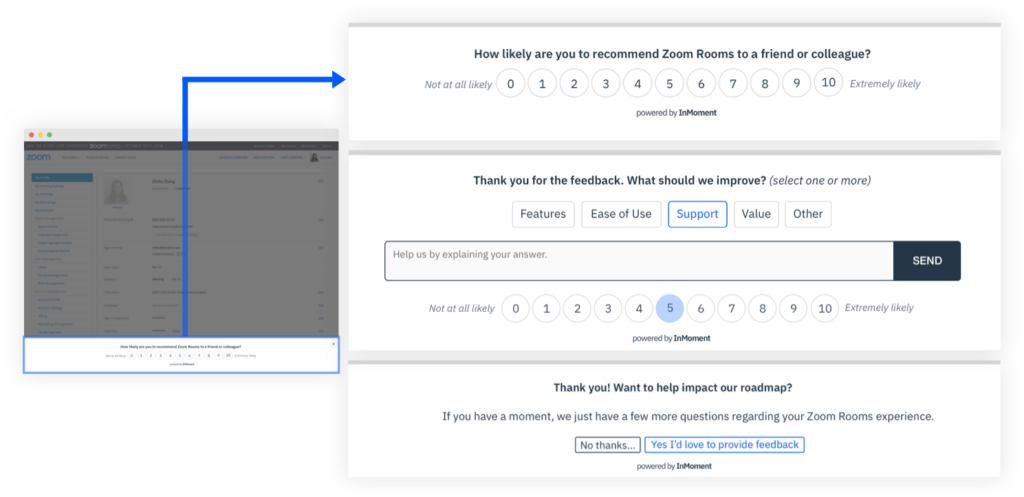
Net Promoter Customer Experience Survey With a Follow Up Question
This is where the most impactful insights will come from. Leveraging text analytics, you’ll be able to analyze the unstructured data from the text box to get to the why behind the score. It’s the difference between knowing an experience needs to be improved and knowing how an experience can be improved.
The best customer experience solutions will also provide dashboards within their platforms that identify the key drivers of specific experiences, which let you and your team know what elements of the customer experience you need to get right. Additionally, some CX platforms even can suggest action plans based on the unstructured data you collect via your customer experience surveys.
Customer Experience Survey Best Practices
When to Send a Customer Experience Survey?
When you should send a customer experience survey depends on why you are sending a survey. More relationship driven surveys with overarching questions like Net Promoter Score can have more flexible sending times, as you are gauging the overall satisfaction with a brand.
For more transaction- or interaction-based questions such as CSAT or CES, however, timing is everything. You want to make sure these surveys are sent right after the interaction in question. If there is a delay, you risk inaccurate data or lower response rates as the interaction or transaction is no longer top of mind for the customer.
You also want to make sure you aren’t sending surveys too frequently or you risk survey fatigue. If you’re reaching out to your customers every time you have a question, there’s a serious possibility that they’ll get tired of your questions and stop participating. This leads to lower response rates, which can affect the quality of the results you receive. Even worse, it can even cause over-surveyed customers to have a negative perception of your brand.
Where to Send a Customer Experience Survey?
There are various distribution channels you can leverage for your customer experience survey:
In-Store Surveys (via tablet, point of service, or push-button terminal)
Surveys via Push Notification
There are plenty of options, but the most important factor to consider is where your customers prefer to leave feedback. When you meet customers where they are and on the channels they frequent most often, you have a higher likelihood of sufficient response rates and more valuable and actionable feedback data.
Three Steps to Take Before Sending a Customer Experience Survey
Today, there are also so many other ways to collect customer feedback other than customer experience surveys. For instance, research shows that today’s customers are less likely to leave feedback via a traditional long form survey. However methods like Microsurveys, as well as social media and review sites and chatbots have grown in popularity.
Now, that doesn’t mean we need to abandon surveys all together! In fact, it’s just the opposite. It just means we need to send them at the right time and for the right reasons.
Below, we’ll talk through three expert-advised steps you should take before you send that customer experience survey.
Step #1: Ask, “What Am I Trying to Achieve With This Customer Experience Survey?”
This first step may seem a little rudimental, but we find that it is often the most vital, yet overlooked element of a successful customer experience survey strategy. We often tell our clients to “design with the end in mind,” meaning to think about not just what you want to accomplish tomorrow or even a few months from now, but when you think about your ideal future state of your customer experience, what does it look like? Only then will you be able to accurately identify how to get from point A to point B.
Failure to pinpoint your goals when it comes to survey strategy often looks like sending too many surveys with too many questions, leading to too much data—and therefore, too little intelligence.
That’s why we suggest getting your team together (and maybe including some expert consultants like our Strategic Insights Team) to decide what problem you’re trying to solve or what you’re trying to improve.
For example, are you striving to increase market share? Retain existing customers? Knowing the answers and setting goals right off the bat will help you narrow down the areas to listen (because if you listen everywhere, you end up with a lot of data and no answers).
Step #2: Take a Look at Your Current Customer Feedback Data
Wondering what questions will surely cause survey fatigue? The ones that you should have the answers to already. That’s why it’s so important to take a look at your existing customer data. This can be inferred data (such as customer relationship management data) or internal data (from emails, slack, and the like).
Today, there is no shortage of data. So, why would you want to add even more to your pile when your existing data might already hold the answers you seek?
Using the same example from step one, if you are looking to increase customer retention, you may be able to use inferred/internal data to identify that 30% of your churn is driven by a lack of personalized experiences. That gives you an area in which to take action, all without sending a single survey!
Step #3: Consider Existing External Data
So you’ve decided what you’re trying to achieve and sorted through your existing inferred and internal data. Now what? Next comes the data that already exists, but maybe you don’t have access to it yet.
We are of course referring to indirect data, such as comments and ratings from Glassdoor or other review sites as well as social media comments, credit card and IP targeting data, and the like. The right Experience Improvement partner should be able to help you access this data and the insights it holds.
By leveraging indirect data, you are gaining additional insights from existing customers and employees, but also non-buyers and non-employees. For instance, if you examine Glassdoor data from competitors, you can identify why their job postings are attracting candidates. You can then leverage that data to improve your own postings.
Now You Can Send That Survey!
Still have questions? Great! These are the perfect candidates for sending a quick survey. By following the three preceding steps, you can rest assured that you have exhausted all of your considerable data resources, and can send out a strategic, minimal survey without risking survey fatigue.
Want to learn if your customer experience surveys are the best they could possibly be? Our experts have developed an assessment that allows you to optimize your surveys and make sure that they will provide actionable insights that drive business results! Check out the Survey Assessment
Unlock Expert Guidance on Today’s CX Challenges & Opportunities
Whether you’re struggling with limited resources, data fragmentation, or evolving customer expectations, this guide offers the expert advice you need to elevate your CX strategy. Download now to discover how to transform these challenges into growth opportunities.
Thank you
Your download will begin shortly. If it doesn’t, click on the download button.
Get a first look at the trends that matter most and how they can impact your customer relationships, drive growth, and strengthen your overall strategy.
Thank you
Your download will begin shortly. If it doesn’t, click on the download button.
In the modern consumer-led environment, the customer experience is of paramount importance. Whether you’re offering omnichannel contact center solutions like we do at RingCentral or work in online retail, you must go the extra mile to ensure that your customers enjoy the best possible client experience. Because if you don’t improve customer experience, you can rest assured that your competitors will.
Where once the emphasis might have been on clever publicity schemes or B2B affiliate marketing, now businesses recognize that these methods – though they remain hugely important and valuable—need to be complemented by a laser-like focus on customer experience. Without that focus, you’ll find that consumers explore other options, and take their business where they feel it’s more valued.
Delivering exceptional customer experiences requires a wholehearted commitment across your company. That’s from the most senior management at the top, to the staff dealing directly with customers on the shop floor (or in the call center). It also requires a willingness to ask awkward questions about your own business, and a preparedness to confront – and address – any failings you might identify.
To improve customer experience and make your client encounters the best they can possibly be, you need to ensure that each interaction a consumer has with your business is smooth, consistent, and straightforward. You must also attend to their needs and concerns. Whether you’re showing customers how to record a webinar or helping them find the right furniture for their home, the same fundamental principles apply.
With all this in mind, then, it should be apparent that customer experience is vitally important to scaling a business. But what particular customer experience competencies can boost your business’s growth? This is what we’ll discuss in this guide, but first, we’ll look in more detail at exactly why the customer experience is of such overwhelming importance.
Furthermore, it is important to note that these expectations have changed quite dramatically in a relatively short period of time. The sheer choice available online has made it easier for consumers to shop around and explore alternative options. It’s no longer a matter of competing with businesses in your local vicinity, as there is (almost literally) a world of options out there for people to choose from.
Offering an exceptional customer experience, then, can have all sorts of welcome consequences. As we’ve discussed, it’s essential to ensuring long-term customer loyalty, thereby putting your whole business on a firmer footing. In addition, it also encourages positive word of mouth. Customers promoting your business to their friends and colleagues, and thereby (hopefully) bringing more custom your way.
The most important thing to remember with regard to customer experience is that the power these days lies with the consumer. No longer is it possible to pull the wool over their eyes with sub-standard products and services. The bar has been substantially raised, and this is the reality you must adapt yourself to.
Understanding Customer Expectations
Understanding customer expectations is crucial for businesses seeking to improve customer experience. It begins with identifying customer needs and desires, diving deep into what truly matters to them. By actively listening and gathering feedback, businesses can uncover valuable insights to tailor their products and services accordingly. Recognizing key touchpoints, such as initial contact, purchase, and post-sales support, allows businesses to focus their efforts and resources where it matters most. Mapping the customer journey provides a holistic view of the entire customer experience, enabling businesses to identify pain points and opportunities for improvement. By thoroughly understanding customer expectations, businesses can deliver personalized and exceptional experiences that leave a lasting positive impression.
So, now that we’ve clarified just why customer experience is so vital, we need to discuss the competencies that can transform your business for the better and send its growth soaring into the stratosphere, as well as creating a healthier business environment for everybody involved.
Here are five customer experience competencies which you must be continually focused upon:
1) Prioritize the Customer
It might seem like an obvious point to make, but to deliver the best possible customer experience, you need to genuinely prioritize the needs of the customer. This is of the utmost importance whether you’re promoting a video hosting platform or trying to tempt people to try a new restaurant.
The exact experiences that people expect differ from sector to sector, of course, but prioritizing the customer must remain constant across the board.
Customers need to feel that they are the focus of your attention at all times. They need to feel valued at all times. This needs to involve more than just rhetoric or platitudes. Your plan to improve customer experience must be backed with a plan for action, including the resources necessary to back it up. Set clear metrics and use hard data to measure customer experience management.
2) Be Prepared to Engage
Another point that needs to be kept in mind is that customer engagement is an integral part of delivering exceptional experiences. Consumers these days love to give their opinions, and most of the time they don’t require much prompting to do so. This is something your business has to be properly prepared for. Customer engagement, therefore, needs to be a leading priority for your business.
It’s best to take the initiative yourself. Be proactive in your efforts to seek customers’ opinions, and provide your own outlets where clients can offer them. Of course, people will use social media too, so be alert to any discussion of your business there. Also, when customers provide feedback, listen to it. They may highlight issues of which you were previously unaware, and it’s always frustrating for customers to feel their views aren’t taken seriously.
3) Demonstrate Firm and Open Leadership
Much is often made of the importance of purposeful and strong leadership in business, and there’s little doubt that this can make a huge difference. The value of entrepreneurialism has been proven over many years, from the largest multinational corporations to the smallest mom-and-pop retail outlets. But when it comes to customer experience, business leaders themselves must be prepared to be led by customers.
Business leadership must, therefore, accept the necessity of customer-centric growth. This involves heeding the views of consumers and maintaining an intimate understanding of exactly what they’re looking for. This doesn’t mean following the whims of customers blindly, however. It’s a question of distinguishing the good ideas, ones that can genuinely advance your business, from the fly-by-night suggestions.
4) Get Employee Buy-in
Following on from the previous point, leadership isn’t about dictating from on high and then leaving everybody else to make sense of the latest diktat. If we’re working to improve customer experience, we need to make sure that an ethos of prioritizing the consumer’s needs saturates the whole business. This means that the entire team, from top to bottom, needs to buy into the idea.
Employees must be provided with the resources, tools, and training they need to provide customers with outstanding experiences. They could be helping a customer find the perfect holiday gift or undertaking a Google Analytics health check for a client. Either way, they need to be supported and encouraged in their efforts to enhance customer experiences.
5) Build Strong Brand Values
We’ve touched upon the importance of having a clear and compelling ethos. This also needs to inform the general values of your brand. You have to remember that customers will hold you accountable if your business, its products, and services don’t live up to the various values you espouse. Whether it be a commitment to attentive customer service, unbeatable value for money, or simply a pledge of consistent quality in all areas.
Also, it’s crucial that your values aren’t just hot air. They have to relate in a concrete way to what your business is doing. Your team must understand how the work they do ties into the broader values your business has articulated. It’s not enough to reel off some superficial platitudes and then try to present these as a mission statement. They have to actually mean something, and what’s more, they have to be seen to mean something by customers.
6) Designing Intuitive User Interfaces
Designing intuitive user interfaces is essential for creating a seamless and satisfying digital customer experience. One key aspect is simplifying website navigation, ensuring that users can effortlessly find the information or products they are looking for. By organizing content in a logical and user-friendly manner, businesses can reduce frustration and improve engagement, ultimately leading to higher conversion rates.
Optimizing mobile responsiveness is another crucial element in today’s mobile-centric world. With more users accessing websites through smartphones and tablets, it is imperative to provide a seamless and enjoyable mobile experience. Responsive design ensures that websites adapt to different screen sizes and resolutions, allowing users to easily navigate and interact with the content. By prioritizing mobile responsiveness, businesses can cater to the needs and preferences of their mobile users, enhancing their overall satisfaction.
Streamlining the checkout and conversion processes is vital for minimizing cart abandonment and maximizing conversions. Long and complex checkout procedures often deter users from completing their purchase. By simplifying the steps, minimizing form fields, and offering convenient payment options, businesses can create a frictionless experience that encourages users to convert. Streamlining the conversion process not only improves the user experience but also increases the likelihood of repeat purchases and fosters customer loyalty.
Measuring and Analyzing Customer Experience
Measuring and analyzing customer experience is vital for businesses to understand and enhance their interactions with customers. Key metrics serve as valuable indicators of customer satisfaction and loyalty. Metrics such as Net Promoter Score (NPS), Customer Satisfaction Score (CSAT), and Customer Effort Score (CES) provide quantitative insights into the overall customer experience. Collecting and analyzing customer feedback through surveys, reviews, and social media monitoring allows businesses to gain qualitative insights into customer perceptions and identify areas for improvement. By actively listening to customers, businesses can address their pain points and meet their expectations more effectively. Additionally, utilizing customer journey analytics provides a holistic view of the customer’s end-to-end experience across multiple touchpoints. This helps businesses identify moments of friction or delight along the customer journey, enabling them to optimize each stage and enhance the overall experience. By measuring and analyzing customer experience, businesses can make data-driven decisions, implement targeted improvements, and ultimately deliver a more personalized and satisfying experience that fosters customer loyalty and drives business growth.
Conclusion
It’s very easy to tell customers how important they are and how concerned you are to ensure their happiness. There’s scarcely a business in the world that doesn’t tell its customers how important they are, and how valued their opinions are, and so on. But far fewer businesses actually uphold standards like these. The crucial test for your business is to prove to customers that their welfare and satisfaction is your number one concern.
That said, if you can prove your sincerity, then improving the customer experience is the natural result. After all, when clients know that you are on their side, then they’re likely to be much more willing to work with you to optimize all aspects of your business.
In this guide, we’ve listed some of the core competencies which your business will need if it is to make these commitments into an everyday reality. Of course, the exact steps your business has to take to improve customer experience will vary according to a number of factors. They include the resources at its disposal, what competitors are offering, the sector it’s competing in, and so on.
You should also remember that your focus will inevitably change as your business prospers and expands. Nevertheless, you must redouble your efforts to ensure that your customers remain at the heart of what you do, and that you don’t lose sight of your original mission and purpose.
John Allen is Director, Global SEO at RingCentral, a global UCaaS, VoIP, and cti software provider. He has over 14 years of experience and an extensive background in building and optimizing digital marketing programs. RingCentral is a Wootric customer.
These days, understanding your customers isn’t a “nice thing to do”; it’s an absolute necessity. To truly understand your customers, you need to spend some quality time listening to them and understanding the voice of the customer. That’s why mastering the art of the voice of the customer survey can be a game-changer for any business seeking to better understand its customers. The power of listening to your customers transcends beyond just collecting feedback; it serves as a strategic compass, guiding your decision-making, shaping your product development, and, most importantly, building strong, lasting customer relationships.
Read on to learn more about voice of the customer surveys, why they’re so important, how to create them, and some sample questions that can get you started creating your VoC survey today.
What Is a Voice of the Customer Survey?
At its core, a voice of the customer (VoC) surveys captures customers’ expectations, preferences, and aversions toward products, services, or your company in general. A VoC survey involves gathering both quantitative and qualitative feedback from customers about their various touchpoints with a company. Touchpoints could be anything from an interaction with your website, chatting with your customer service representatives, or actually using your products and services. By exploring customers’ experiences with these touchpoints, you’ll gain a holistic understanding of your customer’s journey and experience with your company.
Why Are Voice of the Customer Surveys So Important?
A VoC is more than just another survey to worry about. The benefits of VoC surveys extend far beyond mere data collection. They provide invaluable insights that can shape product development, fine-tune marketing strategies, and enhance customer service. Hopefully with all of these pieces in place, you’ll experience improved customer satisfaction and loyalty. Thus, the power of VoC surveys lies not just in listening to what customers have to say but in using those insights to create a better, more personalized customer experience.
Let’s dive into three specific benefits from utilizing VoC surveys as the powerful they are:
Understanding Customer Needs and Wants
At the heart of any successful business strategy lies a deep understanding of customer needs and wants. VoC surveys are literally the voice of your customers. They serve as a way to pull out real and salient insights into your customers’ needs and wants. These insights are the pulse of the market, reflecting real-time customer sentiment and demand. By tuning into the voice of the customer, you can identify what truly matters to your customers and adjust your strategies, products, and services appropriately. Your customers love it too.. VOC surveys provide customers with the opportunity to communicate their needs and wants directly to businesses.
Improving Customer Satisfaction
You created your business to solve a problem, and you want to make sure your products and services are actually doing that. The way to see if you’re reaching your customers the way you want is to evaluate your customer satisfaction. A VoC survey gives you the chance to do just that. Plus using these surveys can also help you boost your customer satisfaction on its own. Customers love the opportunity to be heard and understood, so when you’re actively working toward that, they’re going to notice and appreciate that.
Improving the Business Overall
VoC surveys are not just about improving customer experience; they offer significant benefits for the overall health and growth of the business. These surveys help businesses pinpoint potential issues from the customer’s perspective, allowing them to proactively address these concerns before they escalate and cause significant damage. Whatever customers aren’t liking, with a VoC, you have a chance to stop that in its tracks. This proactive approach not only improves the customer experience but also strengthens the company’s reputation, enhances operational efficiency, and drives overall business success.
Designing Your Voice of the Customer Survey
Voice of the customer surveys are powerful. How do you go about creating your own? Let’s dive into some of the basic steps for designing a highly effective VoC survey.
Define Objectives
Before crafting your VoC survey, it’s crucial to define clear, specific objectives. What are you trying to do or understand? Are you looking for insights on a specific product or service you want to refine? Or are you looking to improve your customer satisfaction overall? Knowing what your objectives are will help you design a survey that gathers data to help with your goal. You can ensure the data you collect is actionable and relevant to your overall business goals.
Choose the Right Types of Questions
Once you have clear objectives, you need questions that achieve your overall goals. The choice of questions in your VoC survey can significantly impact the quality and type of feedback you receive. To gain a comprehensive understanding of your customers’ experiences, it’s advisable to use a mix of multiple choice questions, scales (like the Likert scale), and open-ended questions. Multiple choice questions and scales are excellent for collecting quantitative data, offering clear, easily analyzable feedback. On the other hand, open-ended questions allow customers to express their opinions and experiences in their own words, providing rich qualitative data that can offer deeper, nuanced insights. A mix of question types will give you deeper insights overall.
Keep It Simple
While it’s important to gather as much valuable feedback as possible, your customers won’t complete a long survey. It’s much better to have fewer questions and more complete surveys than the other way around. Aim to keep it simple and keep your surveys no longer than 10 minutes. The simpler and more streamlined your survey, the more likely customers are to complete it and provide honest, thoughtful responses.
Start Broad, Then Get Specific
When structuring your VoC survey, a useful approach is to start with general questions before delving into more specific ones. Starting broad helps your customers “warm up” to providing you with feedback. Broad, initial questions can pertain to overall satisfaction, general experiences, or perceptions of your brand. Essentially, your early questions should be easy to answer without too much extensive thought. You can narrow as you go to get more detailed feedback.
Questions to Ask in a Voice of the Customer Survey
Those strategies can help you get started. To really take your VoC survey to the next level, we have some starter questions to help you write your own voice of the customer surveys. The questions we provide are broken up into general categories that you may want to consider on your surveys.
Value-Based VoC Questions
Did you find everything you were looking for today?
Is there anything you were looking for that we didn’t have?
On a scale of 1-10, how would you rate the value of your purchase?
What are the most important qualities you look for in a product or service? (This question is particularly poignant as a multiple choice question)
Did our customer service help you resolve any issue you came across?
Brand Loyalty VoC Questions
How likely are you to recommend our brand to a friend or colleague on a scale of 1–10?
When thinking about our brand, product, or service, what is the first thing that comes to mind?
What might prevent you from doing business with us in the future?
How likely are you to switch to a different brand, product, or service?
Customer Satisfaction Questions
How would you describe your experience with us today?
How satisfied are you with the product or service you received?
Was your customer service agent able to handle any issue you had?
What could we have done to improve your experience?
Final Thoughts
Overall, VoC surveys are powerful tools to better understand your customers and how they really perceive your company. Utilizing these surveys, you can further refine your products and services, enhance your customer satisfaction, and better meet the needs of your customers.
Learn more about how a voice of the customer survey can help you build a better brand with InMoment today!
Unlock Expert Guidance on Today’s CX Challenges & Opportunities
Whether you’re struggling with limited resources, data fragmentation, or evolving customer expectations, this guide offers the expert advice you need to elevate your CX strategy. Download now to discover how to transform these challenges into growth opportunities.
Thank you
Your download will begin shortly. If it doesn’t, click on the download button.
Get a first look at the trends that matter most and how they can impact your customer relationships, drive growth, and strengthen your overall strategy.
Thank you
Your download will begin shortly. If it doesn’t, click on the download button.
Surveys are a way to compile data from a group of people, but they can be more than that. Surveys are also direct insight into your customers and information about how they feel about your company, products, and services. How did your customers perceive your most recent product launch? How do they feel about your company’s social media presence? Surveys are a direct line to find out and glean valuable information about your customers and your company.
But not all surveys are the same, and different types of surveys can provide different insights. There are many types of surveys your company can choose from, and it can be hard to determine which one would be the best for your needs. So to help you figure out the right type of surveys for your needs, we’ll walk you through the most common survey types, the benefits of using surveys, and how to get started today.
How to Choose the Right Survey Method
Prior to launching a survey, it’s imperative to consider what resources are available to you to conduct the surveys, your goals and objectives, the sample and population size and many other factors to consider:
Time: Typically in-person surveys require more time than online surveys. Consider how much time you have available and how soon you need results.
Money: Consider what your budget is and how much it will cost to conduct your survey of choice.
Audience: Consider your audience demographic. Online surveys are typically more difficult for an older population. Consider what type of surveys yield a higher response rate for your audience.
Technology Capabilities: Consider whether you have the proper technology that can handle your data analytics.
Research Expertise: Consider whether you have the proper research knowledge such as clearly defined problems, objectives, a target audience, proper data tracking capabilities etc.
Responses: Consider whether you have strategies in place to combat slow response or no response rates.
The Most Common Types of Surveys
There are so many survey types, but we’ll explore 7 types of surveys in depth since these are the most common and beneficial for most companies.
Online Surveys
Online surveys are one of the most popular types of surveys and for good reason. Online surveys are easy to create, disseminate, and gather responses—challenges many other survey types face. Using an online survey platform, your company can create a survey easily and quickly—often with a wide range of question types—and send it out to customers within seconds. Your customers can then answer the survey at their convenience and send their responses back to you instantaneously.
In addition, online surveys are beneficial for companies that have a wide reach and customers around the world. Online surveys are accessible by anyone anywhere with only the click of a button. You can reach a wide audience with this type of survey.
But like any survey type, online surveys do have their cons. Online surveys could be accessed anywhere, but the survey recipient has to have internet access. There are parts of the globe and some households that don’t have internet access (or easy access to public internet) that could be valuable contributors to your survey. In addition, online surveys can provide a wealth of information, but they fall short in some depth. There’s no organic way to ask follow up questions or to probe deeper into an answer when you want more insights.
Paper Surveys
Paper surveys are sometimes looked at as old fashioned, but they do still reach an audience that can’t access many other types of surveys. Many audiences—like senior citizens or those without internet access—are far more likely to respond or far more comfortable with paper surveys than online surveys. Plus paper surveys are often easier to read for many since they’re printed in large fonts with black text on white paper.
But one major con of paper surveys is that they can be one of the pricier types of surveys. Paper surveys have to be printed off, sometimes in large quantities, to reach your audience. That can add up if you’re trying to reach a large amount of people. In addition, paper surveys aren’t the most environmentally friendly way to survey.
Mail Surveys
Mail surveys are one of the most traditional types of surveys. While some people may look at them as old fashioned, there’s a reason this method has been around for so long: it feels authentic and offers you access to an audience that may be less inclined to respond online. Those demographics who are less likely to answer an online email survey are often familiar with mail surveys and will be willing to respond. In addition, mail surveys also have a wide geographic reach since most places are accessible by post.
When it comes to mail surveys, there are a couple of things to plan for in advance. First, creating the surveys can often be simple, and you do only need to print them off to distribute. But you should keep in mind that your response rate will often be lower if you don’t pre-paid return envelopes for the participants. One drawback of mail surveys is that they require some extra work on the part of the survey participants—something that often lowers response rates. You’ll want to reduce that level of work as much as possible by providing return envelopes that simply need to be dropped in a mailbox.
That brings up the second con of mail surveys: they can cost your company a little bit more. The cost of printing, envelopes, and postage can add up—but could be worth it for the responses you receive. Second, when it comes to response rate, less is more. Mail surveys have a better completion rate if they’re short. Try to keep your survey to about a page. Not only will that increase your chances of completed responses, short surveys also reduce printing and postage costs.
Telephone Surveys
Telephone surveys are another more old fashioned method of surveying that has been around since landlines. Now that nearly everyone carries a phone with them or has one at phone, telephone surveys are alive and well in surveying methods. For a telephone survey, a real live interviewer will ask a series of questions and record responses. With modern technology, it’s easy for interviewers to insert responses directly into a computer system to chart and track data. In addition, telephone surveys let interviewers add a personal touch to the conversation that isn’t possible for online, mail, or paper surveys. The chance to ask follow-up questions can give the interviewers a chance to probe for deeper insights and emotions.
Telephone surveys still face a few cons. These surveys may be cost effective, but they should be kept short. Fifteen minutes is the cap for an effective phone survey. In addition, phone surveys run the risk of looking like a telemarketing call or being ignored. With the saturation of telemarketing calls, many cell phone users don’t answer calls from unknown numbers. Some even block all unknown numbers. While telephone surveys can be effective, your team of interviewers will first have to be ignored a decent amount.
In-Person Surveys
While paper and online surveys lack a personal touch, in-person surveys excel at that. With these surveys, interviewers are able to directly interact with a respondent and to ask follow up questions that really delve into the nuances and intricacies of a response. These surveys provide accuracy and profound insights. In addition, in-person interviews are a great way to collect responses from audiences with low literacy—something that may hinder groups from participating in other methods.
While the insights gleaned from these surveys can be immensely valuable, there are still some cons to consider. In-person surveys can be time consuming. Your team will need to prepare a venue, schedule interviews, and spend the time actually performing the interviews. It’s a very hands-on process the entire time. In addition, in-person interviews run the risk of interviewer bias or inexperience. The interviewer is crucial to getting usable insights, so you will need to spend the time and money training or hiring one. Even a well-trained interviewer can still lead to interviewer bias skewing your information.
Panel Surveys
Panel sampling is when you select a group of people to survey repeatedly over a period of time. Your respondents will be randomly selected from your target audience, and they’ll respond to several surveys over a determined period of time. Longitudinal studies are a great example of panel surveying. These surveys can provide long-term insights and show in-depth understanding of a target audience. In addition, your company could use a third-party research company to perform a large bulk of the research and to ensure it’s done at a high level of quality.
But panel surveying takes time and preparation to make them effective and usable. In addition, some participants may choose to stop responding to surveys part way through the study, leaving you with gaps. Your company may need to provide incentives to encourage participants to follow through with the entire surveying process.
Focus Group Surveys
Focus groups are a variation of in-person surveying methods that includes a panel of 6–10 people that represent the target population. All of these people will answer questions and hold a discussion, moderated by a professional who attempts to keep everything on track and as unbiased as possible. These surveys can reveal personal attitudes and perceptions for a sampling of your entire target population—something that can be very valuable for market research.
The cons of focus groups, though, include the costs of preparing a moderator and participants. It can take time to select just the right panel of participants to make sure you are accurately exploring your target audience. You may also need to pay for the travel expenses and time of an effective moderator. Oftentimes you may also need to survey your focus group participants a second time to gather quantitative data, and that takes additional time and preparation.
Benefits of Using Surveys
If surveys take time, preparation, and work, why do companies keep turning them for market research? Aren’t there easier ways? Well, there may be, but there are few ways that can give you such insight into your target populations and how your brand is performing. Surveys provide strategic benefits based on customer feedback that can help improve CX and improve brand loyalty.
Here are some other key benefits of using surveys:
Large sampling size. Surveying can reach many customers in many locations or with many limitations. With a variety of surveys, you can reach people all over the world, people who don’t use the internet, and people who can’t normally participate in other marketing research methods.
More cost-effective. Even the pricier types of surveying are fairly cost effective when compared to the valuable insights you can gain.
Reliable and usable information. Surveys can give you information and insights that are a reliable reflection of your audience, especially of how they feel toward many parts of your brand. In addition, this information can actually be usable (with the right analysis) to improve your brand, customer experience, and, ultimately, ROI.
Improve the brand experience. Your customers deserve a brand they trust and have a positive experience with. Using surveys, you can get real feedback from your customers and improve your brand experience in meaningful ways.
How InMoment Can Help
If you’re ready to get started with surveying, InMoment can help today. InMoment’s customer listening solutions provide your company with the tools you need to create strong surveys that will reach your audience and provide your team with the insights you need. InMoment surveys are conversational and designed to reduce survey fatigue while ultimately capturing every customer story, so you can design products that will benefit them.
Once you have survey data, the next step is to analyze it and thoroughly glean insights from the responses. Being able to make sense of information is where you’ll be able to create opportunities to increase revenue. InMoment’s text analytics can help your company find actionable insights and feedback.
Overall, surveys come in every shape and form—each one offering your team a new way to understand your customers and improve your customer experience and brand loyalty.
GET STARTED
Schedule a Demo & Get Started on Surveys!
With InMoment’s solutions, you’ll be able to take full advantage of the benefits of surveying and really understand your customers and be able to use that for actionable insights and informed business decisions. Conduct surveys and improve your customer experience with InMoment today!
Unlock Expert Guidance on Today’s CX Challenges & Opportunities
Whether you’re struggling with limited resources, data fragmentation, or evolving customer expectations, this guide offers the expert advice you need to elevate your CX strategy. Download now to discover how to transform these challenges into growth opportunities.
Thank you
Your download will begin shortly. If it doesn’t, click on the download button.
Get a first look at the trends that matter most and how they can impact your customer relationships, drive growth, and strengthen your overall strategy.
Thank you
Your download will begin shortly. If it doesn’t, click on the download button.
Customers are the lifeblood of any business, and providing them with a great experience can lead to increased loyalty, higher satisfaction, and improved brand reputation. It’s simple: every company needs customers, but what happens when there are so many brands to choose from? How can brands stand out? The customer experience (CX) is crucial for any business that wants to succeed in today’s highly competitive market. Great customer experience doesn’t just happen as soon as you send out a survey; it needs to be planned and designed purposefully.
In this article, we’ll discuss what designing an effective customer experience looks like, what makes it different from user experience and customer service, why it matters, the elements of customer experience design, and how to design a great customer experience from start to finish.
What Is Customer Experience Design?
To start, what is customer experience? Customer experience is every interaction your customers have with your company at any point. That experience affects how they view your organization and products, as well as their loyalty. Customer experience design is the process of creating the customer experience at all touchpoints, from the initial discovery phase through to the post-purchase phase. It’s what your company does to ensure a positive customer experience across all stages of the customer journey.
The goal of customer experience design is to create a positive, memorable experience for customers that meets their needs, exceeds their expectations, and strengthens their relationship with the brand. It’s a way to move your customers through their journey while actively working to make that a smooth and easy process. Customer experience design involves a multidisciplinary approach, including user research, journey mapping, visual design, and user experience (UX) design.
A great customer experience can lead to increased customer loyalty, higher customer satisfaction, improved brand reputation, increased revenue, and a competitive advantage. So focusing on customer experience design is a way to actively work toward creating that great customer experience and helping your company benefit from it.
Customer Experience vs. User Experience vs. Customer Service
Customer experience is often confused with other similar terms. While customer experience, user experience, and customer service are related, they are not the same thing and should not be discussed interchangeably. Understanding the differences between these concepts is crucial to creating a great customer experience. So, let’s dive into the differences.
Customer Experience
The customer experience encompasses the customer’s experience with the overall brand at all touchpoints before and after purchase. It includes all interactions with the brand, including marketing, sales, customer service, and post-purchase interactions. It’s every ad, every social media post or comment, every article that a customer reads, and much more. It’s even walking past your storefront or coming across your website. The goal of customer experience is to create a positive, memorable experience that will ultimately strengthen the relationship between a customer and your brand.
User Experience
User experience (UX) is specific to the experience of navigation, usability, and interface design of a specific product or service. It focuses on the user’s interactions with a product or service, including how easy it is to use, how it looks, and how it feels. Basically, it’s your customer’s experience with your product.
Customer Service
Customer service is the experience that customers have with your representatives about products or services. It includes interactions with customer service representatives, returns, and warranty claims. Again, customer service is a piece of the larger picture of your customer’s experience with your brand. Good customer service is crucial for creating a great overall customer experience because it helps customers feel valued and supported even after the purchase is complete and when something goes wrong.
Benefits of a Great Customer Experience Design
Let’s take a closer look at all of the benefits of dedicating time and effort to designing a great customer experience. A great customer experience design can lead to numerous benefits for your business, including:
Increased Customer Loyalty & Retention
A great customer experience design can create a strong emotional connection between a customer and your brand, leading to increased customer loyalty. Essentially, if your company can develop a real relationship with customers, they will continue to come back again and again. Loyal customers are more likely to make repeat purchases, recommend your brand to others, and provide positive reviews and feedback. Plus loyal customers are what makes running a business so rewarding.
Higher Customer Satisfaction
A great customer experience design can lead to higher customer satisfaction, as customers feel that their needs and expectations are being met. Higher customer satisfaction can lead to increased revenue and improved brand reputation. Plus you get the satisfaction of creating something that benefits people.
Improved Brand Reputation
When you provide a great experience for your customers, they’re going to spread the word. Satisfied customers are more likely to provide positive reviews and feedback, as well as recommend your brand to their friends. So if your customers have a great experience with you, that’s what your company will be known for.
Increased Revenue
A great customer experience design can lead to increased revenue. It’s a simple formula: satisfied customers are more likely to make repeat purchases and recommend the brand to others. This leads to more revenue for your company. Increased revenue can lead to business growth in the long run and help you have the opportunity to continue to provide excellent products and experiences.
Competitive Advantage
A great customer experience design can provide a competitive advantage in a crowded marketplace. There are so many brands for everything, but companies that provide a good experience are where people want to go. Customers are more likely to choose a brand that provides a great experience over a brand that does not. So to stand out and be chosen above a competitor, provide a great experience for your customers.
Elements of Customer Experience Design
Customer experience is so important, but what makes up the process of designing CX? These are the most common elements of customer experience design that are important to consider when crafting an excellent CX.
User Research
User research is the process of gathering information about customers to better understand their needs, behavior, and expectations. To understand how to provide a good experience for your customers, you need to understand who your customers are, what their problems are, and how to solve them. User research can include surveys, interviews, focus groups, and usability testing.
Journey Mapping
Journey mapping is the process of mapping out the customer’s journey from initial discovery to post-purchase interactions. It’s about knowing where your customers start and what leads them to an eventual purchase. It helps your company understand the customer’s perspective and identify any pain points that might hinder the journey. Journey mapping can be used to create a customer experience that meets the needs of the customer at every touchpoint.
Visual Design and UX
Visual design includes the look and feel of the product or service, including branding, colors, and typography. UX design focuses on the usability and functionality of the product or service, including navigation, information architecture, and interaction design. Visual design and UX design work together to create a seamless, enjoyable customer experience. When visual design and UX are prioritized, your company can create a website and products that are easy to use, meet customer needs, and provide customers with a great experience.
Designing a Great Customer Experience from Start to Finish
With those elements in mind, let’s look at the steps to designing a great customer experience, from start to finish.
Discovery Phase
The discovery phase involves identifying customer needs and understanding their behavior and expectations. This phase is when you utilize user research, market research, and analysis of customer data. It’s important to develop a deep understanding of who your customers are, their current journey, their pain points, and any areas for improvement when designing your customer experience.
Definition Phase
With a clear understanding of who your customers are, it’s time to define what success looks like. The definition phase involves defining goals, objectives, and key performance indicators (KPIs) to measure the success of your customer experience design. The definition phase helps ensure that your customer experience design is aligned with your overall business goals and customer needs.
Design Phase
The design phase involves creating a blueprint for your customer experience. You’ve come up with great ideas for what your customers truly need (hopefully revealed in the discovery phase), and you know what success looks like (thanks to the definition phase), so now you can make a plan for how to get from A to Z. You might prototype, test, and refine the design based on research and goals. The goal of the design phase is to create a customer experience design that works when you put it into action.
Development Phase
The development phase involves bringing the customer experience design to life. You get to take your blueprint and make it into the actual experience for your customers. This phase can include developing necessary systems, processes, and tools to support the customer experience design.
Deployment Phase
Once you have a developed plan, you can put it into action. The deployment phase involves launching the customer experience design. This phase can include training employees, communicating with customers, and ensuring that everything is working as intended. Now your customers will get to experience a deepened relationship with your brand.
Continuous Improvement
Simply executing a plan does not mean that your work is done. The continuous improvement phase involves monitoring, evaluating, and improving your customer experience design. You can seek out customer feedback and make any needed changes. The goal of the continuous improvement phase is to ensure that the customer experience design is always improving and meeting the real needs of your customers.
Design a Great Customer Experience With InMoment
The InMoment XI Platform offers a comprehensive suite of tools and services that allow businesses to collect, analyze, and act on customer feedback in real time. Businesses can use these tools to do necessary research about their customers and to evaluate CX design and work toward continuous improvement.
InMoment’s solution is also valuable when developing your CX design. InMoment provides businesses with actionable insights that can be used to identify and prioritize areas for improvement, design, and test new customer experiences, and measure the impact of changes on customer satisfaction, loyalty, and revenue.
In addition to its platform, InMoment offers expert consulting and professional services to help businesses develop and implement effective customer experience strategies that align with their business goals and customer needs. InMoment’s team of experts can provide guidance on user research, journey mapping, visual design, UX design, and more.
Final Thoughts
A great customer experience design is essential for any business that wants to succeed in today’s highly competitive market. In today’s competitive landscape, simply having an exceptional product may no longer be enough to win over customers. By designing a great customer experience, businesses can increase customer loyalty, improve brand reputation, and increase revenue. Designing a great customer experience involves multiple elements, including user research, journey mapping, visual design, and UX design—and it is a step-by-step process that includes multiple phases.
By using InMoment’s platform and services, businesses can create a great customer experience that meets the needs of their target audience and aligns with their business goals. InMoment can help businesses stay ahead of the competition by providing real-time feedback and insights that can be used to continuously improve the customer experience. Get started with InMoment to begin designing a great customer experience.
Unlock Expert Guidance on Today’s CX Challenges & Opportunities
Whether you’re struggling with limited resources, data fragmentation, or evolving customer expectations, this guide offers the expert advice you need to elevate your CX strategy. Download now to discover how to transform these challenges into growth opportunities.
Thank you
Your download will begin shortly. If it doesn’t, click on the download button.
Get a first look at the trends that matter most and how they can impact your customer relationships, drive growth, and strengthen your overall strategy.
Thank you
Your download will begin shortly. If it doesn’t, click on the download button.
At Forrester CX EMEA, we heard from InMoment client Aegon, a Dutch public company for life insurance, pensions, and asset management. The key message throughout the conference was to be bold and ensure that organisations are aligned, focused, and ready for the future. Aegon are certainly delivering on this agenda and are continuing to succeed by connecting people and processes across the entire organisation to achieve shared goals and focus on growth.
Aegon’s ‘Connecting with Customers’ programme is an award winning programme which has delivered spectacular results for the business, colleagues and customers. Using a customer centric approach, Aegon has successfully enabled their teams to receive real-time feedback in order to drive change and as a result, are increasing customer satisfaction and accelerating growth.
Connecting With Customers
The experience programme ‘Connecting with Customers’, is successfully embedding a customer-focused culture throughout the business, underpinned by the strong CX & Insight framework run in partnership with InMoment. The programme reaches all parts of the business through online learning, customer talks, animated games and cartoons, podcasts, skills workshops, topic masterclasses, and more.
In their Forrester CX EMEA presentation, Aegon explained how their program has resulted in deeper customer understanding and colleague empowerment, which translates into measurably better outcomes for the customer and a healthier business. Keep reading for the top takeaways:
3 Key Takeaways From the Presentation:
Takeaway #1: Be BOLD
Set out to create a customer-obsessed culture, and get there! Aegon has taken the Connecting with Customers (CwC) roadshow to all locations and functions in the business. It is a very high profile campaign, an ‘all or nothing’ approach because the business knows the customer must come first.
The Board Directors have shown their support and CwC manifests in many different forms from a regular podcast to learning and development resources, an audio library of customer calls and customer feedback videos.
Making VoC a part of the entire business might seem like a bold move, but the effort is worth it. As a CX leader, you need to ensure the whole business is aware that every decision affects the customers’ experience.
Takeaway #2: Break Down Silos
Everybody has a role in serving the customer so be inclusive! Recently, a customer was invited into the Aegon offices where he met all those who had helped him on his retirement journey, both back office and customer facing. This event really brought it home how everyone at Aegon has a unifying purpose, to connect with customers.
Creating a customer focused culture throughout the entire organisation breaks down barriers and allows for better communication and understanding, and as a result, better customer outcomes.
Takeaway #3: Have Fun
Customers can tell when employees enjoy their role and connect with their purpose. Aegon threw a CwC 2nd birthday party recently with music, discussions, and games. And for the New Year’s quiz, Jenny Ryan from ITV’s “The Chase” was the guest of honour! Connecting EX and CX is massively important and by understanding that employee experience can have a positive impact on customer experience is key to creating a customer centric culture.
One final point that stands out from successes such as Aegon’s is how vital it is to have an inspirational CX leader with the charisma, vision and drive to elevate customer centricity to new levels. In Iain O’Connor, Head of Customer Experience & Insight, Aegon has one of the best, along with other great CX leaders such as Claire Tidey, CwC Programme Manager.
Want to hear from Iain as he speaks about understanding customers’ expectations? Check out this video!
Unlock Expert Guidance on Today’s CX Challenges & Opportunities
Whether you’re struggling with limited resources, data fragmentation, or evolving customer expectations, this guide offers the expert advice you need to elevate your CX strategy. Download now to discover how to transform these challenges into growth opportunities.
Thank you
Your download will begin shortly. If it doesn’t, click on the download button.
Get a first look at the trends that matter most and how they can impact your customer relationships, drive growth, and strengthen your overall strategy.
Thank you
Your download will begin shortly. If it doesn’t, click on the download button.
Read a blog by Phil Sager, Expert Partner and Daniel Moellerhenn, Expert Partner, Bain & Company, speakers at the XI Forum in Cologne on June 13 & 14
Reports of record inflation, ongoing labor constraints, rising capital costs, and other macro trends are ongoing and have compounded in unique ways. As in previous cycles of historical uncertainty and downturns, these increased headwinds across the globe mean customers and companies are behaving differently.
So, how can CX leaders and their teams best navigate customer experience in such challenging times?
We’ll explore below how to prioritize customers and strategically use customer experience tools to drive growth for your business and keep on course.
Understand the Landscape
As outlined in Bain’s The New Recession Playbook, a successful approach to strategy during a downturn requires businesses to:
Have a realistic assessment of your company’s starting point. Establish a clear understanding of your current strategic position and financial strength in relation to your peers and competitors. From this viewpoint, you can more easily strategize and weigh the types of risks your company can handle.
Be aware that, historically, downturns provide an opportunity for more dramatic gains and losses. In this moment, it’s vital to follow a decisive strategy, as the consequences will have long-term impacts on your business, talent, and customers. Those with a successful approach can end up stronger than before the downturn.
Take a Human-Centric Approach
How does recession strategy talk translate into CX planning and approach?
Customer experts Phil Sager and Daniel Möllerhenn suggest strategically doubling down on customers & employees. You can strengthen your experience management efforts by understanding your customer segments and taking special action to better serve those populations.
In one segmentation use case, a major Retailer Co leveraged existing capabilities and assigned unique Guest IDs to consistently collect detailed data on customers. They were then able to provide specific coupons and product suggestions, even leveraging life events (i.e. expecting parents, new college students) to provide an ecosystem of products at specific points in those customer journeys.
In another example, a major Asia-Pacific Telecom Co utilized segmentation to align their growth strategy with changing customer needs and, as a result, exceeded revenue goals and cemented their leadership in the industry.
From a recent survey of CX leaders conducted at Bain, we learned that while 61% of respondents have existing segmentation that drives action toward different customer segments, the majority of those same leaders do not use segmentation data strategically to buffer the negative impacts of budget cuts. In less-turbulent times, segmentation provides potential opportunity for growth, but in today’s challenging climate, it’s a necessity to strengthen your position and better connect with your customers.
How can you make better trade-offs using segmentation?
Strategic Use of Customer Segmentation
This demonstrates an important opportunity to strategically use customer segmentation to make informed trade-offs, especially in challenging times, to buffer budget cuts, potential downsizing, and other factors outside of the control of CX teams.
Segmentation will help you zero in on the best ways to provide for and delight your customers and with a tailored approach, lean into specific areas to drive customer retention and customer loyalty to weather the storm, earning growth in the short and long term for your business.
Our experts have compiled actionable ideas below to help companies prioritize customers and strengthen their customer experience strategy:
Provide For Your Customers
Where can you deliver a stellar customer journey point?
Offer unique services on top of products that service the customer’s greater overall need
Remove junk / nuisance fees from the equation
Understand the emotions of your customers and build responses in kind
Inspire Your Teams
Invest in a culture that empowers teams to continuously improve and work toward a common purpose.
Equip your front line employees and customer service representatives (CSRs) with proper product, procedures, and communication for supporting customers in challenging situations
Deepen their customer connections / distil a clearer voice of the customer
Invest in your current employees to create future leaders
If applicable, clarify expectations around hybrid / work-from-home (WFH) models
Activate Your Promoters
Their customer value increases exponentially over time.
Find the right implementation of referral programs to reward promoters and grow your base
Provide loyalty programs that enhance customer experiences in a meaningful way
Improve communications with customers – timely responses over preferred service channels
Your Customer Experience Strategy Going Forward
In conclusion, navigating turbulent times requires a human-centric approach that prioritizes customers and employees. Customer segmentation is an effective tool for understanding customer needs and taking action to better serve specific segments. By leveraging segmentation, companies can make informed trade-offs, buffer budget cuts, and drive growth in the short and long term. To strengthen their customer experience strategy, companies should focus on providing stellar customer journeys, inspiring their teams, and activating their promoters. By adopting these strategies, CX leaders can steer their businesses through challenging times and emerge stronger on the other side.
Unlock Expert Guidance on Today’s CX Challenges & Opportunities
Whether you’re struggling with limited resources, data fragmentation, or evolving customer expectations, this guide offers the expert advice you need to elevate your CX strategy. Download now to discover how to transform these challenges into growth opportunities.
Thank you
Your download will begin shortly. If it doesn’t, click on the download button.
Get a first look at the trends that matter most and how they can impact your customer relationships, drive growth, and strengthen your overall strategy.
Thank you
Your download will begin shortly. If it doesn’t, click on the download button.
When it comes to starting a customer experience (CX) program, the right vendor (and solution) can make all the difference. Choosing the right vendor for your CX program can be a critical decision, as it can have a significant impact on the outcome of your program. The right vendor will not only provide the necessary tools and technology, but also bring valuable expertise and experience to the table. They can help you identify your business’s specific CX needs, develop a tailored plan, and implement it successfully.
With the right vendor, you can ensure that your CX program delivers the desired results and improves your customer satisfaction, loyalty, and revenue. When it comes to what type of CX solution you want to implement, there are two options to choose from: a full-service program or a self-service program.
What Is a Full Service CX Solution?
A full-service CX solution refers to a CX partnership where the company that provides the platform manages all aspects of the technology (programming, analysis, change management, etc.)
This brand/CX vendor relationship is services driven, and a brand that purchases this type of solution can expect to have a dedicated team of experienced CX and technology experts to check in with regularly (sometimes as often as every week with additional calls if needed) to help the brand with every aspect of their CX program. A full-service CX vendor will help your team define strategy, implement the technology, train team members, craft surveys, import other customer data, design reporting dashboards, and beyond.
What Is a Self-Service CX Solution?
A self-service CX vendor refers to a situation in which a person or persons within the purchasing organization are responsible for all aspects of the ongoing technology usage.
A brand purchasing a self-service CX solution can expect to have full control and autonomy in their CX initiatives. There is often a dedicated implementation team, but post implementation, there is more likely to be a helpline or contact the brand can reach out to in case of an error or if they’re in need of help.
Of course, there is a gray area between the two categories. A CX vendor that emphasizes true partnership will emphasize that customer experience is not one size fits all, and will therefore offer a blend of self-service and support-driven options to fit your needs. For example, a vendor may offer DIY survey tools alongside strategic insight sessions.
Self-Service v. Full Service: How to Determine Which Is Right for You
A full-service program can be a great choice if you’re short on resources or if you want to outsource CX management to an expert team. With a full-service program, you’ll be able to fill in any gaps in resources or skill sets with the considerable expertise your full-service CX vendor has on staff. Your dedicated team will be infinitely familiar with your business, goals, and program.
A full-service CX solution will also help you to drive more long-term strategy for your program. Check-ins will help you to stay accountable to goals, and your vendor will be able to advise you on any challenges, as well as connect you with other CX professionals in your industry.
On the other hand, a self-service program may be a better option if you have the expertise and resources to accomplish your CX goals in-house. With a self-service program, you can make changes to surveys or other initiatives in the middle of the night if you want to.
Additionally, self-service programs can be more cost-effective in the long run, since you won’t be paying for the vendor’s management services.
Take Our Quiz and Get Started
Ultimately, the decision between a self-service and full-service CX program depends on a variety of factors, including the size of your organization, your budget, and your technical expertise.
Click below to take the quiz and find out whether a self-service or full-service CX program is right for your business!
QUIZ
Self-Serve v. Full Service CX Program: How to Determine Which Is Right for You
Looking to choose a CX technology vendor? Here’s the first question you need to ask yourself: are you looking for a self-serve solution or a full-service solution? The answer will determine how much support your team receives, the expertise you have access to, where your team will spend their time, and more! On the fence about what’s right for you? This quiz will help you decide.
Forrester predicts that in the next year, one in five customer experience (CX) programs will disappear, but one in 10 will be stronger than ever. The pressure is on for all CX practitioners—but small CX teams are feeling the heat the most. But just because you have a small team doesn’t mean you can’t make a major impact.
In our over two decades of experience, we’ve worked with many small-but-mighty teams of around one to three people. And though it’s easy to feel overwhelmed when you have big obstacles but limited resources, we’re here to tell you success is possible—if you use your time wisely.
That’s why it’s absolutely crucial to focus on CX strategies that help your organization get the most out of your program. What strategies will support CX success for your small team? Keep on reading to find out!
4 Strategies for Success With a Small CX Team
#1: Focus on Quick Wins
Much like baseball, customer experience is a game of singles. You can’t magically tackle every customer issue at once—especially with limited resources. Instead, you need to understand what most negatively impacts a specific customer journey and focus on solving that problem. Then line ‘em up, and knock ‘em down.
For example, let’s say that your call center data shows customers frequently complain about the log in experience for their online account. Then you know you need to dig into the call transcripts and other available unstructured data to understand what about that experience is making such a negative impact on your customers. (Get a step-by-step guide on how to do this here.)
#2: Lock In Your Executive Champion
To get your CX program started, you likely needed an executive sponsor. But in order to have long-term impact, you need to maintain their support.
This may be easier for the 53% of CX practitioners who say their executives want their firm to be a CX leader, but for the other 47% percent, making an exec-friendly business case is everything. Your team will need to craft a compelling story, leverage strong visuals, and prove tangible ROI to really knock it out of the park!
#3: Sell Your Program Internally
With your executive sponsor in place, now it’s time to sell the rest of your organization. Realistically, you won’t be able to get every employee to buy-in—that’s why you need to sell your program to key individuals that can help you to take action and influence other team members.
How? You need to adopt a salesperson approach to your own program. Make it clear to team members in other departments exactly what they can gain from CX insights: optimized processes, access to data that can inform decision making, and wins of their own.
#4: Leverage Your CX Partner
Having a small CX team or even just one CX employee can mean that it’s hard to validate ideas or discuss new ones. In fact, four out of five CX teams will lack critical design, data, and journey skills. And that’s understandable when you have a small team—you can’t be absolutely everything for everyone.
Luckily, you can lean on your CX partner as an extension of your team, especially if your vendor provides you with dedicated services and team members!
Your Next Steps
Now that you understand the four strategies for success, it’s time to make an actionable plan to turn those strategies into a reality.
To get you started, we’ve put together a step-by-step checklist for your team. In it, you’ll find a manageable task list that will help you lay a strong foundation for each of these strategies, and there’s even an advanced checklist to take your success even further.
How to Craft a Max-Impact CX Strategy for a Small CX Team
Having a small CX team doesn’t mean you can’t make a big difference. What it does mean is that you have to use your time wisely! Download this checklist for step-by-step instructions on how to realize four strategies designed specifically for CX teams like yours.
For your small CX team, every second counts. You simply don’t have time to waste with a vendor that doesn’t work for you or understand what makes your business different.
At InMoment, we don’t believe in one-size-fits-all solutions or set-and-forget programs. Our award-winning technology is built to integrate into your existing tech stack and align to your business goals. And our expert services? Your dedicated team is with you every step of the way. You are always able to reach out to an expert who is intimately familiar with your program—not merely dial a 1-800 help center.
That’s why InMoment customers give us 4.9/5.0 Stars and a 100 “Would Recommend” User Rating.
Want to learn how InMoment can help you maximize your CX strategy? Let us show you!
In today’s highly competitive business landscape, delivering exceptional customer experience (CX) is essential for any organization to remain relevant and successful. However, many businesses struggle to find success with their CX program because of organizational silos.
What Are Organizational Silos?
The term “organizational silos” refers to the condition in which different teams or departments within a company operate in complete isolation from one another. This isolation hinders overall collaboration and the sharing of information and data, making it almost impossible to execute on a business-wide initiative that requires the buy-in from multiple teams across the organization.
How Do Organizational Silos Impact the Customer Experience?
This challenge likely sounds familiar to CX professionals. After all, a successful CX program needs to be able to collect data across channels and touchpoints, pinpoint friction points wherever they exist, and then take swift action.That simply cannot happen with silos in place, and that’s why organizational silos can have such a significant negative impact on the customer experience—they make it essentially impossible to improve experiences.
Wondering if organizational silos could be at the root of your CX challenges? Today, we’ll explore the symptoms of CX silos within an organization and why breaking them down is crucial for achieving your CX goals. We’ll also provide practical tips and strategies for bridging these silos and fostering a customer-centric culture within your business.
The Symptoms of Organizational Silos
Organizational silos refer to the situation where different teams or departments within a company operate in isolation from one another, hindering collaboration and the sharing of information. This can have a significant impact on the quality of the customer experience delivered by the organization. But how do you know if your company is suffering from silos that are negatively affecting the customer experience? Here are some signs to look out for:
Executive Level:
Lack of Organizational Efficiency
Misaligned Resources
Competing Organizational Objectives
Ineffective Process
CX Specific:
Consumer Data Silos
Limited Insights
Duplicative Efforts
Feedback Disarray
If any of these signs resonate with you, it may be time to take a closer look at the silos within your organization and take steps to break them down. In the next section, we’ll discuss the impact that silos can have on the customer experience and why it’s crucial to address them.
The Negative Impact of Organizational Silos
Silos within an organization can have far-reaching consequences if left unaddressed. The negative impact can be felt across the entire organization, from customers to employees to the bottom line. Here are some potential outcomes of silos:
Customer Churn:
When different departments are not aligned on the customer experience, it can lead to a disjointed experience for the customer. This can result in frustration and dissatisfaction, leading to churn and lost revenue.
Customers may seek out competitors who can provide a more seamless experience.
Employee Turnover:
When teams are working in silos, it can lead to a lack of collaboration and communication, making it difficult for employees to work together effectively. This can result in a negative work environment and a lack of motivation among employees.
Frustrated employees may look for opportunities elsewhere, resulting in high turnover and the loss of valuable talent.
Excessive Costs:
Duplicative efforts and inefficiencies can result in excessive costs, both in terms of time and resources.
Teams may be spending time and money on initiatives that are not aligned with company goals or customer needs. This can have a negative impact on the bottom line, with costs eating into profits.
In order to avoid these negative outcomes, it’s essential to address organizational silos and foster a culture of collaboration and communication.
So, What Is the Prescription for Organizational Silos?
You know the symptoms of organizational silos, and what the negative effects may be. But what are your next steps going to be?
In our over 45 years of experience, we have helped organizations of all sizes break down organizational silos. As a matter of fact, we have developed a 3-step organizational silo treatment plan to help you do just that. Join two of InMoment’s brightest minds, VP of Customer Success Will Huffman and Manager of Program Excellence Angela Zieres as they walk you through our 3 step treatment plan that won’t just improve your CX program, but it will also improve your business! Watch it here!
WORKSHEET
Discover Your Customer Experience
A Guided Exercise to Help You Understand the Current State of CX at Your Organization
So, you’ve been charged with leading a company-wide CX initiative. But where do you even start? Likely, customer experience efforts are already being made in different pockets of your organization, but it’s up to you to break down the silos and connect the dots. This worksheet will guide you through an exercise to do just that!
InMoment announced today new innovative capabilities in the award-winning XI Platform for clients around the globe. This release of enhancements builds on InMoment’s integrated CX approach and AI-powered product foundation to give organizations the best chance of competing in today’s changing business environment.
Below you’ll find the latest innovations to:
Summarize customer feedback more effectively to save time and resources
Improve the closed-loop service experience to reduce churn and increase customer lifetime value
Infuse feedback into enterprise systems to save time and resource expense
Elevate your CX programs and the teams that drive them to create program efficiency and a quicker time to value
“We’re proud of our innovative and aggressive product cadence to deliver innovation and product enhancements into the market regularly,” said Sandeep Garg, Chief Product Officer at InMoment. “We believe it is important to continually enhance products alongside introducing new innovative solutions that benefit our clients and the goals they are trying to achieve to improve their customers’ experiences.”
If you’re a client and want to talk to someone about the updates to the XI Platform, contact your account rep. If you simply want to learn more about our innovative products and services, a representative can answer your questions by completing the form below, and we’ll get right back to you.
Product Enhancements to Increase the Business Value of CX Initiatives Include the Ability to:
Summarize Customer Feedback More Effectively to Drive Focused Action
First-of-its-kind technology–Smart Summary Generator powered by Generative Pre-trained Transformer (GPT) technology, intelligently transforms feedback into easily consumable short, structured paragraphs. to surface the most important topics and trends to help organizations take immediate action on their customer feedback. What’s so exciting about this technology is it reduces the time spent analyzing and helps immediately summarize key themes and topics, making it easier for businesses to get to the root cause quickly. Read the press release about this innovation and other exciting AI capabilities that help save a ton of team time and resources by summarizing customer feedback more efficiently.
Improve the Closed-Loop Service Experience
We’ve made major UI upgrades and introduced additional features to increase the performance of case management systems. Organizations can now also include employee insights that describe the moods of the employee and the customer at the case close (the person who called into the call center and you resolved their issue). There is also the capability to use closed-loop data for reporting alongside operational data to get additional insights about the customer and their experience. This allows teams to use customer case data to dig deeper into segments and geographies, enabling a better understanding of what to take action on to reduce churnand increase customer lifetime value.
Drive CX Program Engagement by Infusing Feedback into Enterprise Systems
We often mention integrated CX and the ability to integrate different systems, feedback channels, and key insights that lead to action as key contributors to the success we see our clients have when it comes to understanding their customers. With that in mind, we’ve made major updates to our workflow application to easily export text analytics data and send it directly into BI tools. It allows users, like analysts or researchers, the ability to pivot on data from tags to mine data and find insights that no one else can find in their BI tools of choice. This gives business analysts the flexibility and control over data analysis, which saves time and resource costs by minimizing the need for manual or scripted analysis. This process is critical to helping organizations identify trends and actionable insights more quickly, regardless of the data source or language.
Elevate CX Programs and the Professionals that Drive Them
InMoment and NPSx by Bain & Company have entered an exclusive strategic partnership to continue our efforts in alleviating the angst organizations are having as they struggle to understand where to begin when setting up a CX program or how they can evolve their program’s maturity level. Our joint expertise helps organizations understand how to assess current CX capabilities and how to create and execute successful CX strategies and initiatives to improve program efficiency and quicker time to CX value. NPSx Bain is also an expert in training and certifications with accreditation for CX professionals and practitioners to enhance their expertise around the latest customer experience and NPS prowess or training and certification to stay current with industry best practices, develop new skills, and advance careers.
These enhancements and more, including 26 new language capabilities added to the platform, have been designed to help our clients summarize and leverage customer feedback more efficiently, identify how to take targeted action on closed-loop feedback, leverage AI to intelligently transform feedback into easily consumable paragraphs to understand themes, and export text analytics to current BI tools.
To learn more about the latest product innovations and enhancements, you can find additional detail on the web pages linked above or check out the release notes here!
Unlock Expert Guidance on Today’s CX Challenges & Opportunities
Whether you’re struggling with limited resources, data fragmentation, or evolving customer expectations, this guide offers the expert advice you need to elevate your CX strategy. Download now to discover how to transform these challenges into growth opportunities.
Thank you
Your download will begin shortly. If it doesn’t, click on the download button.
Get a first look at the trends that matter most and how they can impact your customer relationships, drive growth, and strengthen your overall strategy.
Thank you
Your download will begin shortly. If it doesn’t, click on the download button.