CX Program

We’ve evaluated the pros and cons of primary reporting locations for the customer experience (CX) function and ideal CX leader qualities in previous articles, “Where Should CX Live Within An Organization?” and “Does Who’s Driving the CX Bus Make a Difference?

It’s now time to discuss the organizational elements that are necessary for CX to thrive in an organization (regardless of the reporting structure your organization chooses or the characteristics of the person leading the CX function).

We utilize a continuous improvement framework with our clients that starts with the principle of “design with the end in mind.” This means achieving one or more of the four key economic pillars: acquiring more customers, keeping more customers (reducing churn), growing lifetime customer value (CLV), or reducing cost to serve.

The Five Stages of the Continuous Improvement Framework:

Stage #1: Design

Clearly design an experience strategy that aligns with overall company goals and brand promise, driving customer outcomes.

Stage #2: Listen

Thoughtfully deploy modern listening strategies and data integrations across the journey to expand and enhance an integrated view and holistic customer understanding.

Stage #3: Understand

Consolidate all data streams and leverage advanced analytics to identify where and how to act (and the anticipated impact on customer outcomes).

Stage #4: Transform

Create & implement dynamic action plans, training, and policies that facilitate organizational change (and promote activities that drive customer outcomes).

Stage #5: Realize

Evaluate and demonstrate results of experience initiatives including (but not limited to) organizational change, improved metrics, and financial impact.

Building the Foundation for A Successful CX Program: Moving Beyond the Continuous Improvement Framework

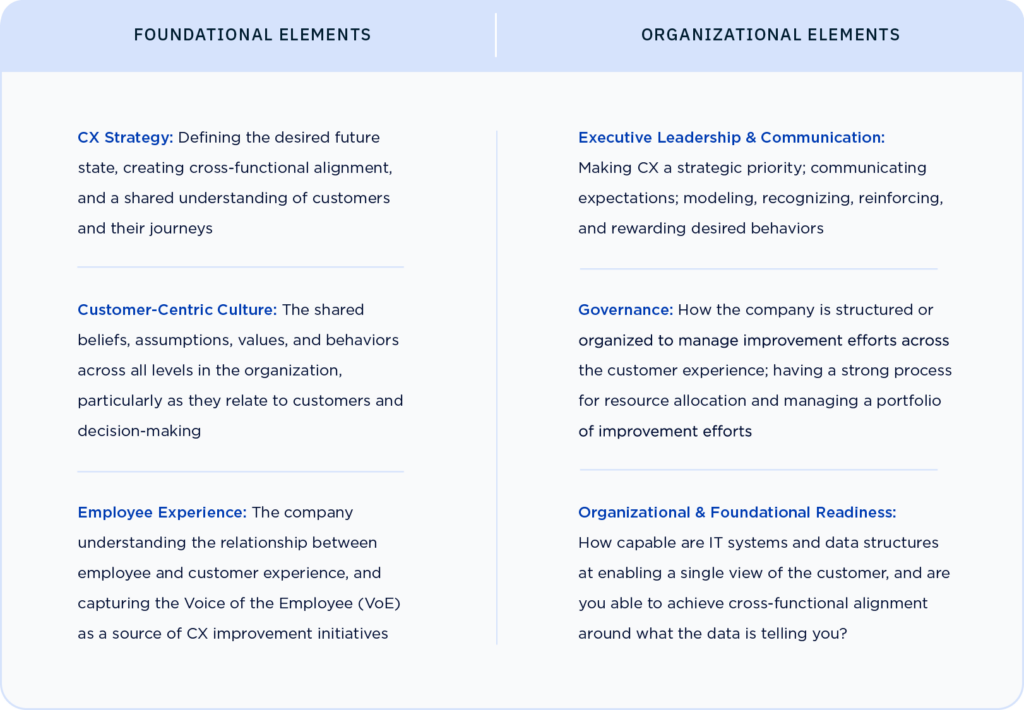
Beyond those five core stages, though, there are certain foundational and organizational elements that must be present for CX to thrive in your company.


What these additional elements suggest is that customer experience is a team sport that requires the participation, alignment, and coordination of the entire organization—and that your success will be limited if it is a grassroots effort and not a strategy led and supported by the executive leadership team. That alignment and shared understanding is vital to CX success, and by extension, the wider success of your entire organization.

Our hope is that this three-part series has given you much to consider about your organization’s customer experience efforts. Based on what we see in the marketplace, too many programs are still stuck in the Listen and Understand stages and have not figured out how to get organized to break down silos in order to drive effective improvement efforts or don’t have the executive leadership and buy-in to facilitate this. Breaking down these silos, both in terms of the organizational design as well as internal data structures, requires executive leadership engagement and strategies to enable a single view of the customer.

Driving ROI from your customer experience efforts continues to be the biggest conversation in the CX community and the greatest challenge for most companies. And your C-Level executives, board and shareholders expect this.

Being organized properly, having the right people with the skill sets that we discussed in place, migrating your culture to one of customer-centricity and getting organizational alignment on what customers need and how to best, and most efficiently, meet these desires is really tough work. But it is critical to have all of these elements in place in order to drive the best CX outcomes. And the companies that can do this are the ones that stand to reap the greatest benefits in terms of future revenue and market share growth and long-term profitability.

Survey Rating Scale

You’re sitting down to carve out the newest survey in your customer experience (CX) program. You know what touchpoint you’re examining, what you’re hoping to learn, and what questions you’re going to ask. Now it’s time to settle on the survey rating scale you’ll use.

Unsure of which scale to choose? I’m Kiri Burgess, a Senior CX Consultant at InMoment APAC. Together, with our Director of Marketing Sciences, Sharon Allberg, in this post we’ll share with you a collection of best practice tips for using rating scales in your customer surveys 

What Is a Survey Rating Scale? 

If you’ve ever put together a customer survey, you will no doubt have used a rating scale as an option for respondents. 

Survey rating scales are a way to ask a “closed question” to survey respondents, and collect valuable input in a quantitative way. Here’s an example:

There are a number of important considerations when using rating scales including:

  • Number of scale points
  • Anchoring of scale points
  • Midpoints
  • Colors and images

The choice of which survey rating scale to use can be perplexing. And while academic research is vast, it’s not always relevant to market or customer experience research, which can leave a number of unanswered questions.

Whatever scale you choose, the aim with a survey rating scale is to limit individual interpretation and ambiguity. In an ideal world, you want all respondents to view a scale in the same way.

Having reviewed scale literature and our own internal research; then overlaid client and research experience, here are five tips for survey rating scale success:

Here Are Five Pro Tips for Survey Rating Scale Success

Tip #1: Longer Scales Typically Reveal More Actionable Insight 

There is not a great deal of evidence on the difference in performance between shorter (i.e. 5 point) or longer (i.e. 10 point) scales from a respondent point of view—but the advantage of a longer scale is you’ll get greater differentiation in response. Responses will be more spread out due to having a longer scale. This typically results in stronger driver analysis revealing more actionable insight.  

Tip #2: Keep Survey Rating Scales as Consistent as Possible 

If you can, decide on a rating scale size and stick with it throughout your survey. Greater scale consistency will not only make it easier for respondents but it also makes it easier to communicate what a good result looks like to the business as all questions will calculate ‘good’ the same way with the same scale points. We understand that this isn’t always straight forward so if you do change your scale in your survey, that’s okay. Our advice would be not to chop and change scale lengths multiple times which will cause respondents confusion and fatigue.

Tip #3: Label Your Scales Appropriately 

How to best label your scale will depend on the scale length.  For shorter 5 point scales, we recommend labeling each scale point for clarity. However, this isn’t an easy task for longer 10 or 11 point scales as you quickly run out of space (particularly on mobile devices!). Therefore for longer scales, we recommend labeling the end points only. Whatever scale you go for, labels should only be attached to the appropriate single scale point.

Tip #4: When It Comes to Mid Points, Assess On a Case-by-Case Basis

Researchers like to include mid points for respondents who are undecided.

There is some evidence that neutral respondents will answer randomly if they don’t have a neutral option to pick; however, this point-of-view comes from the world of public policy research. Therefore, at InMoment we recommend a case-by-case approach and to include a midpoint if it makes sense. With satisfaction or agreement scales, it is more common to use a midpoint.

Tip #5: Avoid Scale Colors and Images 

Research has shown that coloring scales (even shades of gray) or adding images or icons (including smiley faces) is not recommended, as this leads to scales being inconsistently interpreted by respondents. Examples include colors being an issue for those who are color blind; and images, icons and smiley faces having different meaning for everyone, particularly those who are neurodiverse (which is estimated at 15-20% of the population).

There you have it—five best practices to help you avoid bias, optimise your surveys, and collect the most actionable insights possible. To learn more about best practice surveys, check out this paper on Transactional Customer Experience Survey Best Practices.

XI Café Podcast

Welcome back to the XI Café Podcast! The XI Café Podcast was created so that CX program owners around the world could join the conversation and learn from global businesses and industry experts about the latest experience improvement innovations in technology and research services, industry and market expertise, and customer (CX) and employee (EX) engagement best practices.

In this episode, Melanie Disse from Auckland-based CX firm—Melanie Disse Consulting answers questions such as:

  • How mature are Voice of the Customer (VoC) programs in New Zealand compared to other countries?
  • How does your organisation’s VoC program compare?
  • What can you do to elevate the level of VoC program maturity at your organisation?

Melanie is an experienced Voice of Customer strategist with over a decade of experience in CX, insights, research, and data-driven intelligence for some of the world’s leading brands. Melanie explains what drives VoC program maturity and how leaders can increase the reach and effectiveness of their programs to improve customer experience and drive better business results.

Where to Find the XI Café Podcast

You can listen to the podcast on Spotify and Amazon Music, but if you are eager to jump right in then you can click the play button below to start listening to this week’s episode!

More of a visual person? No worries. You can also find the video recordings off the XI Café Podcast on our YouTube channel!

Customer Lifetime Value

Cross-selling and upselling have formed the bedrock of brand aspirations for their existing customer base for a long time now. For several years, it was also one of four economic pillars (along with customer acquisition, customer retention, and lowering cost to serve) my colleagues and I used to frame customer experience (CX) programs for our clients. Using these pillars allows companies to spell their programs out in financial terms, which is essential to quantifying their impact and gathering support.

While cross-selling and upselling existing clientele is certainly important, there’s actually a much more holistic (and ambitious) way to approach new business opportunities within your customer base: drive customer lifetime value (CLV). Focusing on driving customer lifetime value won’t ‘just’ help with identifying upselling opportunities—it will facilitate and create deeper human connections with customers and ensure mutually beneficial relationships built on Experience Improvement (XI). Let’s take a closer look.

Casting a Wider Net

Keeping customers around for as long as possible to sell them as much as possible is a great aspiration, but as I’m sure you’re aware, it’s much easier said than done. However, I’ve been advising companies on this very topic for a long time, and while it’s not simple, what follows are a few best practices that can help you continuously and consistently achieve that goal in ways that are mutually beneficial to you and your clients.

First, if you haven’t already, expand the data sources that you use to understand what your customers are saying and how they perceive you. Many of the brands I’ve worked with for a long time are slowly coming to the realization that they cannot  stick solely to surveys or another singular data source to get customer insights and input. And, while surveys will continue to be important, they only give you part of the picture. Expanding your data repertoire to such sources as purchasing data, location-tracking data, web searches, social media, and online reviews is a must.

Next, it’s vital to take the long view when looking at your customer relationships. This may seem like an obvious tip, but you might be surprised at how many brands get caught up in the lure of “what can I sell you today?” without considering what seeds to plant for even more success tomorrow. Equally important is to understand how your competitors view this dynamic and what, if anything, they’re also doing to be proactive when it comes to building lifetime value.

Letting Customers Tell Success Stories

If there’s one thing I loved doing when I was on the client side as a CX program owner, it was telling  stories. I can speak from experience when I say that letting customers do the success storytelling is an amazingly powerful way to build lifetime value with them. Good storytelling can bring numbers to life, further personalize customers’ experiences, and it gets attention because customers and even employees generally relate more to stories told by, well, other customers.

Executives and program stakeholders love customer-told success stories too. Letting customers do the talking helped me gain mindshare, helped me secure budget, and created the sponsorship that I needed to help make my program better. This strategy also helps executives feel a human connection to your CX program; they love to hear stories about how the organization created a meaningfully improved experience for another person.

The Customer Lifetime Value Journey

The tips I’ve outlined here will help you start (or jump-start) your customer lifetime value journey, but how do you keep the ball rolling? What other methods out there can brands and organizations leverage to go beyond ‘just’ cross-selling and upselling?

You can find all of that and more by clicking here and reading my latest point of view article on customer lifetime value. You’ll learn what else your organization needs to do to create Experience Improvement and a more human connection to your existing customers!

XI Café Podcast

Welcome back to the XI Café Podcast! The XI Café Podcast was created so that CX program owners around the world could join the conversation and learn from global businesses and industry experts about the latest experience improvement innovations in technology and research services, industry and market expertise, and customer (CX) and employee (EX) engagement best practices.

In this episode of the XI Café Podcast we’re talking to Commonwealth Super Corporation‘s (CSC) Katie Bogg. Katie shares how CSC relaunched its CX program to transform the business from the inside out—this includes growing the CX team and launching a series of external and internal initiatives to increase member engagement, leading to a tangible uplift for the entire organisation and its members.

Where to Find the XI Café Podcast

You can listen to the podcast on Spotify and Amazon Music, but if you are eager to jump right in then you can click the play button below to start listening to this week’s episode!

More of a visual person? No worries. You can also find the video recordings off the XI Café Podcast on our YouTube channel!

Digital experience

Digital experience trends are the new road maps of modern day business. Are you still using a paper map to direct you when you’re driving to work? Of course not, you’re using your smartphone that tells you where you are, when to turn, and if there is an accident up ahead. 

Think of digital experience trends being the new maps application in your business. You aren’t waiting until the end of the year to get a mailed report containing consumer trends for the past year (hopefully), but rather you need to be keeping up with your consumers in real time. Identifying digital experience trends will help you adapt your business to get ahead of your consumer, not behind them. 

It’s no understatement that you—along with every other business for that matter—are operating completely differently than you did in 2019. The COVID-19 pandemic has changed the way that businesses, well, do business. It has also changed the way that your customers interact with you

Whether it be a customer, prospect, or non-buyer, every piece of the customer journey looks differently today than it did before the pandemic, particularly when it comes to the digital experience. Businesses have been forced into being digital-first. If you didn’t already have a digital presence, you were forced to adopt one, seemingly overnight. And post-COVID, if you haven’t already built a digital experience strategy, we hate to break it to you, but you’re already behind the buck.

Today’s customers aren’t going to be wooed by you just having digital options—they want you to supply truly innovative digital experiences. In other words, you don’t want to follow the digital experience trends, you want to be able to create them so your customers follow you. To help you out, our experts have pulled together a plan to help you mine the data that is going to help you uncover, and take advantage of new digital trends. Tune in below!

3 Steps to Start the Next Digital Experience Trend

  1. Build a Strong Foundation with Integrated Experience
  2. Strategize New Customer, Employee, & Non-Buyer Signals
  3. Don’t Settle for Snapshots—Aim for Actionable Intelligence

Step #1: Build a Strong Foundation with an Integrated CX Approach

Your customers are talking about your business across multiple different channels. Whether it be directly to you (via surveys) or indirectly (through review sites, social media, and the like), your customers are creating signals throughout their journey. However, most CX platforms are still primarily focused on surveys and traditional metrics (in blue in the figure below).

In order to be successful, it is important to have a CX vendor that enables you to do more than take a traditional approach to feedback. We refer to our modern approach to experience as an Integrated CX approach. 

As you can see in the figure below, Integrated CX takes into account all the new signals customers are sending and houses them in one place, the InMoment XI Platform. Having a central location for all your customer data helps create a clearer, more consistent picture of the customer journey, empowering you to make more informed, data-backed business decisions in the future.

Step #2: Strategize New Customer, Employee, & Non-Buyer Signals

Gathering data in today’s business environment is easier than ever before. But, the challenge lies in gathering data and linking it to meaningful business KPIs such as customer loyalty, customer acquisition, or generally proving program ROI

Below, you can see a graphic that illustrates the different feedback signals available today, and how they can be funneled into the XI Platform, then, leveraging the expertise of our Strategic Services Team and AI-Driven technology, you can go from just tracking metrics and scoreboard watching to using that data to uncover actionable insights that create meaningful improvement.

Step #3: Don’t Settle for Snapshots—Aim for Actionable Intelligence

When you export data out of a platform to analyze it, it is already somewhat outdated. Especially when considering the rapid evolution of social-based interactions, even data from the previous quarter might not accurately reflect how your customers are behaving. 

In order to get a better understanding of how your customers work, what they are looking for, and what the next digital trend might be, you need to be getting your data in real time in order to keep up with the fast-paced digital landscape and start the next digital experience trend.

Sounds like a fairytale? Well, to prove to you that it’s possible to have always-on, real-time insights, we leveraged the XI Platform to pull over 120,000 data points across the retail industry over the course of seven days using InMoment’s Integrated CX approach. From this data, we unearthed the following three actionable insights that you can use going forward: 

  • 1 of 3 emerging customers are more likely to interact with you through social signals, than traditional surveys
  • 60% of those customers have purchased/adopted a new product or offering via a social signal 
  • 1 of 2 customers are likely to select a brand that offers a “one-stop” solution, with additional incentives and features (such as buy now, pay later) 

 Once you have these insights, you are able to empower teams across your business to make informed business decisions and implement customer-pleasing digital experience trends. And once you act on the intelligence, you’ll be able to point back to your experience program as the catalyst to success.

Thinking Outside the Survey

Don’t feel pressured to do things the way they have always been done. As a matter of fact, if the history of social channels have shown us anything, it’s that you need to be willing to try something different in order to succeed. 

You’ll never fully understand your customers by just sending them surveys. But, if you interact with them through various social channels, you may be able to get a clearer picture of who they are, and what they want from you. 

Want to learn more about understanding your customers, and how to kickstart the next digital trend? Watch the full presentation here! 

XI Café Podcast

Welcome to the XI Café Podcast! In order to continue Experience Improvement, the XI Café Podcast was created so that CX program owners around the world could join the conversation and learn from global businesses and industry experts about the latest experience improvement innovations in technology and research services, industry and market expertise, and customer (CX) and employee (EX) engagement best practices.

In the first episode of the XI Café Podcast we’re talking to legalsuper’s CX Insights and Service Design Lead, Eslam Afifi. Eslam is a PhD & CCXP Certified Customer Experience (CX) lead with a proven record of designing and delivering CX programs across different sectors such as Financial Services, Government, Tourism, Oil and FMCG in Australia, Africa and Asia. His journey at legalsuper is worth talking about – we’ll hear how his team has leveraged customer data and insights to transform legalsuper’s operating model, affecting positive change for the business and its members.

Where to Find the XI Café Podcast

You can listen to the podcast on Spotify and Amazon Music, but if you are eager to jump right in then you can click the play button below to start listening to this week’s episode!

More of a visual person? No worries. You can also find the video recordings off the XI Café Podcast on our YouTube channel!

Failure Demand

My name is Ton Luijten, Customer Success Director + Data Science Lead in APAC—and in this post I’ll help you unlock a new take on ROI—through failure demand.

When we manage client programs at InMoment, return on investment (ROI) is always top of mind. We strongly believe this should be a top priority for any team trying to improve customer or employee experiences to show that they are positively contributing to the financial outcomes of their business. 

Most people will instinctively believe that by improving experiences we will improve retention, reduce customer churn, and lower business costs, but proving this is the hardest and most important part of proving your experience program is actually moving the needle at your organization. 

Let’s take a look at how considering failure demand can help you prove ROI.

First Up, What Is Failure Demand?

Failure demand is when an organization falls short of servicing customers on the channels they are seeking, which then causes demand for services in other channels. 

A classic example is a customer that wants to find information on a brand’s website, but they fail to find the information they need—this usually ends up with a call to the call center. 

Why Is Failure Demand Such a Fail? 

Failure demand is problematic for brands as it means the customer experience is not optimized and the customer cannot get the service where and when they want it—not to mention, there’s a cost to the organization to service this additional demand. 

By reducing failure demand, brands have an opportunity to both improve the customer experience, but also create positive financial outcomes for the organization. 

Where Do We Start When Reducing Failure Demand? 

To reduce failure demand, we first need to measure it. Ideally you would be able to use operational data for this, but there are a few problems with this method. If we revisit the earlier example—how does the organization measure that the customer visited the website before they called into the call center? If the customer mentioned this on the call, the agent could take a note of this for their file, but we know these notes are typically inconsistent and hard to analyze at scale. 

When I work with clients at InMoment, we’ve built custom text analytics sets to analyze call center notes—all with the hopes of understanding what customers are calling about. Then, brands can identify topics that attract large call volumes and work out which ones have the potential to be moved to cheaper channels (most likely online). While this is really exciting work, it does take an investment of time and money.

Another option for monitoring failure demand is to use web intercept technology with session recording to understand which journeys across the website cause the most dissatisfaction. 

However, with this option we’re already going into the space of asking customers for their feedback and not just relying on operational data. It also doesn’t allow us to find out what customers did after the failed journey, so limits our visibility on the impact on other channels.

So, What Can We Do To Reduce Failure Demand? 

I’m proposing an alternative option that’s simpler and leverages a solution that most organizations already have in place—post interaction surveys. These four questions will give you the information you need to measure failure demand and prioritize areas for improvement. 

Here are the questions to ask in your post-interaction survey: 

Question #1: Was Your Issue Resolved?


Most CX professionals won’t be surprised by this question as post interaction surveys typically include something of this nature. It’s particularly important for measuring failure demand because you don’t want to cause repeat calls. Of course, it’s also a poor experience for the customer.

Question #2: How Many Times Have You Contacted Us to Resolve That Issue?


It’s important to ask this when measuring failure demand because we want to avoid repeat calls and try to close out issues as quickly as we can.

Question #3:  What Channels Did You Use to Resolve This Issue?


This is a multiple choice question, so customers can select all the channels they have used. This is really important as it allows us to understand which channels they used and how many they used. The latter is critical for failure demand.

Question #4: What Is Your Preferred Channel to Resolve This Issue?

The list of answer options is dependent on the selection made at the previous question. By combining this question with the previous one, you can figure out which channels the customer has actually used and which one they would have preferred to use. This insight allows you to prioritise which improvements you need to implement for the different channels and reduce failure demand, as you will be able to resolve customers’ issues via their preferred channel, which means they no longer need to use multiple channels.

Wrapping Up

Of course, these four questions are contingent on the organization understanding what the original issue is. If we don’t have that information, we should also work that question into the post-interaction survey.

By combining all this information, your brand will have the magic formula—you’ll be able to understand the current state of failure demand, identify key areas for improvement to take action, and measure progress over time. 

Analysis of variance

After you do a study or research, you will probably want to know if the results you got mean anything. More specifically, you want to know if there are statistically significant differences between the groups you studied. After all, statistically significant results help you know that what you studied—the variables you chose—are having an impact on the results. 

For example, let’s say you did research on your customer base, and you wanted to determine if certain age groups bought your product more than others. Once you have your data, you need to determine if there’s any statistically significant difference between the age groups. How do you do that? 

One way to determine if there are statistical differences between groups is to do an analysis of variance also called ANOVA. What is analysis of variance? Read on to learn more about ANOVA tests and how to use them for your own analyses. 

What Is Analysis of Variance? 

Analysis of variance or ANOVA is a statistical test developed by Ronald Fisher in 1918, and it’s been used by statisticians and researchers ever since. The analysis of variance test is a way to compare means from different groups and determine if the differences in those means are statistically significant. If they’re statistically significant, that means the variable for that group is having an impact on what you’re researching. If they’re not statistically significant, then your variables aren’t affecting what you’re studying. 

Let’s revisit the example from earlier. You wanted to determine whether 18–24 years old, 25–35 years old, or 36–45 years old buy your products more. You gather all of your data about how much people are buying based on a random sampling. You determine the mean for each age group on product purchases. ANOVA is then how you can determine if there’s a statistically significant difference between those means. 

An analysis of variance test will take into account the sample size and differences between means to give you an F value. The F value can then be analyzed to give you a probability or P value—or the probability that there’s a statistically significant difference. Let’s say you get a P value of 0.03. That would mean your results are statistically significant, and you can reject the null hypothesis. Most likely, that would mean you can determine that age is a significant variable in who buys your product, and you could consider making marketing decisions based on that. That’s the power of ANOVA. 

How Does ANOVA Help? 

At the core of it all, ANOVA helps you determine what variables have statistical differences and what variables are important to look at in more depth. Even more importantly, ANOVA can give you a glimpse into the motivation behind behavior. What’s driving customers to click on a link? ANOVA might help you determine that. Essentially, ANOVA helps by giving meaning to numbers, direction to actions. 

Types of ANOVA

ANOVA is a broad category for several types of tests. The big two to discuss are one-way and two-way ANOVA tests. A one-way ANOVA test is the simplest form of ANOVA. For this test, you’ll need one independent variable and two or more levels. For example, you could use the months of the year as levels but still only test one variable. Two-way ANOVA or full factorial ANOVA is when you have two or more independent variables to test. Two-way ANOVA measures independent variables against each other and if independent variables affect each other. 

There are a couple of other types of ANOVA to consider: 

  • Welch’s F Test ANOVA. The Welch’s F Test doesn’t assume the variances between groups are equal, which can be beneficial for some data sets.  This type of unranked ANOVA test works when there are two assumptions that are true about the data: 
    • The sample size is 10 times greater than the calculation group (satisfying the Central Limit Theorem)
    • There are few or not outliers in the data distribution
  • Ranked ANOVA. If these assumptions above don’t hold, you can instead use a ranked ANOVA test. Ranked ANOVA tests can hold up against outliers and non-normal distributions because the values are replaced with a rank ordering. 
  • Games-Howell Pairwise Test. This ANOVA test doesn’t work with the assumption that variations between distributions are equal, and it’s a test when there’s a higher likelihood of finding statistically significant results. 

ANOVA Terms to Know

There are some important terms to be familiar with to work with an analysis of variance test. Here’s ANOVA terminology that may be important for you: 

  • Independent variable. This is the variable that you choose to change, and you’re studying how it will affect the dependent variable. 
  • Dependent variable. Variables that don’t change and are instead affected by the independent variable. 
  • The null hypothesis. When you do an analysis of variance, you will have a pair of hypotheses. The null hypothesis will be the one that says there is no difference between the groups you’re looking at. If your p value is less than 0.05, you can reject the null. If not, you fail to reject the null hypothesis. 
  • The alternative hypothesis. Your other hypothesis is that there is a difference between the groups. 

The Formula for Analysis of Variance

The formula for ANOVA is F = MST/MSE. That may look simple, but it involves a few more numbers. The MST is your total sum of squares (all of your means put through a formula) divided by the population total minus one. That gives you the top value for the ANOVA formula. MSE is your sum of squares with error divided by the number of observations minus one. Once you have both variables, you divide the MST by the MSE, and that gives you the F value. With your F value, you can use an ANOVA chart to determine the p value, which will tell you if you can reject the null hypothesis or if you fail to reject the null hypothesis. 

How to Run an ANOVA

That formula can get tricky when a lot of numbers are involved, so not every statistician, researcher, or analyst does ANOVA by hand—though it can be calculated by hand, thanks to creation before computer programs. Instead, most researchers use computer software and programming to perform the test. R, Stata, SPSS, and Minitab are great choices for running an ANOVA test accurately and quickly. 

Drawbacks to an Analysis of Variance Test

An ANOVA test will tell you that there is a difference between means and if that’s statistically significant. But ANOVA won’t tell you where that difference lies. For example, let’s return to our earlier example. You’re testing three age groups for your product purchases. The ANOVA test will tell you that age is statistically significant, but it won’t tell you which group is the one with the biggest difference. You’ll need to do additional statistical tests to determine which age group is most interested in your product. 

Analysis Is Easy with InMoment

Statistical tests can be overwhelming, including ANOVA. While it’s always possible to do an analysis of variance on your own, it’s usually easier and more accurate with some support. InMoment is here to help. Whether you’re conducting a survey, research, or analysis of variance, the process just got a lot easier with InMoment. Book your demo today and see how you can simplify your processes.

Voice of Franchisee

Earlier this year, InMoment hosted an XI Forum with two incredible speakers—both of whom run experience programs for franchisees. Steve Grossrieder, CEO of JAX Tyres & Auto, and Jess Gill, Chief Customer Officer for Craveable Brands, know exactly what it takes to keep franchisees inspired, and make sure experience programs stick across the organization. 

Here Are Your Questions Answered by the VoF Experts:

Expert #1: Steve Grossrieder, CEO and Managing Director at  JAX Tyres & Auto

Q: ​Your NPS at the franchise level is incredible. How do you train staff in the franchises to instill customer experience in all that they do, maximizing sales?

A: ​We hold best practice and networking sessions in each region with small groups of franchisees to discuss CX best practice and to show our main pain points and how to implement simple procedures to improve these. We also develop CX action plans for all stores under 75 NPS on a monthly basis which shows their detractor feedback analyzed, how they compare to the network and potential actions based on their individual insights to improve their NPS. Additionally, our service proposition is centered around our JAX inspection report—we focus our franchisees on this proposition to deliver our consumer promise to peace of mind driving and our sales naturally translate from identifying customer vehicle issues through the inspection process which is transparent and customer centric.

Q: ​How and what do you share with franchisees from a CX scoring perspective, and how frequently?

​All franchisees have access to their stores individual CX results including their stores NPS, channel performance, monthly comparison trend (compared to the network), as well as text analytics split by promoter, passive and detractor. They also have a case management section which shows customers who have asked to be contacted showing the JAX SLA time to review and resolve with the aim to retain their customers. 

Additionally, we share the monthly CX results via a monthly report and internal newsletter showing the ten highest and ten lowest scoring stores, top complaint trends and insights for that month as well as tips and best practices to implement to ensure a consistent experience across the network. We also have multiple digital screens displaying our CX results throughout head office (updated hourly) and our monthly NPS and a selection of customer feedback is displayed on our website and intranet for consumer and franchisee transparency.

Q: Please share more on how you managed to show a clear link between CX improvement and ROI or sales improvement? It’s often a challenge in many industries.

A: Initially this was a challenge; however we have been able to establish (with historical data) the clear link between a higher than average network NPS and the gross profit that these stores make above the network average. We now have clear examples of stores increasing their NPS and their increase in gross profit follows on with a two to three month lag period. NPS has now become a key gross profit lead indicator which we have demonstrated multiple times across the business and now do it store by store to promote culture change and customer centricity.

Expert #2: : Jess Gill, Chief Customer Officer at Craveable Brands (Oporto, Chicken Treat, Red Rooster)

Q: Which channels does Craveable Brands use to capture customer feedback? 

A: We use QR codes, email to loyalty customers, Digital Intercept (an InMoment application on the XI Platform empowering brands to capture real-time data from their website visitors) and customer panels.

Q: How do you win back your customer? How do you capture it? How do you let your customer know that your company is implementing their feedback? 

A: We win back customers by training staff (in person) that it is okay to own up to errors and to make them right, running our case management program. As for any feedback for the head office, that gets directed to the right people—for example, we made changes based on feedback to bring back our old nugget recipe, and we went back to each of those customers to let them know.

Q: How do you consider feedback through third party apps such as Menulog, Deliveroo, etc? 

A: Craveable Brands’ post-transaction survey asks about delivery partner feedback to feed back to them. The feedback collected by delivery partners remains separate from our VoC program today though we look to integrate to have one view down the track.

For more ideas on launching a successful voice of franchise program that actually benefits your business, check out our new paper: https://inmoment.com/en-au/lp/launching-a-voice-of-franchisee-program/

Experience Improvement is InMoment's Mission

Just discovered InMoment? Curious to know a little more about us and our differentiated Experience Improvement (XI)? Well allow us to introduce ourselves! 

Own the Moments That Matter

At InMoment, we have this saying: “Own the Moments That Matter.” This is fundamental to our mission, because those moments—packed full of emotions, judgements, learnings, and more—shape the world we live in. And with every moment, there is an opportunity to make a positive impact; to leave a mark.

But when it comes to your business, there are simply some moments that matter more, to your customer, employees, and beyond. 

Our goal is to empower you with the data, technology, and human expertise necessary to identify the moments that matter, understand what’s working (and what might need improvement), take informed action to solve business problems, and ultimately provide a truly differentiated experience for your business. 

Our CEO John Lewis said it best: “InMoment’s unique combination of world-class technology and expert service enables clients to integrate growing and disparate customer signals and separate predictive understanding from the noise.” 

What Is Experience Improvement (XI)?

Despite increased investment, experience management programs have plateaued. Why? 

Because experiences don’t need to be managed or measured, they need to be improved.

The truth is that monitoring services and D.I.Y. approaches aren’t enough for today’s businesses; they cause program stagnation and make meaningful return on investment (ROI) impossible. Instead, what’s required for success is a new approach: an Experience Improvement (XI) initiative that solves the biggest business challenges, like retention, growth, and cost savings

The Moments That Matter

Improving experiences begins with sifting out the noise from experience data and identifying the moments that matter: where customer, employee, and business needs meet. This allows businesses to prioritize their focus on high-emotion, high-impact areas and connect with their most valued customers. Additionally, businesses can empower their employees to recognize and take action in these moments, ultimately culminating in organization-wide transformation from the boardroom to the break room. 

Data, Technology, and Human Expertise

Experience Improvement is made possible through our industry-leading Experience Intelligence XI technology and our in-house Experience Improvement (XI) services teams. With our ability to collect and gather data from anywhere and in any form with our Integrated CX approach, industry-leading technology, and decades of experience in key industries, InMoment can help you craft an experience initiative that truly meets the unique needs of your business. We are dedicated to being more than just a vendor to our clients—instead we take the role of a dedicated partner committed to a businesses’ short- and long-term success.

The Intersection of Value

Our mission is to help our clients improve experiences at the intersection of value—where customer, employee, and business needs come together.  Ultimately, our clients are able to move the needle and go beyond managing their experience to actually improving it. With the right intelligence, businesses can empower the right people to take transformative, informed action in the most effective ways and drive value across four key areas: acquisition, retention, cross-sell & upsell, and cost reduction. In other words, better results for the business and better experiences for their customers and employees.

The Continuous Improvement Framework

The key to taking an experience program beyond metrics is to move beyond monitoring customer feedback and stories and focus on the formation of actionable plans for changes informed by them. Customer narratives contain meaning that companies can use to diagnose both superficial and deep-seated problems, define remedies to those problems, positively impact the bottom line, and create more meaningful experiences. We help our clients  achieve all of this by sticking to a simple, five-step framework that we call the Continuous Improvement Framework: define, listen, understand, transform, realize. (You can read all about it here!)

What Third Party Analysts & Customers Say About InMoment

And don’t just take it from us—InMoment has received third-party validation from multiple third-party research firms. We have been named Leaders in the Forrester Text Analytics Wave, Forrester Customer Feedback Wave, the Gartner Magic Quadrant for Voice of the Customer, and more! 

Forrester Text Analytics Wave

InMoment received the highest possible score and was named Leader in the Text Analytics Wave report. The Forrester Wave says, “InMoment XI is a solid choice for customers who want a platform with a well-balanced mix of knowledge and ML-based AI, the ability to deploy OOTB solutions quickly, and deep custom application development capabilities.” As mentioned in the report, “InMoment’s people-oriented text analytics capabilities…enable it to address all relevant use cases beyond just VOC or CX analytics.” 

Forrester Customer Feedback Wave

InMoment was also named a Leader in Forrester’s Customer Feedback Wave Report. The Forrester Wave  says, “InMoment is a good fit for organizations looking for a ROI-focused technology and services partner.” As mentioned in the report, “reference customers say they selected InMoment for its technology capabilities and value citing the vendor’s pricing as reasonable and transparent. They also praise the vendor’s partnership and focus on delivering outcomes. References appreciate that not everything is “tool driven;” instead, the vendor  provides strategic guidance, helping them innovate their approach to surveys or embrace new forms of feedback. 

Gartner Magic Quadrant for Voice of the Customer

Furthermore, InMoment was named a Leader in the Gartner Magic Quadrant for Voice of the Customer. The report says,  “InMoment is a Leader in this Magic Quadrant. The company’s Experience Improvement (XI) Platform combines a broad set of VoC technologies as part of an  integrated offering that focuses on blending services and  software to help fulfill its clients’ evolving CX ambitions.  The company has established operations around the world,  with a notable presence in Asia/Pacific.” Continuously, the report mentions,”InMoment is investing in intelligent self-service and workflow automation to help simplify the user experience (UX), while  furthering its vision to support four tailored XI clouds for  CX, employee experience (EX), product product experience  (PX) and market experience (MX).”  

“InMoment has an impressive ability to deliver business value through its consulting-led methods and programs.” – Gartner Magic Quadrant for Voice of the Customer

Industry Dominance

Not only have we been recognized by multiple market research firms, but our success is also shown in our reach across multiple industries. InMoment is currently improving experiences with: 

  • 90% of the world’s leading automotive brands
  • 8/10 of leading banks
  • 4/5 of the top insurers

And one more thing. 100% of our clients would recommend us. 

Recognized as a leader and innovator in our sector, we collaborate with the world’s leading brands to attract, engage and retain their customers. We are fiercely proud that our clients continually tell us they love the experience of working with our company, as we constantly stretch to exceed their expectations. 

Our Experience Improvement (not management) approach provides context to feedback at the intersection of value—identifying what’s important to customers, employees, and the business. Our expertise enables brands to align their CX and EX programs with business goals, prioritize actions, determine and monitor impact of change, address issues, and celebrate successes—all leading to true Experience Improvement.

Does this Experience Improvement (XI) mission align with your vision? You can learn more here!

Sample Size Formula

There’s a lot that goes into creating statistically sound research, but few elements are as important as getting the right sample size. This is because the size of your sample can have a direct impact on your findings. If your chosen sample is too small, your results will likely be inconclusive. On the other hand, overly large samples can make minor differences appear statistically significant while also increasing the time and resource demands of collecting and cleaning the data.

Unfortunately, understanding the need for correct sample sizes and understanding how to select the right sample sizes are two different issues. For effective sample size determination, many researchers rely on the sample size formula. 

Here, we’ll walk you through the sample size formula and how to apply it. But first, let’s take a look at what “sample size” means.

What Is a Sample Size? 

Sample size is a term used in research and statistics that defines the total number of subjects, samples, or observations included in a survey or experiment. 

For example, if you were to interview 50 travelers about their air-travel experience, then your sample size would be 50. Similarly, an experiment that makes daily observations regarding soil content over the space of one full year would have a sample size of 365. And if an online survey were to return 11,328 completed questionnaire forms, then that’s a sample size of 11,328. Simply put, the sample size is the number of samples you’re interacting with.

Sampling allows researchers to select a representative portion of an entire population; to expand on one of the examples provided above, an airline that chooses the right sample group can hopefully draw meaningful and accurate conclusions from interviewing 50 travelers, instead of having to interview every traveler who flies on a plane. 

As previously addressed, sample size plays a key role in any statistical setting—from lab experiments to employee surveys—and is a vital factor in any research project.

What Is the Sample Size Formula?

The sample size formula is a calculation for determining what sample size is appropriate to ensure that the test has a specified power. To do this, we must first calculate the sample size for an infinite (or unknown) population, after which we will adjust our sample size to fit the required finite (or known) population. 

Sample Size Formula: Infinite Population

S = Z² x P x (1 – P)M²

Adjusted Sample Size Formula: Finite Population

Adjusted sample size = (S)1 + (S – 1)Population

In these formulas, the variables are expressed as follows:

  • S = The sample size for an infinite population
  • Z = The Z-score (determined based on the confidence level)
  • P = The population proportion (assumed as 50%)
  • M = The margin of error (typically taken as 5%)

Applying the Sample Size Formula

The formulas presented above may be used to correctly determine viable sample sizes, but before that can be put to work, the values of the various variables need to be defined. 

To correctly apply the formula, follow these steps:

  1. Determine Your Key Values
    The primary key value in this equation is the total population size within your target demographic. Where possible, be as accurate as you can in determining the population number—this will allow for greater statistical impact, particularly when dealing with a small population size. That said, larger populations may allow for some approximation (such as rounding to the nearest hundred or thousand).
  2. Determine Your Margin for Error/Confidence Interval
    Although you want your study to be as precise as possible, it will never be completely accurate. Understanding how much error can be allowed in the study is essential to correctly presenting your findings. This is called the margin for error and is usually represented as a percentage detailing how close the sample results should be to the true value. Smaller margins of error produce more accurate results, but also require larger sample sizes. The margin for error is typically expressed in results as a +/- followed by the percentage.
  3. Set Your Confidence Level
    Similar to the margin of error, the confidence level describes and measures how certain the study is about the accuracy of the sample’s representation of the total population. This is expressed as a percentage, with a higher percentage indicating greater confidence; most studies try to operate within the 95%–99% confidence range—less than that could cast doubt on the validity of the results.
  4. Specify the Standard of Deviation
    The standard of deviation details how much variation you can expect from the results of your study. Will the results be very similar, or are they likely to be spread out? Extreme answers where there is a high deviation are often more accurate. It’s generally accepted that a standard deviation of 50% will help ensure a large enough sample size to correctly represent the population within the margin for error and confidence level.
  5. Determine Your Z-Score
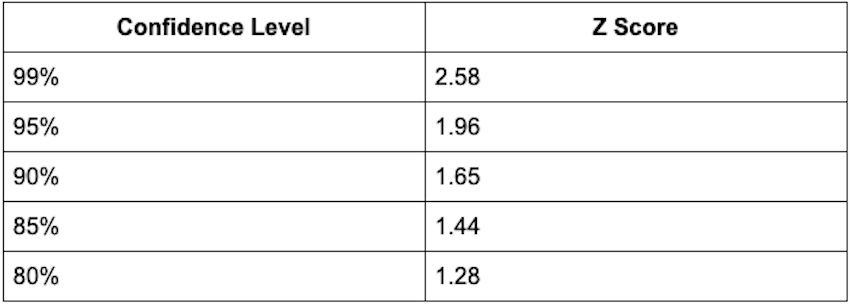
    Finally, the Z-score is a constant value showing the number of standard deviations between the average/mean of the population and any specific value. The Z-score corresponds directly to the confidence level, with the most common confidence levels corresponding to the following Z-scores:
Systematic Sampling confidence level to Z score conversion.

Conclusion

Determining your sample size is the first step in any market research project. Whether you decide to use systematic sampling, simple random sampling, or are looking to alleviate voluntary response bias, you’ll need to identify your sample size before you can take those actions—and improve experiences!

Change Region

Selecting a different region will change the language and content of inmoment.com

North America
United States/Canada (English)
Europe
DACH (Deutsch) United Kingdom (English)
Asia Pacific
Australia (English) New Zealand (English) Asia (English)