Weekends in my household are often consumed by time well spent with my wife and two young children, who enjoy everything from hide & seek and board games with crazy rules, to baseball and bike riding.  While I love these activities and the family memories they create, I too enjoy weekend time spent alone on personal projects around the house.  I call these “garag-ects”—projects generally accomplished in the garage.

Over the years, the bikes and sports equipment, toys and old ping-pong table, tools and materials have taken over my work space, each time requiring me to prepare a space to get started. It’s an unmotivating and incredibly inefficient environment, but I know that until I dedicate the time to organize the space required to tackle many garagectsin a single weekend, I will continue to lack the motivation and resources to engage in even a single item on the growing list of ‘to-do’ items.  In years past, I found myself able to fill a weekend with a list of accomplishments and was highly productive in the garage.  When I could start and complete a garagectin one sitting, I found myself entirely engaged in the process and motivated by the accomplishments each completion would bring.

Perception of Productivity Drives Employee Engagement

In this way, I have something in common with the vast majority of employees who work in any role across all types of industries and organizations.  Perhaps not just the family aspect or the growing list of projects in the garage, but the continuous intrinsic need to be productive in order to feel truly engaged.  In fact, research suggests that employee happiness and engagement at work is driven by the perception of productivity – an employee’s sense of being able to effectively execute his or her duties and role for the organization in an effective and efficient manner.  Coupled with the ability for an employee to see his or her contribution, the feeling of productivity is powerful in establishing and maintaining high engagement levels.

The social and physical environment for an employee in the workplace may be just as important as an organized garage when it comes to enabling a higher sense of productivity.  As organizations invest in employees by regularly asking for feedback and insight in order to make effective changes and promote a culture for employee-generated insights, it can be valuable to include measures that connect productivity and the outcomes of the work done day in and day out.

Bridging Concepts of Productivity with Employee Surveys and CX Measures

Many organizations are beginning to find ways to include such measurement within regular employee engagement surveys, where for example, employees are presented with specific items connecting the concepts of productivity while also bridging data between employee surveys and customer experience measures.  These items may cover processes & procedures and incentives, to goal-setting and technology, and might include items such as;

  • Our organization always acts in the best interests of our customers.
  • Our organization eliminates processes and procedures that interfere with best serving my customers.
  • Staff in our organization are given incentives to provide the best possible service to our customers.
  • My co-workers consistently think about how to better serve our customers.
  • Our organization hasformal programs and processes for improving customer experience.
  • Our organization sets specific goals for achieving and improving customer experience.
  • Our organization effectively uses technologyto deliver a consistently positive customer experience.
  • Our organization commits the resources required to exceed the expectationsof customers.

employee engagement diagram

Such measures offered to employees serve as a great way to connect traditional siloes between HR and CX Professionals who independently measure the employee and customer experience respectively and provide a mechanism for employees to weigh in foundational concepts affecting their work and the outcomes for customers.

Asking the Right Employee, with the Right Measures, at the Right Time

Another growing strategy organizations are deploying includes the use of employee experience (EX) surveys to monitor the more standard aspects of the employee life cycle.  This process includes asking the right employees, the right measures, at the right time – while they are top of mind and while the employee is most invested in a particular experience.  By measuring the initial impressions of an organization during the recruitment and hiring stages, through onboarding and acclamation, to communication and recognition, and typically ending with exit experience, an organization can identify employee-driven ideas for improving the experience in each of these areas affecting nearly all current and future employees.  These surveys can be administered in a more intelligent, automated fashion by leveraging employee record files to distribute certain survey types based on tenure, employment events (such as promotion or training) and communication processes by the organization, including quarterly townhall meetings. By including even just a single item on an employee’s perception of productivity, the organization can better identify quick wins across processes in the employment life cycle to improve this concept and engagement.

Make Sharing Experiences Easy

One other emerging trend includes the use of open-ended prompts, either as part of the regular employee survey process or as part of an open listening strategy where employees can share a story/idea at any time through a dedicated portal or open exchange.  Just as we do as customers when we experience something very positive or negative, employees also want to share their stories.  One positive and inspiring method is to provide a mechanism for employees to identify any instances where colleagues, processes, or the work environment allowed them to be overly productive and/or provide an exceptional experience to a customer.  Every employee has days where, from their vantage point they accomplish an incredible feat or series of feats in one day.  Providing opportunities for employees to share these stories will generate ideas for how to foster such productivity while recognizing employees for their accomplishments.  Such stories can even be shared publicly in electronic employee boards and in recognition mechanism across the organization to further drive engagement.

Speaking personally, I can physically feel the difference in my engagement when I’m in an environment that promotes focus and productivity.  Whether provided to me by the leadership at my place of work, or self-created in my garage, my working conditions including the processes, tools, space and people should foster productivity and be intentional in design to allow for my best work.  When this occurs, I’m most likely to remain engaged in my efforts and connected to the purpose of my work.  In my case, this means a weekend engaged in making my garage a more productive environment.

Airport Series: McCarran and Las Vegas

When an airport company reviews social data they need to be able to find the signal in the noise. Airports and the cities they serve are often confusingly interchanged on social media. In this article, we use filters and a custom configuration to see exactly what people are saying about McCarran International Airport.

Pop-quiz: what do you think of when you imagine Las Vegas?

Prostitution, gambling, hotels, and recreational marijuana might come to mind. But rather than fighting these associations, Las Vegas’ McCarran International Airport embraces them.

For example, the airport has “pot amnesty boxes”, where people can dump their legally-purchased weed in the event they’re traveling to a state or country with stricter regulations. And they’ve installed slot machines in the terminal, so travelers can get a jump on their gambling.

Or, as one Facebook reviewer put it, “try for one last hurrah.”

Figure 1: A pot amnesty disposal at Las Vegas McCarran International Airport

A city and its airport

However, this inextricable link between a city and its airport can pose a problem for a business analyst. For example, we recently sourced thousands of reviews from Las Vegas McCarran International Airport’s Facebook page. While analyzing this data set we discovered an interesting phenomenon: reviews on their Facebook page frequently criticized not just McCarran International, but also the city of Las Vegas itself.

Of course, listening to natural language reviews of Las Vegas is interesting. But it’s not useful for a business analyst tasked with understanding how customers experience the airport.

Finding the signal in the noise

To cut through the noise, we configured an analysis to extract what’s being said about McCarran International Airport based on reviews that mention both McCarran and Las Vegas.

To do this, we used Lexalytics’, an InMoment company, web-based dashboard, Semantria Storage & Visualization (SSV). SSV allows any business person to create configurations and run an analysis, even if they have no previous experience with data analytics.

Figure 2: Tuning a configuration in Semantria Storage & Visualization is a simple as point-and-click

To start, we used the SSV configuration builder. We can easily train the analysis to recognize sentiment in the text data set pertaining to other brands, such as the airlines flying into the airport, or even the city of Las Vegas itself.

Figure 3: By pulling out unrelated topics we can understand how people discuss elements related to “Las Vegas” the city, like “city infrastructure,” which might be confusingly lumped into the conversation about “Las Vegas” the airport

First, let’s take a moment to appreciate how the sentiment surrounding “vice” is only positive. In Las Vegas, it seems, vice is virtue!

Now, let’s pull this apart. In this data set, many customers complain about construction on the highway and roads leading to the airport. If our hypothetical business analyst working at the airport doesn’t configure their analysis properly, complaints about this roadwork may impact the sentiment score for McCarran. This will skew the results of the analysis, as civic works, like road construction, are outside the purview of the airport.

However, accounting for this can be tricky. Take this Facebook comment from March 2017, in which a customer complains about road construction:

“Our experience with the airport was overall great no problems at all I just don’t understand why car rentals can’t cooperate and have transportation inside the fence. Then there’s traffic congestion and detours everywhere. A 5 minute trip takes 15-20”

A properly-configured data analytics tool can split this review into its components.

For example, our own Semantria will sort this comment as positive for the airport, while identifying the other entities involved. In this case, “Overall great” adds +0.2 to McCarran’s sentiment score, while “car rentals” and “city infrastructure” get dinged -0.16 and -0.19 respectively.

Working with airport partners

Within any given airport, customers are exposed to numerous third-party vendors and agents. By tuning our analysis, we can focus on conversations about airlines, rental car agencies, and the TSA — all of which are operated by authorities independent from the airport.

Ultimately, these insights will help airport stakeholders share valuable intel with the brands that act as airport ambassadors every day. Furthermore, an analysis like this allows the airport to drill down into relevant conversations where they might affect change.

McCarran customer insights

Overall, analyzing Facebook reviews of McCarran International Airport shows us a mixed bag of opinions. There are some complaints about the cost of food and beverages (although we could say that high prices are inevitable, as the airport shares the retail concession with their restaurant partners, driving prices upward).

A whopping 48% of baggage handling reviews are negative, citing lost, damaged, or delayed luggage. If baggage isn’t delayed, the customers are. Many comments focus on out-of-service doors, people movers, and more.

Says one commenter on Facebook:

“Looked great with the Welcome to Vegas signs BUT couldn’t get to baggage collection as the doors were broken, no airline or airport staff or signage to say how to take a different route. You guys may know it, but visitors don’t!”

Speaking of signage, wayfinding is a consistent problem. As we’ve learned in the past, wayfinding is crucial to the success of an airport.

There are places where McCarran outshines the rest. In 2005, the airport became one of the first to provide complimentary Wifi. Thanks to an emphasis on network friendly infrastructure and regular uptime airline passengers are able to enjoy complimentary unlimited connection even while their on the tarmac. Stuck on a grounded flight? Now you may connect to an LAS branded wifi hotspot and while away the delay. This brand experience goes a long way in promoting customer retention. The emphasis on wifi as a customer experience touchpoint is something an airport company can suss out using text analytics. And, as we’ve pointed out with other examples, this intel can then be baked into the very fabric of the facility.

This fact is reinforced by Samuel G. Ingalls, assistant director of aviation, information systems at LAS, “By the time we started construction on our new Terminal 3, which opened in June 2012, we had a pretty good idea about where to place the Wi-Fi antennas for maximum effectiveness.” The work on expanding network connection onto the tarmac was put to a test in 2015 when 170,000 tech oriented conference attendees descended on Las Vegas. Mr. Ingalls and his team might’ve used text analytics to mine feedback about the experience of these power users, identifying any problem areas. “I saw many people around the airport with at least three devices.” reported Ingalls. “And we didn’t get any negative feedback from these attendees, who used the Wi-Fi system both inside and outside the terminal. I considered that a very positive sign.”

What should McCarran do with these insights?

McCarran might use this social data to design a 2019 budget aimed at solving problems real customers encounter every day. Natural language data is the single best resource for businesses to make profitable decisions. Now, with tools like Semantria Storage & Visualization, all stakeholders in a business may leverage this resource, even if they have no data analytics experience.

Editor’s note: This is a chapter from the ebook, Unlock the Value of CX. You can download the entire book here.

Most organizations strive to ingrain in their employees a set of organizational values–behaviors and attitudes–that are the guiding principles for all employee actions. These values are often expressed as brand promises–statements about what an organization is, what it stands for, and what it will deliver to its customers.

Brand promises can be implied as well as expressed, if customers are used to a particular level of service based on their previous interactions with the company. Brand promises work best when they are realistic and actionable, targeted to the organization’s customer base and clearly linked to every customer interaction across the organization.

Meeting Brand Expectations at Every Level

The ability to meet brand promises at every customer interaction, however, eludes too many organizations. Brand promises are often set from the top of the organization and performance metrics for executives are often tied to them. However, when it comes to brand behaviors being practiced at the point of customer interaction, the results are not always consistent or satisfactory. This causes some customers to leave the interaction disappointed and frustrated.

The problem is often magnified in companies undergoing changes. As organizations grow, they often reach a state where they develop competing priorities such as, a need to cut spending to reach profitability targets or a mandate to introduce a new product or benefit.

Executives often fail to question whether changes across the organization will impact their ability to deliver on the existing brand promise. The impact is not limited to marketing or product functions. Changes to any function should be considered in terms of its downstream customer impact. Every function, from marketing, product, risk, operations and finance to human resources and compliance, has a role in fulfilling the brand promise. Each function must own its impact on the customer experience.

Take for example, a bank’s underwriting department. As a result of a recent audit, is now required to perform manager-level reviews of a greater percentage of applications prior to approval. If the leaders collectively fail to ask for more underwriting managers, the approval timeline for applications will increase, and the trickle-down impact will likely be severe. If the product and marketing teams at individual branches are not informed about this change, customer complaints will begin to build and customer satisfaction will suffer.

Seven Strategies to Prevent Brand Erosion During Organizational Transformation

The solution requires ownership by the entire organization. Below are seven strategies to avoid setting brand promises that are untenable and avoiding brand promise erosion when organizational changes happen.

1. SET THE TONE FROM THE TOP. Brand promises are often built by a chief marketing officer or branding executive in conjunction with a branding agency. However, every executive function should be involved in this effort to confirm the positioning is feasible. Once alignment exists around the brand promise, the CEO must set the tone. It is imperative for employees to be empowered to deliver on the brand promise at every customer interaction.

2. APPOINT A CHIEF CUSTOMER OFFICER. A chief customer officer is part marketer, part ombudsman, part efficiency expert and part operations expert – and fully committed to the customer journey. The best CCO is often someone experienced across various functions who can support the customer journey design from multiple perspectives. This customer champion must be willing and able to converse with peers from across the organization to ensure alignment with the brand promises, develop and lead efforts to assess impacts on the customer journey, and influence every other function to achieve the end goal of delivering the brand promises.

3. DESIGNATE A CUSTOMER COMMITTEE. It is common for organizations to have corporate committees, often aligned with executive functions, to support efforts ranging from compliance to risk to finance. A customer committee, consisting of cross-functional senior executives, will similarly support the customer experience effort and provide it with the emphasis it deserves.

4. ENGAGE IN CUSTOMER JOURNEY MAPPING. Create a cross-functional team consisting of product, marketing, risk, technology, operations, finance, human resources and other key functions to engage in exercises that map the actual customer experience. This may include what customers are trying to do, what they are feeling, what is going on behind the scenes in operations and technology, what moments of surprise, delight or unnecessary friction exist, and which interactions meet or fail to meet the brand promises. Then, develop a target customer journey that meets the brand promises with the appropriate level of friction, and chart a road map to achieve it. Think about the impacts on people (customers and employees), process, product and technology. The customer journey map should be owned by the chief customer officer and each key stakeholder in the journey. It should be updated each time a change to people, process, product or technology is considered.

5. MEASURE CUSTOMER SATISFACTION AND CLOSE THE FEEDBACK LOOP. Many, if not most, organizations have invested in customer satisfaction monitoring of one type or another and implemented scoring methodologies with which to keep track. However, monitoring alone won’t move the needle on customer satisfaction. The keys to the success of customer satisfaction monitoring are 1) implementation of a feedback loop, and 2) understanding drivers behind changes in macro-level satisfaction scores. Qualitative information about a poor experience (a low score) from a customer is an indicator that something has gone wrong. When multiple survey responses are similar, that’s an indicator that a process is broken. It is important that organizations not only monitor feedback but also assign owners of the feedback loop for each key step in the journey. When a customer provides negative feedback, the journey owner must reach out to the customer, acknowledge the issue and commit to a response. They must then investigate, engage in internal communication, develop a plan to rectify problems (if needed) and follow up with the customer.

6. DEVELOP CUSTOMER SATISFACTION METRICS ACROSS THE ORGANIZATION. Companies should develop meaningful and consistent customer satisfaction metrics for employees that tie directly to compensation. A technology metric, such as system uptime for example, does not correlate to customer experience. Although system uptime is clearly a requirement for customer satisfaction, it is too narrow. Rather, develop organization-wide metrics that apply to all employees and allow them to relate the requirement to their own tasks.

7. LEVERAGE INDEPENDENT TESTING. Independent testing is crucial to ensure what you have prescribed is actually occurring. Independent testers should be given tasks tied to discrete journeys and asked to report back on exactly what happened and how they felt as a result of the experience. Additionally, testers should provide a fact-based method for comparing the interaction against the journey map and brand pillars, as well as qualitative feedback that uncovers gaps between the experience and the brand promises. Achieving excellence in customer experience is a result of every employee living the organization’s brand promise. Getting there requires significant enterprise-wide commitment, including the implementation of the steps listed above. In return it can reap significant rewards in the form of satisfied customers, happier employees, greater revenues and improved profitability.

Starting the post-sale relationship off right is key to customer retention.

While this can’t be emphasized enough, with regards to onboarding, be careful not to mistake giving customers more choices and information for a better process.

Too Many Options May Overwhelm Customers

Chances are that your sales team pulled out all the stops to attract the attention of your current customers. Customers are drawn to large numbers of features and options when making the initial purchase decision.

You would think that after they’ve closed the deal, it’s your job to explain all the details and nuances about everything they were promised in the sales pitch. It’s time to exceed all of their expectations. But when it comes to onboarding it is very easy to overwhelm them with all of those same options that originally attracted them to your product.

What is Choice Overload?

One of the basic phenomena in behavioral economics is choice overload, which occurs when you present someone with too many choices. It is associated with unhappiness, decision fatigue, going with the default option, and choice deferral.

By showing your customers all of the customizable settings, features, and options right at the beginning of your relationship, before they are familiar with you or your product, you run the risk of overwhelming them into inaction and dissatisfaction.

There are four key factors that contribute to choice overload:

  • choice set complexity
  • decision task difficulty
  • preference uncertainty
  • and decision goal

With a more complex choice set, a more difficult decision task, more preference uncertainty, or a more prominent and effort-minimizing business goal, there is a greater chance of choice overload. Poor onboarding is one of the leading causes of churn, so overwhelming your customers during onboarding can be one of the most impactful mistakes regarding your overall customer experience.

How User Interface May Contribute to Overload

Even if you channel your eager energy into the best onboarding process on the face of this planet, that may not be enough to prevent a different kind of overload, cognitive overload. According to experts at Fluid UI, if the user interface your customers are dealing with is too stimulating or even not stimulating enough, customers may “overlook the finer details of a product or service, lose focus or ignore an important learning moment. [Humans] still draw conclusions about the suitability of the product [they] are learning about.”

Read more about avoiding cognitive overload using customer-centric design for successful onboarding and retention.

Cyberpsychology and UX 3: Preventing Cognitive Overload

Your step-by-step instructions, videos, and one-on-one walkthrough conversations for onboarding will be negatively impacted if the web pages customers interact with are cluttered. If the instructional video/ help documentation is buried in an obscure corner of your homepage, you’ll find that your Success team spends too much time acting as Support.

Customer Effort Score: One Question to Combat Overload

The easiest way to learn if you have a problem is to gather feedback from customers who have completed onboarding. Both types of overload are easily identified when you ask customers “How easy was it for you to complete onboarding?”, the Customer Effort Score question. Asking for a score and comments will bring to light the most prominent issues at this journey point.

By gathering feedback immediately after onboarding, customers who struggled with the user interface will be able to provide you specific examples from their experience that need adjustment. For example, you may hear from a customer who is colorblind that the color theme for a specific chart was tough to distinguish for them, or that finding a specific button took more time than they had anticipated.

Read more about how Customer Effort Score can improve your onboarding process.

Use Choice to Enhance Customer Experience

Driving adoption and customer loyalty is a tough job, but flooding new customers with information is not the way to go.

Gathering feedback throughout your relationship about effort, satisfaction, and loyalty will help you improve the entire customer experience and prevent you from overwhelming your customers at any point in their journey with you.

To provide an excellent customer experience, all you need to do is provide convenient information that helps your customers achieve the next milestone, or inspires them to develop a new milestone. By listening and taking action, you build trust and loyalty with your customers that will help you win customers for life.

Measure and improve customer experience. Sign up today for free Net Promoter Score, CSAT or Customer Effort Score feedback with InMoment.

Putting off changes to your onboarding process is too tempting. Where do you find the time to overhaul the entire process and where do you even begin? It feels like a monumental task that will take ages to do properly.

While it may seem daunting, there is a simple, quick step you can take to prioritize incremental improvements immediately: start gathering Customer Effort Score feedback after onboarding completion.

What does “Onboarded” mean?

Onboarding is a term often used in SaaS businesses and there are many ways people will define what “onboarded” means. It can vary depending on the type and level of complexity of your product or service.

As an event in the Customer Success journey, “onboarded” can mean the first point where customers start to achieve their goals. In terms of product training, it is the point where hand-holding is no longer necessary and customers are confident enough to navigate on their own.

Once you have a better idea of what “onboarded” means to your company, you can reverse engineer the process to get there.

The Easiest Way to Improve Onboarding

There are plenty of specific actions you can take when it comes to improving the onboarding process, but how do you know which actions to prioritize? You could write up a playbook for all of your CSMs, but how do you know what methods are the most successful, or what the most frequently asked questions during onboarding are?

Gathering Customer Effort Score feedback after your customers soon after they finish the onboarding process helps you prioritize initiatives when it comes to improving the onboarding customer experience.  Address the most frequent, most fundamental complaints first to incrementally change your onboarding process instead of trying to do a complete overhaul in one go.

What is Customer Effort Score (CES)?

The Customer Effort Score survey asks customers on a scale from 1 to 7 how easy it is to deal with a companies products and services. The CES survey is a transactional survey, gauging the experiences customers have after a specific touch point in the customer journey.

Why Customer Effort Score (CES)?

Why focus on effort here? Why is it a better choice than, say, NPS? Because effortless onboarding correlates with retention. According to the Harvard Business Review, “companies create loyal customers primarily by helping them solve their problems quickly and easily.”

When you ask your customers directly – “How hard was it for you to get started with us?” you will quickly identify whatever obstacles your customers faced during onboarding. Address them immediately for quick wins with big impact.

Implementing a CES micro-survey means receiving open-ended feedback from customers that speak to the issues that are at the top of their minds. You’ll hear what customers struggle with specifically so that you can prioritize the changes and additions that will have the greatest impact on customer experience.

In the long term, CES can get you answers to the questions that shape your overall process such as:

  • What do customers need to be able to do or know to accomplish their goal?
  • What information do they need in order to do this?
  • Which content formats are best to convey different information?
  • What do your customers perceive to be the first value delivered point/ first value achieved point?
  • How long does it take customers to get to the first value delivered point/ first value achieved point and what can be changed to reduce that amount of time?
  • Is there information being lost in the handoff from Sales to Success? If so, what is being lost?

Focusing on minimizing friction and achieving your customers’ desired outcome encourages them to form a longer, deeper relationship with your company. This means more opportunities for upsell and cross-sell. It also means higher advocacy, which is instrumental to growth.

Iterate & Adjust as Your Company Evolves

By gathering CES feedback after onboarding completion, your company can improve retention and build a loyal customer base. You’ll demonstrate customer-centricity from the very beginning of your relationships.

Creating a customer-centric onboarding process kicks off a customer experience that will make you stand out among your competition. Even as your company and product evolve to accommodate new needs, customer feedback will guide you to the most effective onboarding process, helping you win customers for life.

Start getting in-app CES feedback for free with Wootric.

Have you ever wondered how important digital interactions are to the customer experience in financial services? According to PWC, more than 45 percent of banking customers say they only interact with their bank through digital channels. This means that for almost half of a bank’s customers, digital experience (DX) all but equals customer experience (CX). The large majority of banking customers are multi-channel and the most frequently used channel is online.

Retail banking may be on the bleeding edge of the financial sector in the transition to digital, but insurance, wealth management and SMB banking are moving along a similar path. The frequent presence of an advisor or agent has somewhat mitigated the rush to digital for these businesses, but every facet of the industry faces the same push and pull forces.

  • Companies are being pulled by consumers who increasingly manage and live their lives digitally and are accustomed to always-on services through online, on-the-go and social channels.
  • Equally important, financial services providers are being pushed by the growing challenge from FinTech firms making inroads in the market with their digital-only offers supported by cutting-edge technology.

These market forces mean that over the next few years more customers will be digital-only and an increasing share of interactions will be digital. The maturation of Generation Y and Millennials all but assures that digital-only and digital-dominant users of financial services will become increasingly prevalent. As such, DX will become more important to, even the primary determinant of, CX.

The Speed of Change Which Companies Must Keep Pace

When the Internet became a popular means for conducting transactions and disseminating information, financial firms were quick to encourage customers to move activity online. These early efforts were pushed by the banks for efficiency and cost-savings. The focus was on function and static content.

The rush of innovation and technology adoption has crossed an inflection point in the past five years or so. Function is now tables stakes and has been overwhelmed by design and form, static content has been supplanted by the interactive, and digital delivery for operational efficiency has been trampled by the need to offer digital experiences that meet the rising expectations of customers.

The pace of change has caught the industry flat-footed. Designing a home page that is consistent with the company’s brand image and customer experience is one thing. Delivering on this promise is far more complex in an increasingly mobile and social world, not to mention the emerging domains of Virtual Reality (VR) and Artificial Intelligence (AI), let alone wearables and IoT (Internet of Things). Keeping up with the “best next Customer Experience,” as Gartner puts it, is like being the Red Queen in Alice Through the Looking Glass,who says that you have to run as fast as you can just to stay in the same place; “if you want to get somewhere else, you must run at least twice as fast as that!” This is the speed of change with which firms must keep pace.

Focus on Strengthening Relationships

The starting point is an over-arching strategic perspective: digital tools are not meant merely as stand-alone applications that are easy-to-use and minimize customer effort. Rather, the approach to digital needs to be integrated across channels and built on the premise that the objective is to offer delightful, engaging digital experiences that contribute to the larger goal of promoting superior customer experiences. In other words, the digital experience is a means to strengthening the relationships that are the backbone of the financial services industry.

Easy to say, tough to do. So here are a few specific suggestions.

  • Map it.Customer Journey Maps will detail and illustrate the scope of digital and non-digital channels and touchpoints, the complexity of the challenge, as well as help set priorities.
  • Aim for sticky.This means engaging and interactive.
  • Design for mobile first.Four-fifths of Internet usage is via mobile. Flip the old model: explicitly design for mobile, then move to online.
  • Make it relevant.Personalize and anticipate needs. This means built-in intelligence.
  • Omni-channel vs multi-channel.Go where customers go. This means also being social and offering SMS; video access to reps, agents or advisors; click-to-chat; and the emerging technologies, which will continuously evolve.
  • Onboard for DX.This doesn’t mean using traditional onboarding approaches for digital applications; it means adopting digital tools to facilitate digital onboarding.
  • Measure and remediate.Digital is real-time, making it critical that firms have real-time feedback programs in place, supported by closed-loop procedures to mitigate the risks of disappointing or simply unengaging digital experiences.

It is hard to imagine how even the largest banks can accomplish this on their own, so partnerships will be critical. Internally, the lines separating tech workers and the product/marketing teams need to be erased.

Get Rid of the Extra Overhead

Tomorrow started yesterday in the race to keep up, let alone differentiate on CX and DX. The FinTech firms – most with their singular focus and technology pedigree and without the overhead burden of branch networks or offices – are designed for a continuous sprinting leapfrog of innovation. Traditional players also carry the additional overhead weight of heightened security demands and regulatory standards. That is the playing field on which financial services firms must compete and they need to start running twice as fast now.

Customer Success teams are expanding – not just in size, but in scope. New roles are emerging as CS is maturing as a specialty, specifically roles like Customer Success Operations (CS Ops).

At early-stage startups, Customer Success Managers will find themselves covering this function, but as the company grows, it can be extremely valuable to separate this function into a dedicated role within CS to help scale up.

What does a Success Operations Manager do?

Think of “Success Operations” as a product that promises to optimize processes for its customers, i.e. the Customer Success Managers.

CS Ops managers establish a baseline of productivity using metrics like net MMR churn and how difficult it is to learn about new product features. They talk to CSMs to learn what pain points they face in their day-to-day responsibilities and observe how processes currently work.

They segment the current customer base to distribute the workload effectively among CSMs. CS Ops managers look for consistent issues across the whole Success team, break the issues down into manageable components, and create solutions with measurable results.

“There is nothing so useless as doing efficiently that which should not be done at all.” – Peter F. Drucker

Using the information they’ve gathered, CS Ops managers may build tools like custom dashboards, or establish automatic workflows among software platforms to make the CSM’s job easier and help them be more productive.

A CS Ops manager will “onboard” CSMs, teaching them how to use the new tools at their disposal, and check in frequently with their “customers”. In this sense, they are CSMs to the CSMs.

In short, Customer Success Operations managers are responsible for providing tactical support to the rest of the Success team, helping them improve their KPIs and their efficiency.

What does a CS Operations Manager need to know?

Customer Success Operations Managers should be familiar with:

  • Customer Relationship Management Software (e.g. Salesforce, Gainsight, Totango)
  • In-app messaging Software (e.g. Intercom)
  • Support platforms (e.g. Zendesk, FreshService)
  • Key Performance Indicators (KPIs) for Customer Success

Each company will have a unique suite of different platforms that it uses, and CS Ops managers need to be quick to become fluent in most, if not all of them. This is crucial for the role since data silos are a major hindrance to organizational efficiency and detract from your customers’ experience.

Additionally, Success Operations Managers will need many of the same ‘soft skills’ that CSMs use. For example, CS Ops managers need to be able to actively listen to the struggles of the CSMs to come up with valuable solutions.

What does this role look like in real life?

For Feedvisor Customer Success Operations Manager Shachar Avrahami, he came into the company as the first “Professional Services team member.” As the team grew from a one-man operation to a multi-person team (and the company scaled up), Shachar’s manager asked him to create his own role – Customer Success Operations Manager, “and I became the first person to assume this new position and help define it.”

He says, “I am the owner of our team’s processes on a macro level, making sure all teams are aligned with the strategy for each part of the customer’s journey.”

How do you know if you need a Success Operations Manager?

Giving a concrete number at which you need to hire a CS Ops manager is difficult. It depends on the capacity of your current CSM team. As a rule of thumb, you will want to look into hiring a Success Operations manager after you’ve hired your fourth or fifth CSM.

For some organizations, the new role may be an internal promotion of a CSM. For other companies, it may be wise to bring in an individual with experience in a ‘project manager’-like position to help streamline Customer Success processes, aligning everyone under the common vision that is handed down from the C-suite and creating a more consistent experience for customers.

Like Robert S. Kaplan, co-creator of The Balanced Scorecard, says, “consistent alignment of capabilities and internal processes with the customer value proposition is the core of any strategy execution.”

How do you advocate for a CS Operations Manager role?

Understand that a CS Operations Manager’s responsibilities are nearly the same as those of a Sales Operations Manager. The justifications for the CS Ops role are similar.

The operations role increases the productivity of your customer-facing Success team members, who carry the weight of recurring revenue on their shoulders. Not only does this mean management can hire fewer individuals for the customer-facing roles, but each CSM’s key performance indicators will improve at rates that were impossible before this specialized role.

Having a CS Ops role also improves visibility into the Success team’s business outcomes, places for improvement, and what projects need to be prioritized for Customer Success.

For an excellent breakdown and comparison of the Sales and CS Ops positions, click here.

Operations For Smooth Scaling

There will always be growing pains as a start-up matures and finds success. Operations experts specialize in finding technical solutions for when people are stretched beyond their limits. Creating a Customer Success Operations position is an effective way to proactively combat capacity issues for the Success team and deliver a consistently positive experience for your customers.

Access Voice of the Customer insight in your system of record with InMoment’s native integrations, including Salesforce, Gainsight, & Totango.

Airport Series: JFK And Planning For The Future

JFK International Airport is about to undergo a massive renovation. To understand what JFK should change and why, we analyzed 1000's of traveler reviews using our web-based text analytics platform. Here's what we found.

Consider New York City: the tangy gradient of smells emerging from chocolate shops and beer halls between 18th Street and 14th Street; the dissonance of high heels and sirens pounding against the Upper West Side; plumes of steam on a cold night, seething from deep within the City’s crust. New York is the navel of civilization — a hub where all people meet. To this end, its primary ports of entry, its airports, are unique in their role as ambassadors of the City.

A business and an icon

In this series we’ve examined airports like any other business. But for John F. Kennedy International Airport (JFK), the delineations between retail space, transit hub, and cultural monument are blurred. Analyzing public comments on JFK’s official Facebook page, we found an uncanny trend of users equating the airport to the city as a whole. Unfortunately, the comparison rarely proved positive. This is true even for the locals: “I have lived in NYC for 12 years,” says one man, “this airport is an example of everything wrong in this great city.” So, how might such an airport remedy this reputation crisis?

Here’s to new beginnings

In January 2017, New York Governor Andrew Cuomo announced a $7-10 billion renovation plan for JFK International Airport. While a start-date has yet to be announced, the Governor’s office is accepting proposals. How might this portal to New York City respond to customer feedback? We uncovered some rich insights by mining and structuring thousands of free text reviews from travelers passing through JFK. The body overseeing the renovations, the Airport Master Plan Advisory Panel (AMPAP), might set some criteria based on these qualitative feedback.

Get connected

We ran this Facebook text data set though our web client, Semantria Storage & Visualization (SSV). By viewing Topics, which are query- or model-generated document classifications (in other words, known categories you’re actively looking for), we can see an immediate issue.

Figure 1: JFK topic sentiment polarity.

Notice Internet, the solid red column near the center of the visualization. What might be going on here? As we drill down we quickly notice something all too familiar to any regular at JFK: Wifi. Take it from one foreign traveler:

“How it is possible that one of The biggest airport [sic] of The world dont [sic] Provide free wifi???”

And, from a sardonic American:

“Get free wifi, this place is like a greyhound station ?”

There is, in fact, not a single neutral or positive mention of wifi in the JFK data set. It’s 100% negative. When planning future terminal renovation, AMPAP ought to consider network optimized architecture as well as sponsored, complimentary wifi.

Kindness is a universal language

A trend we’ve noticed across our airport experiment is the frequency of staff attitude. Staff attitude frequently plays first fiddle in the qualitative reviews.

This pie chart illustrates how much of the JFK data set is dedicated to customer-staff interactions.

Figure 2: Topic breakdown by volume.

All four variants — Attitude, Staff-General, Staff-General-Helpfulness, Staff-General-Attitude — constitute a volume nearly equal to the next 16 topics combined. Furthermore, we begin to notice a troubling situation when we compare this pie chart to the sentiment polarity columns from the first visualization. Frequently, customer-staff interactions result in negative feedback.

Figure 3: Detail of topic sentiment polarity for staff attitude.

For each of these categories, sentiment skews neutral-negative. Frequently, visitors mention how JFK appears understaffed, like this American traveler:

“Not enough staff, the staff you do have are rude, shouting at the public like they’re animals. I will never fly through JFK again. End of story.”

JFK is close to two competing airports, including Newark Airport. This means JFK’s non-aeronautical facilities, such as restaurants and retail stores, are especially susceptible to churn. A disgruntled guest, like the one highlighted above, can have a sphere of social influence encompassing hundreds of potential customers.

Hearing and addressing these concerns are the only way to ensure JFK retains a dedicated user base.

The road ahead for JFK

The AMPAP renovation project will cover a broad scope. But central to the mission ought to be the loud and colorful social media manifesto issued by JFK’s many customers. Staff attitude and wifi aren’t the only discussion topics. Hundreds of JFK reviews point to broken elevators, jammed jetways, confusing signage, and more.

Keeping a finger on these real time data streams will define the projects of the future while maintaining the facilities of today.

Editor’s note: This is a chapter from the ebook, Unlock the Value of CX. You can download the entire book here.

In a world in which more and more data is available from a wide variety of channels, many different information sources are being bundled to form the basis for obtaining new and more detailed insights. Effective data visualization gives users a comprehensive overview and the ability to drill down on relevant details, thus supporting evaluation of all information provided. The faster decision-makers are able to recognize opportunities and risks, the better aligned their decisions.

Visually Communicating Complex Data

In essence, data visualization is mapping out data in a way that delivers explanations and exploration possibilities, making it easier for users to “read” and process data-based information. The following design aspects must be addressed to facilitate the reading flow for the user:

• Targeted use of pre-attentive attributes, i.e. characteristics which are perceived and evaluated subconsciously and prior to conscious processing as information

• The organizing of functionalities (e.g. navigation) in learned structures

• Consistent utilization of recurring visualization elements

Visualization Elements for Reporting Systems

The principle of infographics is often drawn upon in developing systemic reporting solutions for visualization aspects, but the limitations of this approach soon become evident. Users not only require flexible and practical usage, which means a high level of accuracy and uncomplicated visualization, but also the following as checklist criteria:

• User-specific detail depth

• Updated data

• Interactivity

The information requirements and selected mode of analysis thus determine the choice of visualization graphics. As a rule, it must be carefully reviewed which chart type is optimally suitable for conveying the desired information. Ideally, a chart should display no more than six values (i.e. elements to be read). The three sample charts below illustrate how this can be accomplished:

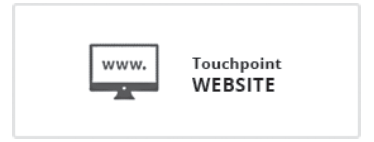
1. Structure-creating image elements provide orientation within the content for dependable reading. Additionally, these image elements can themselves be used for navigation, as buttons, for example, opening a Touchpoint Detail Report.

touchpoint website

2. Individual values can prominently be visualized using Big Number Boxes. Additional information such as trend versus the preceding month can be integrated via a simple icon.

Score

3. Icons with pre-attentive attributes which have corresponding significance (e.g. smileys, traffic lights, stars) enable color-blind people as well to intuitively process summarized and evaluated data.

Smiley Face

The Path to Reporting

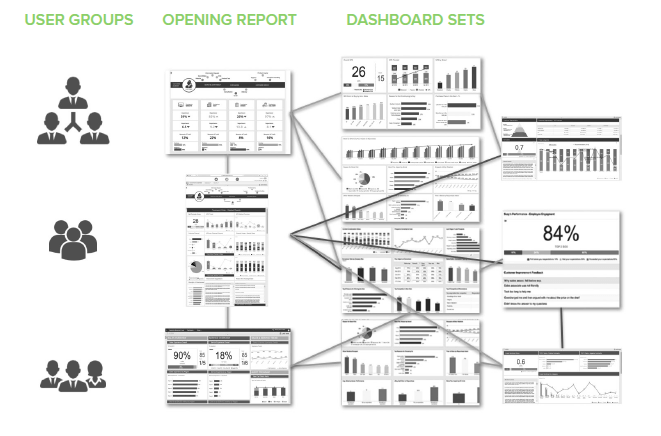
Users today want to see only the information that is relevant to them, enabling more effective and proactive response. This requires a reporting concept for identifying different user types and groups and creating profiles or ‘personas’.

User profiles document differing information needs in terms of content, structure, level of detail and mode of usage and display as well as activation potential, responsibilities, bonus-relevant information elements and scope of action.

At the end of each user profile is a ‘story’ containing the parameters for reporting (i.e. the set of dashboards) specifically configured for the user group.

Proceeding step by step from the starting report, users are shown the information relevant to them and the interrelationships therein. In addition, a dashboard shows possibilities for more in-depth views and further analysis available to the user, providing insights into where action needs to be or could be taken. A well-designed reporting concept integrates advanced analysis capabilities and facilitates interactivity, making it easier to take action based on perceived action relevance.

Comprehensive Overview

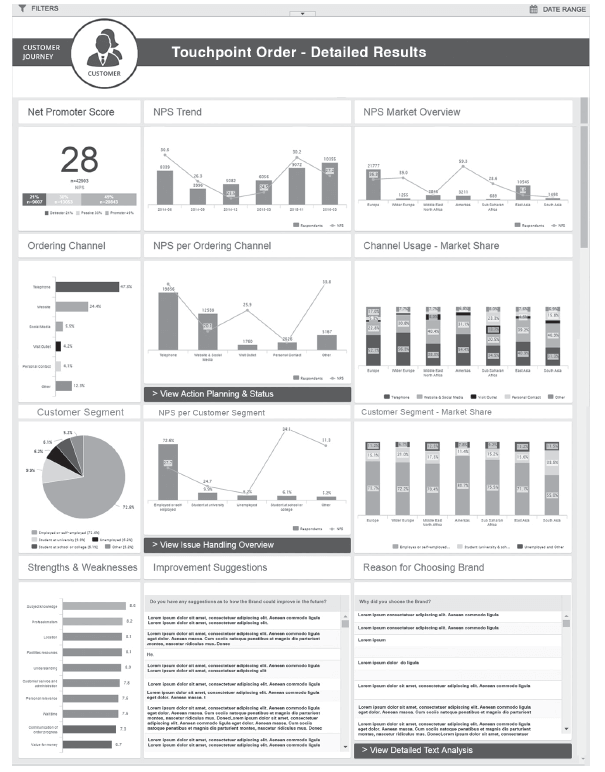
Example: Emilia Schmitz is a brand communication executive. To oversee corporation-wide brand cohesion, she and her team require an overview of the entire array of communication channels and touchpoints. Within the customer lifecycle, her customers have contact with various people and departments within the firm. These contact points can influence how the customer perceives the company and brand in both positive and negative ways. She and her team thus are focused on improving their support for the individual touchpoint managers in providing action plans, ideas and concepts. She requires touchpoint monitoring that ties all of the necessary information together in the background so that she and her team have an overview displayed at all times of the most important KPIs for each touchpoint.

dashboard

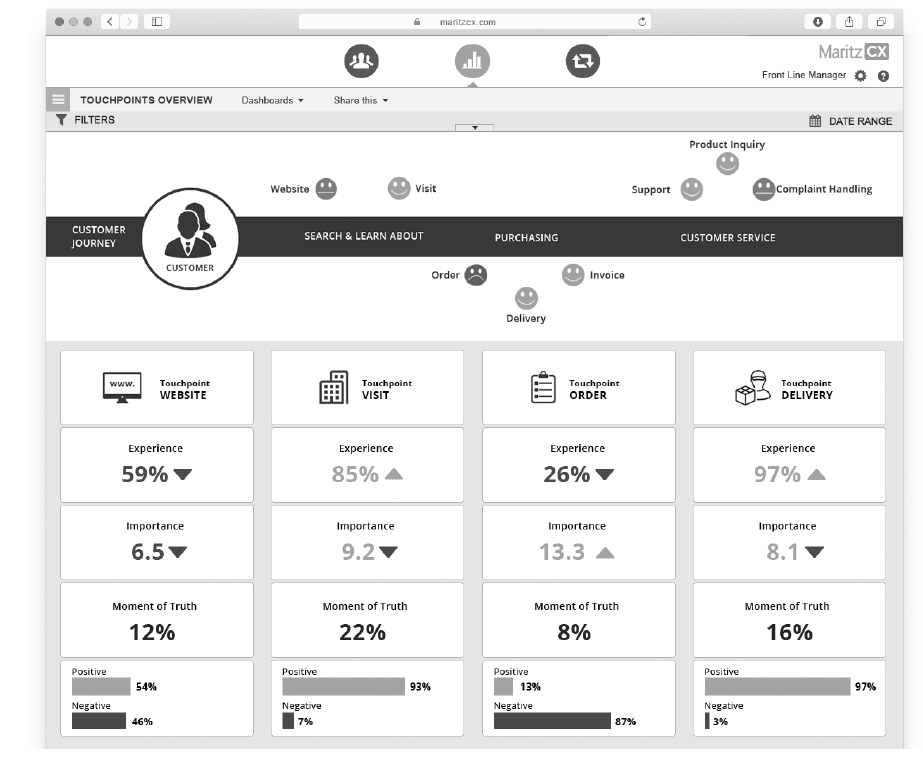
Ms. Schmitz and her team rely on the touchpoint dashboard as an overarching monitoring and leading indicator system. Quick indicators in the header of the dashboard enable her to see immediately where support is most urgently needed.

The dashboard is specifically designed to deliver core information. Only a very limited range of colors are utilized, as the metrics are prominently displayed and partially formatted (red, green etc.), already bundling a lot of information.

Integrated Analytic Capabilities and Easy Interactivity

System users today more than ever insist on the capability to edit data relevant to them. Current online-based solutions meet these needs, providing export functionalities for independent further processing of data.

In addition, modern reporting systems are increasingly being utilized as an analysis tool, having functionalities going beyond the typical, standard filtering options that allow object-based content linking by users.

At the start screen showing information defined as being of the highest priority for the user group, a detailed view of the top level shows the selected NPS® over time and per market, possible ordering channels, the customer groups and strengths and weaknesses in the ordering process, among other things.

Every chart allows interactive drill-down by users. In addition to the usual filter settings, users can drag and drop graphic elements like the “telephone” bar in the ordering channels chart into the report filter. By clicking on the more detailed view for the ordering channel “telephone” the user is navigated to an overview of strengths and weaknesses or the distribution of customer segments for that order channel, for example.

This allows combining different content from the displayed charts in an intuitive, object-based way to create complex filters.

complex filters

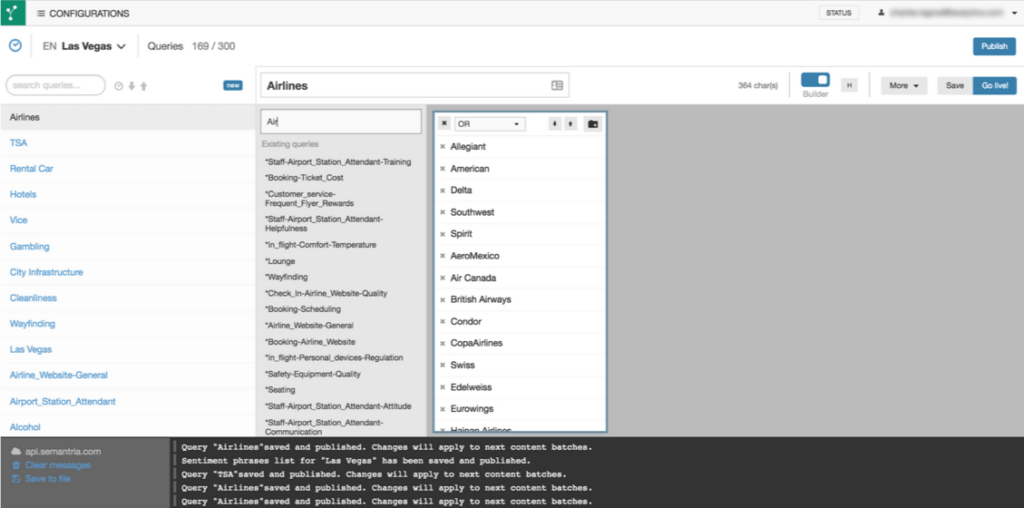
Text Analytics in Touchpoint Monitoring

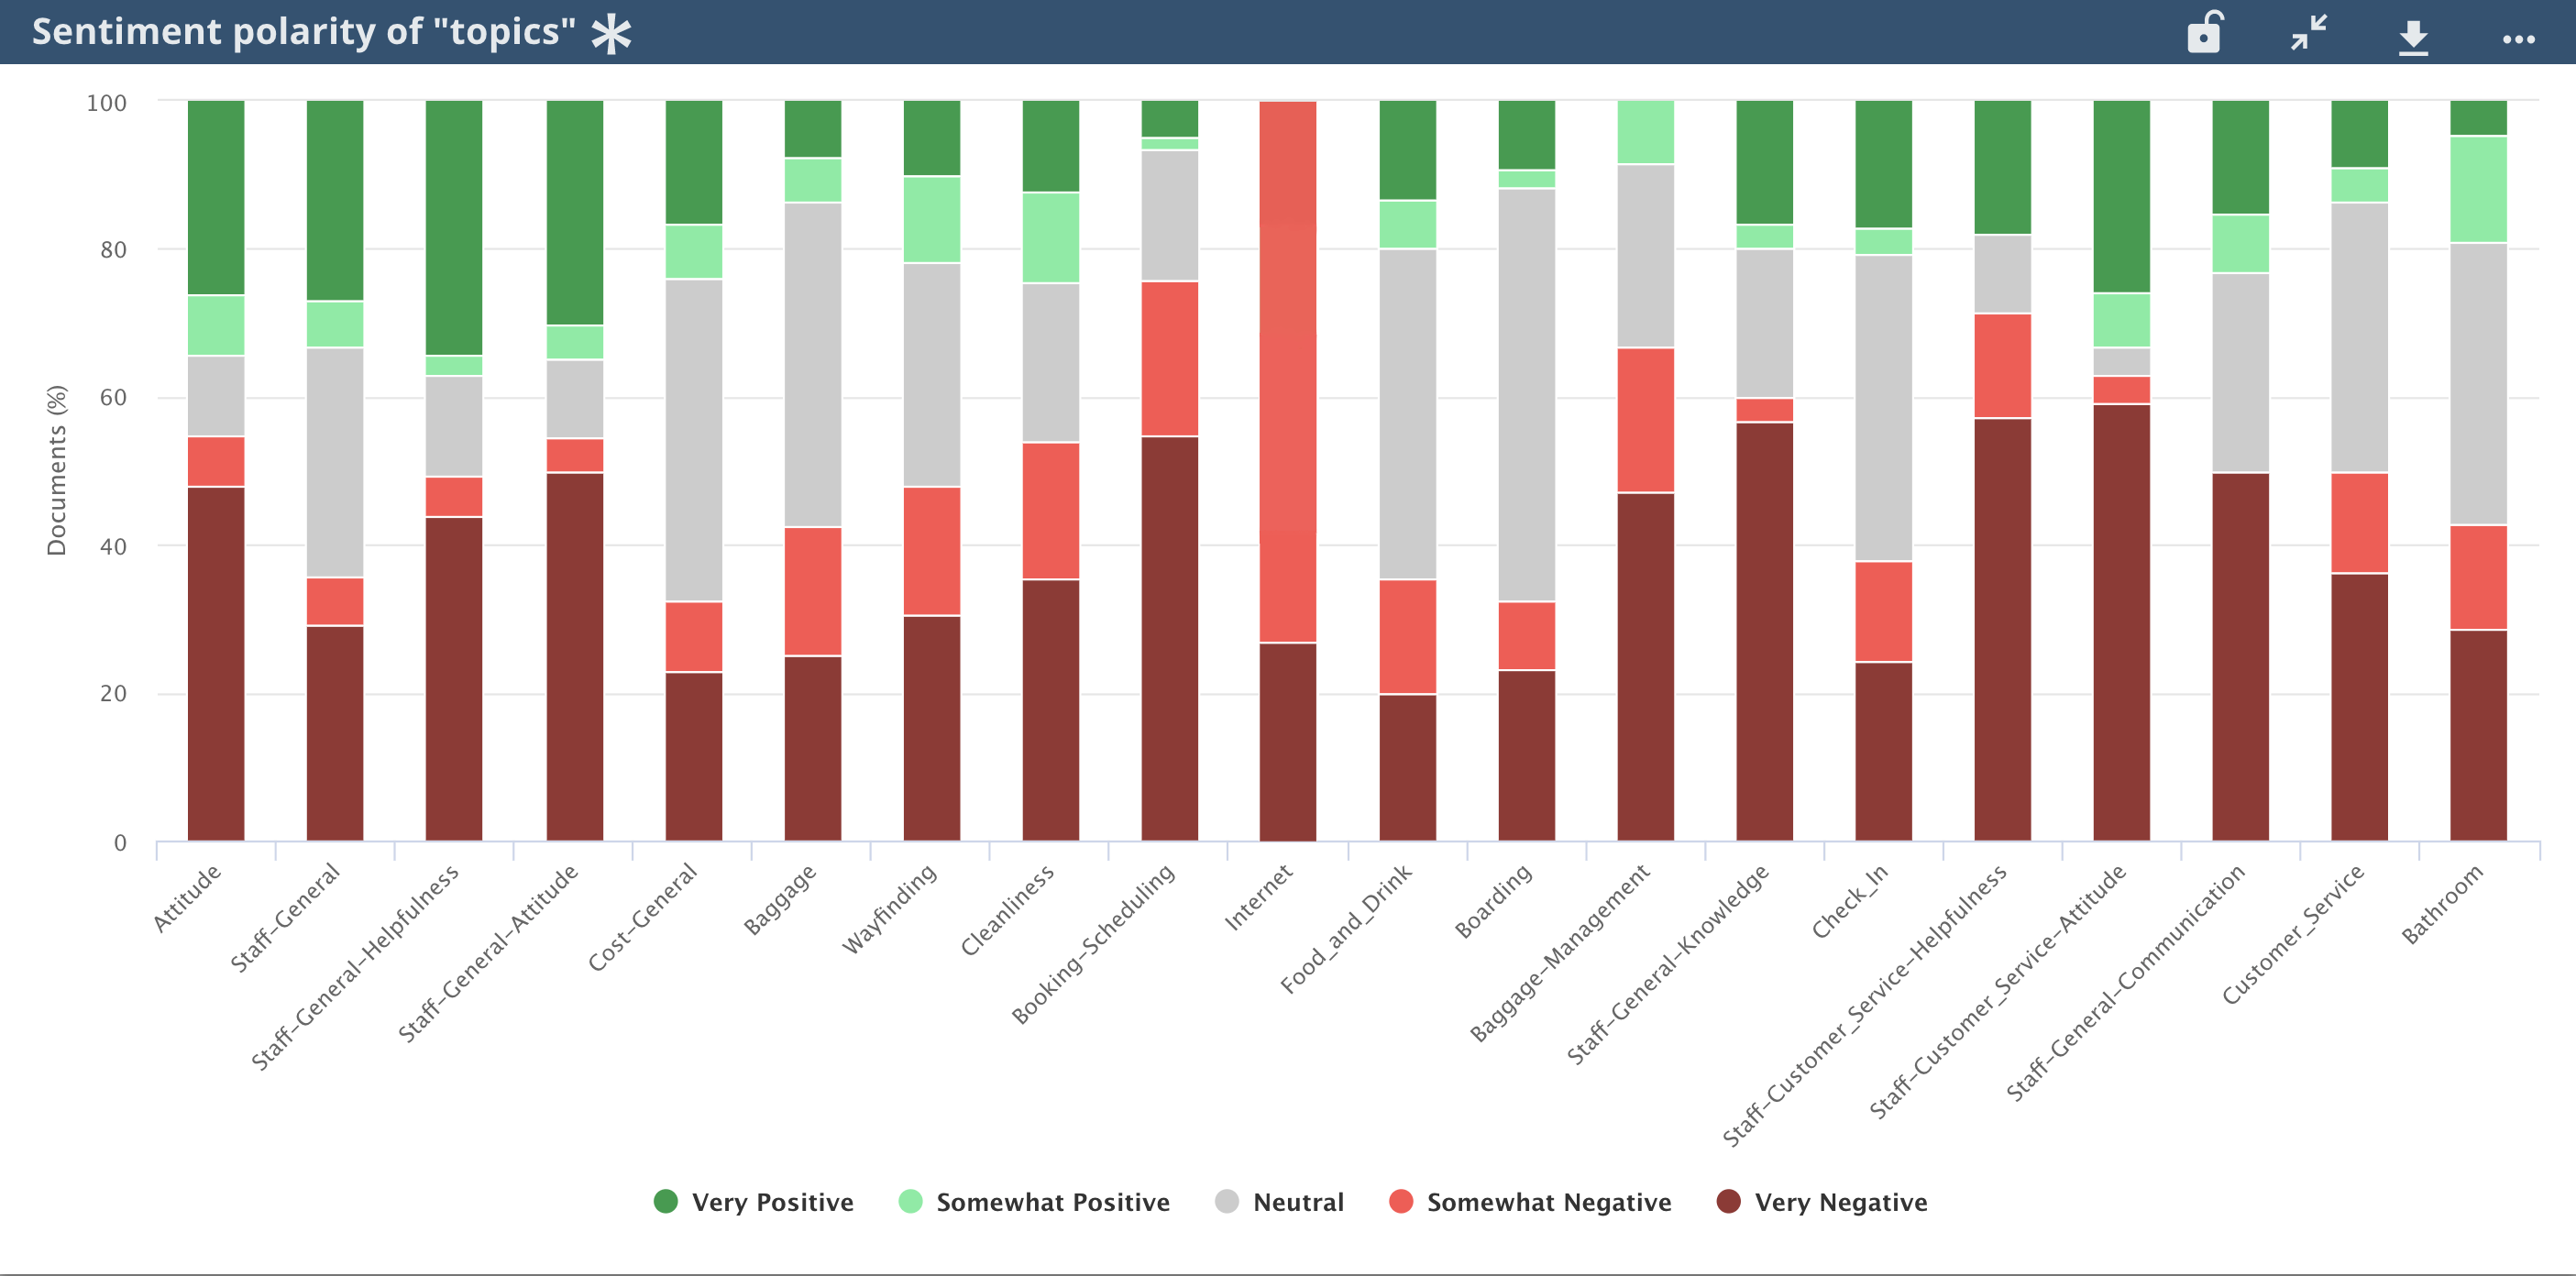
Text analytic results can also be integrated into touchpoint monitoring, enhancing analysis capability. In addition to keyword search, standard elements for ongoing systematic evaluation of unstructured text are available, including:

• Basic comment sentiment, classified as positive, neutral or negative

• Application of a scheme for comment categorization

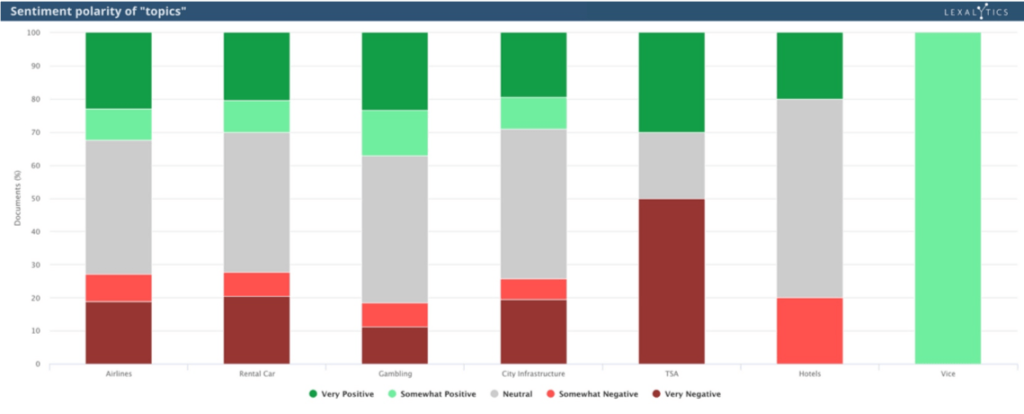
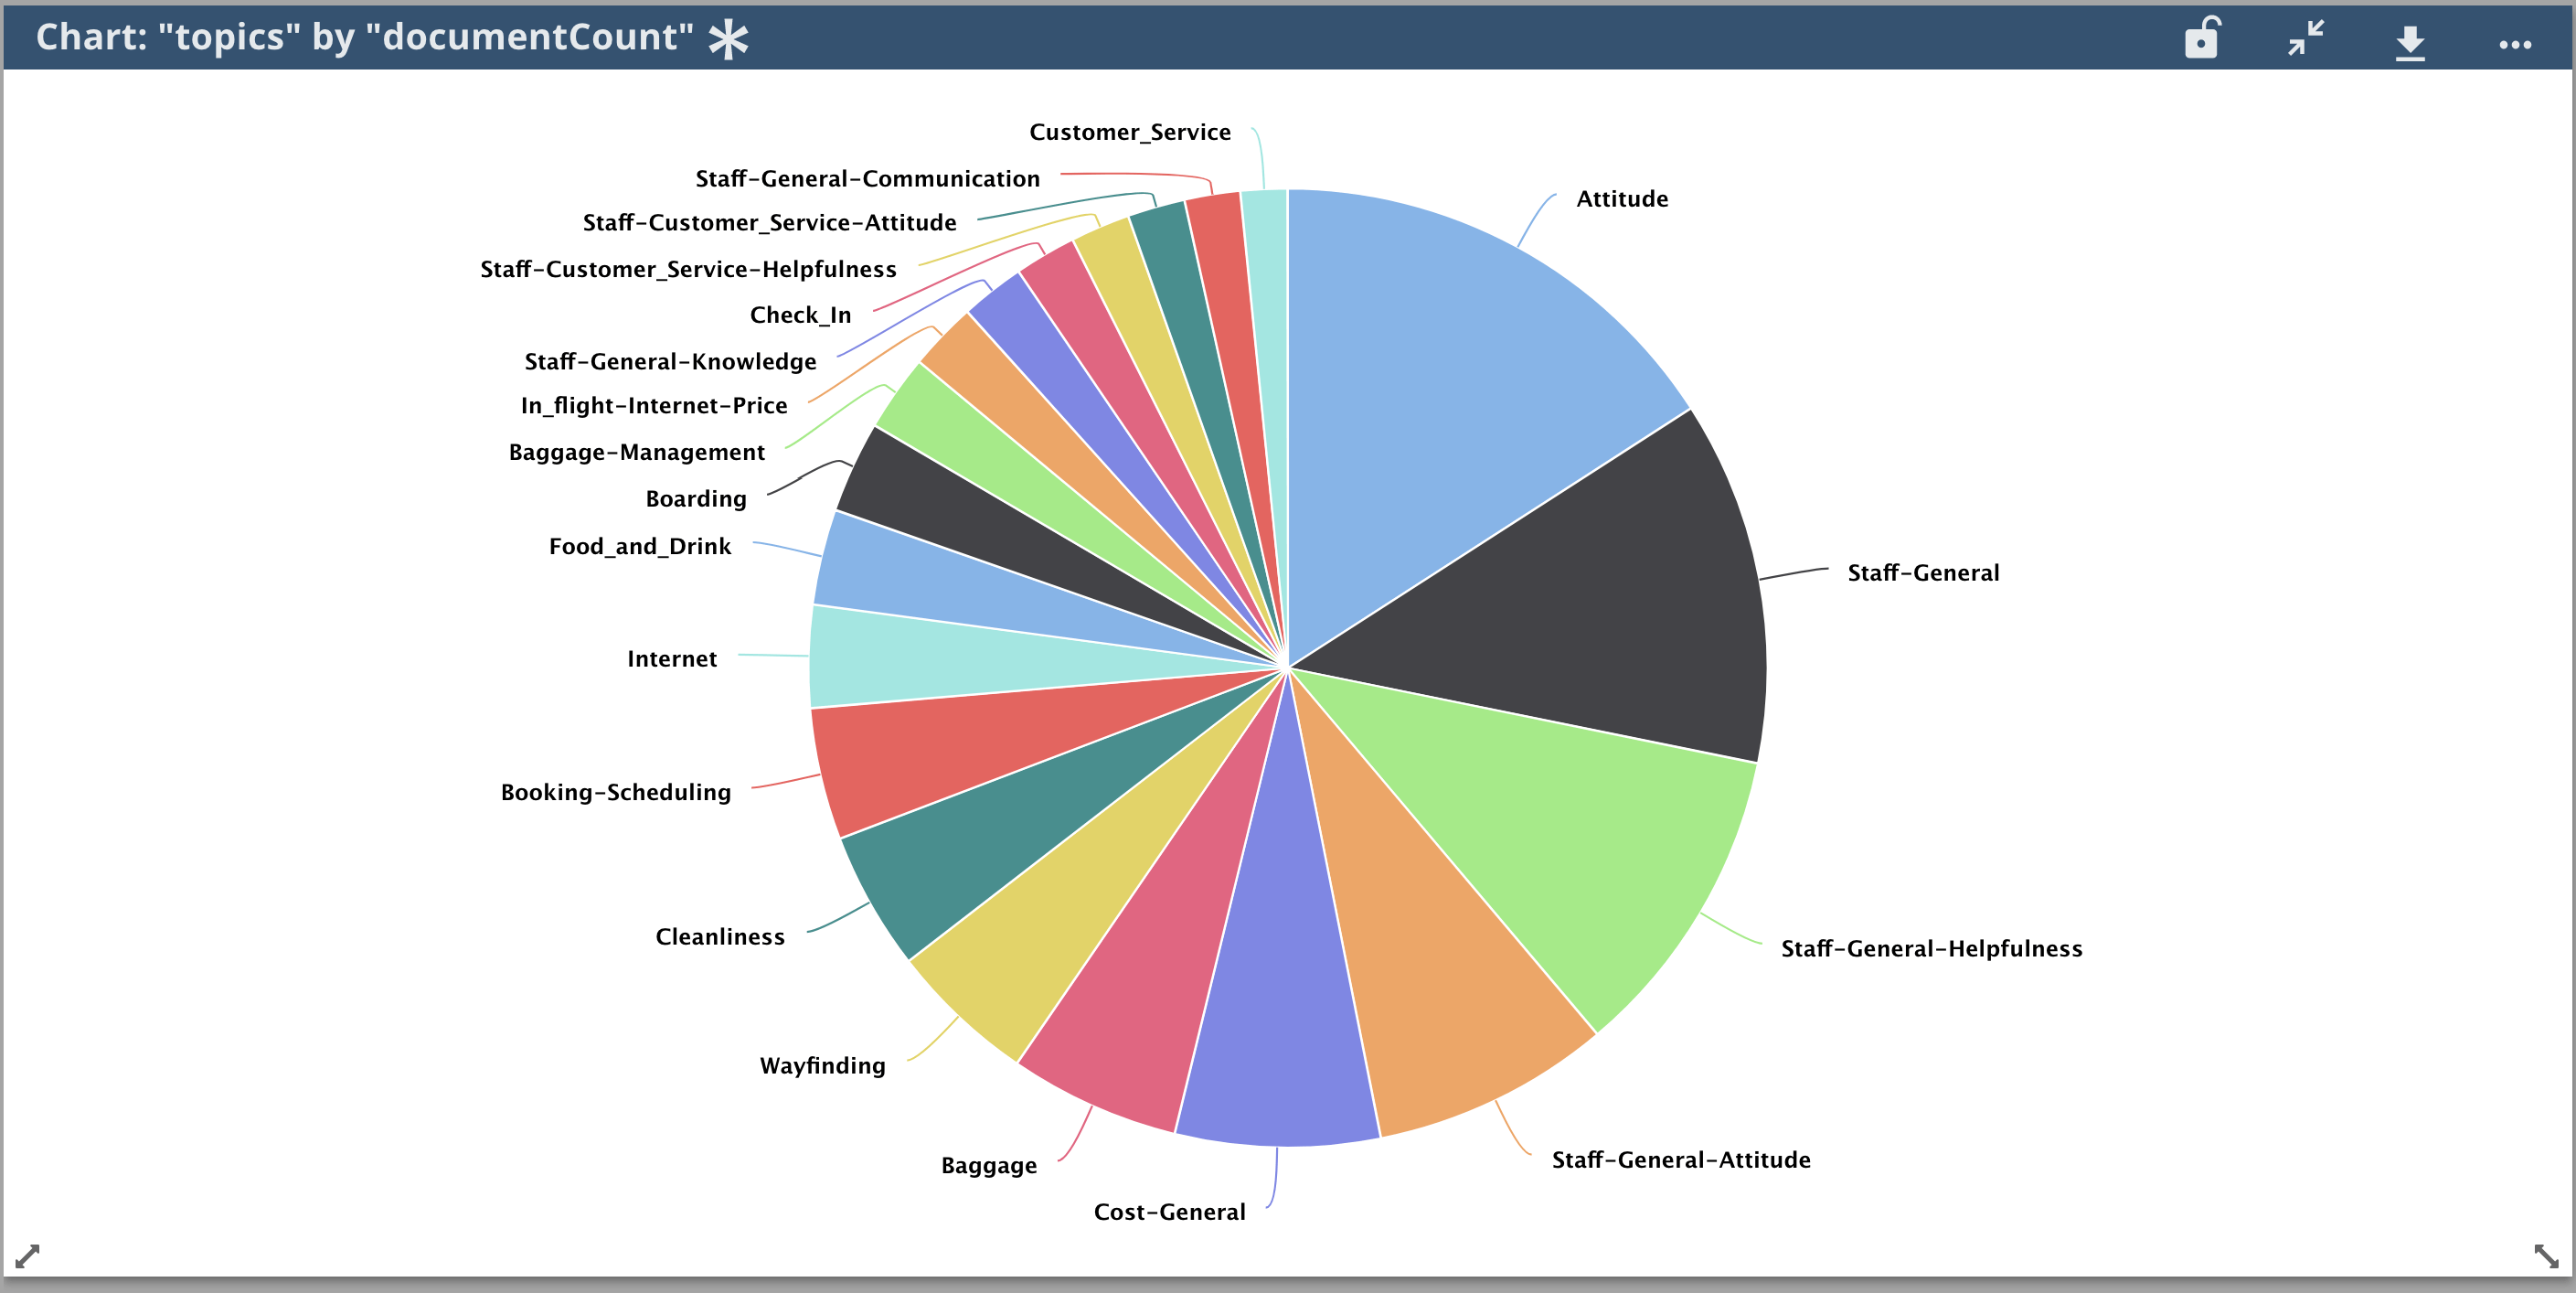
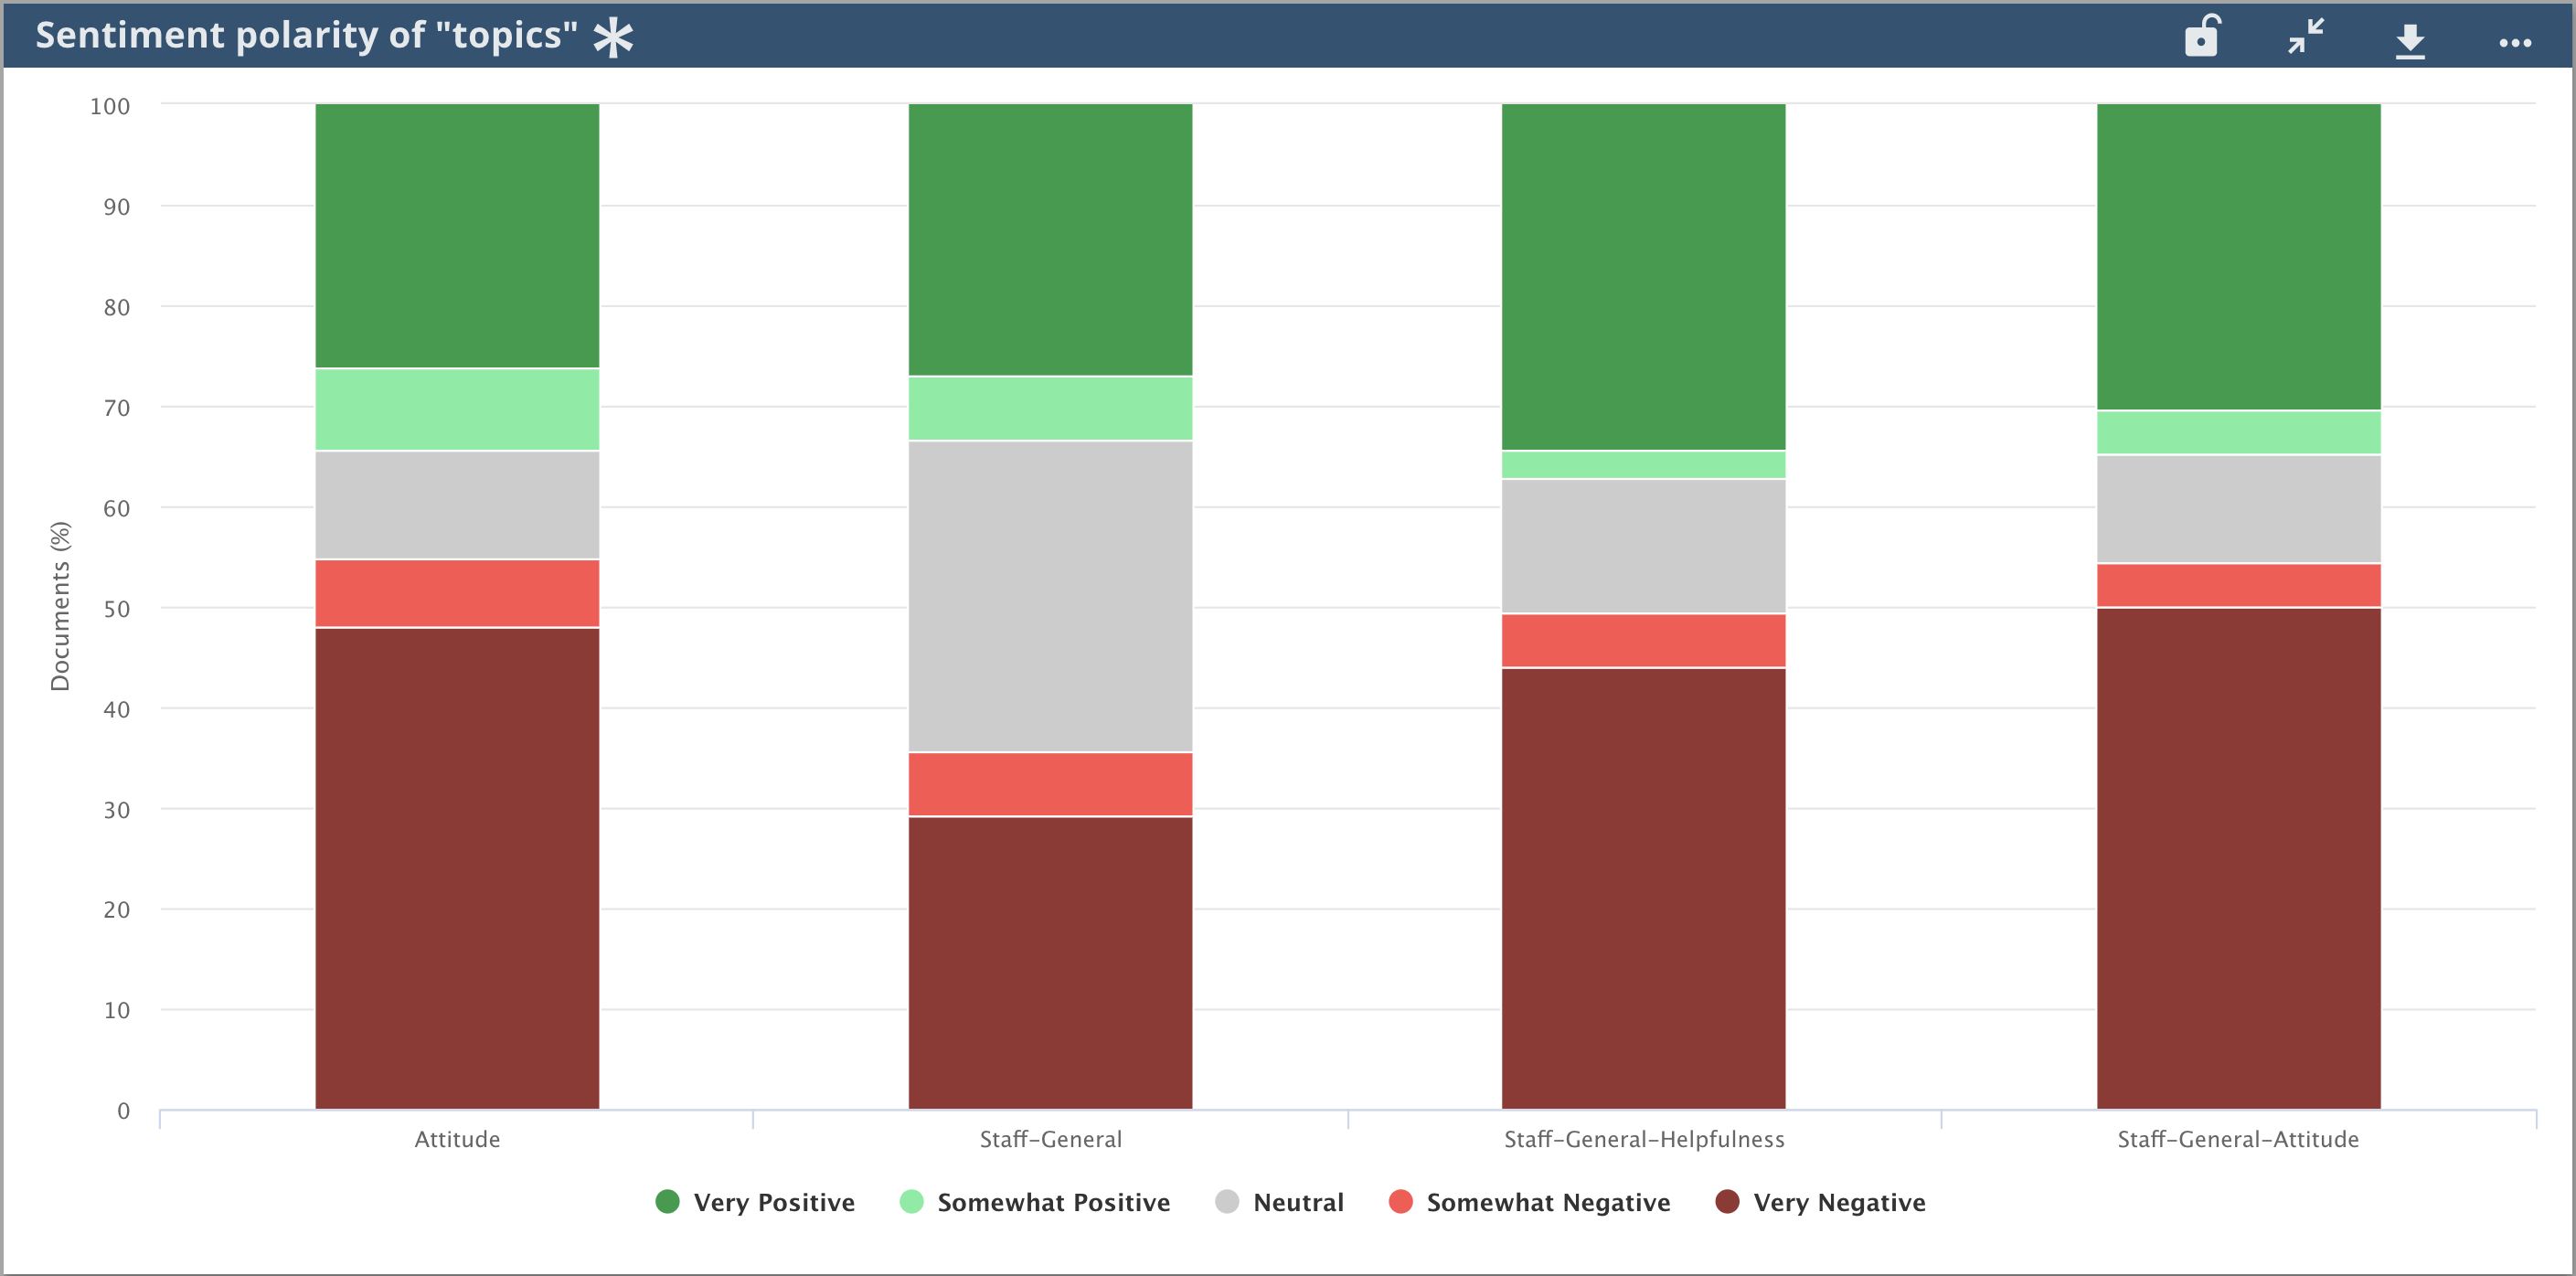
The left side of the first text analytics dashboard is focused on overall mood, as indicated by the sentiment and positive or negative evaluations from the top 5 text categories. The second dashboard, on the right, provides a visual view of a specific customer group. An infographic shows the criteria applied for customer segmentation. Sentiment thus reflects a segment-specific value determined by the results of automated text analysis, combined with survey data or CRM data for customer segmentation.

Generating Actionable Information

Modern dashboards and reporting systems have to be usable as a springboard for action, facilitating or suggesting necessary follow-up action steps. There are differing approaches to realizing such capability, such as

• Single sign-on (one-time authentication via central access point to all systems relevant for the user), which allows combined usage of different existing systems

• Processing into a single system, allowing users to switch between various modules at any time

• Custom buttons can be integrated into the respective reports at relevant places which launch action planning or individual case management

Challenges

Comprehensive touchpoint management requires a solid base of data. The very best visualization cannot bring success if relevant information is missing. This means that the necessary data from the various departments and communication channels has to be structured and compiled in an appropriate way.

The Right Data

Most companies utilize dedicated systems, which in many cases are deeply embedded within company structures and provide information to a defined group of users. It is important when creating personas to identify and link to the relevant information sources. Modern software can interface with established enterprise systems via standard formats (Excel, SSPS, etc.) or interfaces (e.g. API for Salesforce) in largely automated fashion. This ensures that users start out with the data relevant and important to them. In addition, all content and information generated on the reporting platform can be exported in standard formats (Excel, CSV, SPSS, PowerPoint or PDF) and processed outside the system and re-imported back into company systems.

Changes at Touchpoints

Digitalization has brought many innovations to the market, especially in the areas of data communication. The shift toward new media and technologies has created additional touchpoints which generate new data streams requiring different modes of analysis and display. The content focus at existing touchpoints is changing as well. The challenge is to promptly recognize such changes and render these measurable and useful for touchpoint management. Systemic solutions must be designed to afford maximum flexibility, allowing rapid integration of new information sources and adaptation of reports to meet the changing information needs or the needs of newly added user groups. The present trend is toward configurable solutions offering on-the-fly calculation affording the flexibility required to quickly compile reports and content, including self-service reporting if desired.

self service reporting

Success Factors

Very few enterprises have comprehensive touchpoint management in place. Intuitive reporting systems are required to ensure transparency regarding risks and opportunities across all touchpoints, but also certain resources must be available as well in order to utilize such systems. Pioneering enterprises that invest in comprehensive touchpoint management will face the upfront challenges outlined above.

There will be few if any overnight success stories to tell, as sustained effort, patience, persistence and perseverance will be critical, along with solid phased implementation planning taking account of both system and personnel resources required. Then as the “low hanging fruit” is harvested, efforts can proceed to plan the next steps and prepare for wider rollout.

How many times have you wished for another pair of hands or a couple more hours in the day to get through your work as a Customer Success Manager?

Between onboarding clients, liaising for customer support, and negotiating an upsell, CSMs juggle many essential functions.

We’ve gathered some tips and tools to help you be more productive with less stress.

Tips:

  • Create a calendar-prep sandwich

Having some quiet time before the day starts to strategize and prioritize will allow you to go through your day with less need to juggle. This time at the beginning of the day can be a time to review events from the previous day, catch up on emails, or prep for your meetings, but most importantly, set aside about 15 minutes to prep your calendar and to-do list for the day and look ahead to the rest of the week.

Set aside another 15 minutes at the end of your day for another calendar and to-do list prep session, during which you can update everything based on your notes from calls and meetings you had. Making this prep-session sandwich a habit will improve your organization and help you transition between meetings and calls more confidently.

  • Schedule “buffer” time between meetings/calls

As you schedule your meetings and calls, be sure to include a buffer zone of time in case something takes longer than you had anticipated. Include travel time between meetings if you have to physically be somewhere else and add some time for traffic or delays. Even if everything goes according to schedule, having that buffer gives you time to take down notes on the call, expand on any thoughts you had, as well as create and schedule tasks based on your prior meeting or call.

  • Prioritize ruthlessly, batch related tasks together

A large part of managing your time is mercilessly prioritizing your tasks and following through on the important tasks first, rather than the easily completed ones. Be sure to take on projects that will pay dividends in time-saved and customer retention in the future, like mapping the customer journey, or periodically reviewing the onboarding process. These are tasks that you have got to schedule with high priority or else they won’t get done.

Once you’ve prioritized, group together tasks that are related, whether they are for the same client, or they are on the same web application. This will allow you to complete more tasks without having to break your workflow to switch gears too often.

“Do not try and make every customer happy all the time. Prioritize programs that generate tangible business outcomes for their team. When you focus on making the customer successful with your product or service, things like retention and renewal become an easy conversation.”

– Omer Gotlieb, Co-Founder & Chief Customer Officer, Totango

  • Micro-breaks: Do something to clear your mind between meetings or tasks

Once you’ve completed a set of tasks, get ready to switch gears to another set of tasks by doing something quick to clear your mind, preparing your brain to use a whole new set of neural connections. For you, that might mean getting up to walk around the office, having a little stretch, or meditating at your desk. Check out this website for some more mind-clearing methods for between batches of tasks.

For a more comprehensive guide to time management check out this article!

Tools:

ToDoist:

ToDoist is a to-do list application available on nearly every platform or device you can think of. It uses natural language processing to make entering tasks incredibly fast. Advanced users will appreciate paid features like custom labels and filters, location-based reminders, templates for recurring projects, as well as the ability to collaborate with co-workers. Even if you use this app for its most basic functions, it is straightforward and clean to use for task organization.

Google Calendar:

You’ve heard of this one, and may even be using it already for your time management. But are you using all of Google Calendar’s features to their fullest extent? For example, you can create an event and ask Google calendar to “find a time” or give you “suggested times”. Before you use either, be sure you have added everyone who needs to attend the event. Then click the “suggested times” below all of your names and a pop-up will show you some options for times you can meet.

While you are at it, calendar your 15 minute prep sandwich as a recurring event and schedule buffer time you need between major calls.

For more features you may not be using in Google Calendar, click here.

SmartDay:

SmartDay is a hybrid calendar and to-do list. You can add events, tasks, and notes, and then share them with others. SmartDay’s prime value is its focus on collaboration. Comments can be added to any shared event or task, and tasks can be delegated to different team members, which automatically schedules them in the individual’s calendar. The star feature is SmartDay’s automatic task scheduling. When you add tasks for your various projects into your list, SmartDay places them on your calendar in the free time between your appointments.

RescueTime:

RescueTime is an app that tracks the time you spend on applications and websites during your day. It informs you both when and how you are productive or distracted. RescueTime helps you be aware of where your time goes and more intentional with how you use your time.

Retain more customers. Sign up today for free Net Promoter Score feedback with InMoment.

Bang!

The starter pistol has fired for the relay race and you’re sprinting to get the baton to the next runner. As soon as you pass them the baton, they’re off to the next runner, and then the next, until the last runner crosses the finish line.

Using webhooks is like a digital relay race, with a trigger in one web application starting a sequence of events that passes data from one platform to the next, optionally triggering an event in each as the baton gets passed through the relay sequence.

You’ve got a team of software platforms that you use, like Zendesk or Intercom for support requests, Wootric for customer feedback, Salesforce as your system of record for Sales & Customer Success, and Tableau for analytics. With webhooks, you can create a digital relay of data. Once these systems are passing info to each other you can accomplish all kinds of workflows that streamline data collection, analysis and action. 

To skip the technical definition to get to the uses of webhooks, click here!

What Exactly are Webhooks?

Webhooks are “user defined” notifications that allow a web application — a.k.a. a cloud-based software platform or software system — to provide or receive real-time information to or from another web application about an event’s completion.

Webhooks can be incoming, i.e. the app is getting notified when something happens along with context around that event, or they can be outbound, i.e. the app is sending notifications out to other apps about events that occur within its services, along with context around that event.

It is inefficient to constantly request data from another network (a.k.a. polling for new data at regular time intervals in engineer-speak) and many internet browsers cannot support having an open connection between two web applications. Webhooks are an efficient, flexible, and convenient way to bring up-to-date data into the web applications you use regularly.

Compared to hiring a developer to create a native integration of one application on another, webhooks are a tech-lite method to sync data and trigger workflows across multiple applications. This also has the benefit of letting you work mainly on the software systems that you are most familiar with.

What are Webhooks Used For?

Webhooks’ capabilities allow you to:

  • Know that a specified event took place — e.g. a support ticket closed, a payment method was added, a survey was completed (a.k.a an incoming webhook)
  • Let another software platform know that the event took place (a.k.a. an outbound webhook)
  • Ensure that data is synced across all platforms
  • Set off an automatic relay of data and workflow for a network of software platforms

All of these can be combined to create “relays” for insight in a customer feedback program. Here are a couple of common use cases:

Improving Customer Support

Use Case: Zendesk Support Ticket Closure Triggers Email Customer Satisfaction (CSAT) Survey

One prevalent use case for webhooks is triggering a survey after the closure of a support ticket in Zendesk or a customer conversation in Intercom.

Let’s take the support ticket example. Zendesk tickets are loaded with information, like ticket ID # and ticket requester email, that can be sent via a webhook to Wootric to trigger a Customer Satisfaction (CSAT) survey.

This additional information, or properties, allow you to customize the title and body of the email survey that gets sent to your customer.

Having CSAT feedback after support cases are closed can help inform the training and organization of your support teams. You’ll have a better understanding of your customer’s expectations of interactions with the Support team. CSAT feedback at this journey point can help you identify any gaps in your support experience.

Keep the Relay Going: Follow-up with Dissatisfied Customers

Use Case: Salesforce Workflows or Zapier webhook triggers a new case open or follow-up task

Using Salesforce workflows and our outbound webhook, you can close the loop with unhappy customers by triggering a new case to open for Support or Success when a poor CSAT score comes in, or assign a task of follow up to specific individuals. This will show your customers that you are actively listening to their feedback and value it, making it more likely for them to stick with you. It can also clear up any potential miscommunication that may have occurred during the original interaction.

As you plan out your webhooks, be wary of survey fatigue. Wootric has built in protection from sending surveys too frequently to customers so you don’t have to worry about accidentally bombarding customer inboxes.

Take Action or Test a New Strategy with One Segment of Customers

Use Case: Mixpanel Event in Specific Segment Triggers an In-App Customer Survey

Another useful way to use webhooks is to have Mixpanel events, such as a customer creating their first report with your app or completing their first order, trigger a survey for specific segments of users.

Let’s say you are a meal kit delivery app, like Blue Apron or HelloFresh, and you want to test a new dinner party kit.

You can use a webhook to survey the dinner party kit customers the next time they log in your meal kit app. That survey might be a Customer Effort Score (CES) survey (” How easy was it for you to cook your dinner party meal?”), or it might be a CSAT survey, depending on what kind of feedback you are looking for.

This feedback would identify improvements that need to be made to the new dinner party meal kit. It will also identify people who love it. Another webhook can trigger a task be assigned to a marketing team member to reach out to those promoters for testimonials or a potential interview.

Incorporate CX Metrics into Business Analytics

Use Case: Send Wootric Net Promoter Score Survey Data into Tableau or Chartio

Compiling all of your data from multiple web applications for correlating analysis can be tedious and frustrating. Sometimes it can feel like your data is trapped in one app or another with no way of importing that data in real time.

Webhooks allow you to bring data from multiple sources for consolidated, holistic reporting. This helps you create beautiful reports, rich with context, and connect all of your various analyses to guide organizational action.

If you’ve already been surveying customers with Wootric, our dashboard has been helping you manage your customer feedback program. We often see our customers’ business analysts use webhooks to report customer experience metrics, like Net Promoter Score, alongside other KPIs, such as churn or expansion revenue.

Webhooks allow you to take all of the raw data from Wootric and send it to interactive data visualization applications like Tableau, Chart.io, or Looker as the feedback comes in, in real time. The information reflected in charts is updated every time new survey feedback comes in.

Tableau Example
Example of real-time data visualization in Tableau

Create a Holistic View of Account Health
Use case: Send Wootric CX Data to Salesforce or other CRM

Gathering customer feedback to understand the health of your organization often relies on both relationship monitoring through drip/cadence Net Promoter Score (NPS) and journey point monitoring through transactional CSAT/CES surveys.

Example of Account Level CX data in Salesforce

Using all three of these CX surveys at appropriate journey points can provide a bird’s eye view of your customers’ journey, with each survey score reflecting different parts of the entire journey. Wootric offers a native integration to accomplish this in Salesforce, but you can use a webhook service like Zapier to move Wootric data to any CRM. 

Custom Insight Through Creative Webhook Use

Webhooks enable you to customize the segments you survey, the events that trigger a survey, as well as the title and survey question itself. With some creativity and planning, webhooks and CX surveys can get the exact information you want into your preferred web application for insight and analysis.  

Measure and improve customer experience. Sign up today for free Net Promoter Score, CSAT or Customer Effort Score feedback with InMoment.

Airport Series: Dallas/Fort Worth and The Dirty Secret

In our fourth airport analysis, we turn to Dallas/Fort Worth International Airport in Texas. As the fourth busiest airport on Earth, DFW is larger than the island of Manhattan. Every year it caters to 64 million passengers. Here is what they have to say.

Today we’re continuing our ongoing analysis of Facebook reviews for the busiest airports in America. Next up is Dallas/Fort Worth International Airport (DFW) in The Lone Star State, Texas.

Interestingly, DFW was named both the best and worst airport in 2017. What’s more, the results of our sentiment analysis were mostly neutral. These two facts suggest that DFW is simply not an airport customers are particularly passionate about. But, as we’ll see, when Dallas/Fort Worth falls down, it falls down hard. Addressing these foibles could directly improve DFW’s revenue.

Dallas/Fort Worth has cleanliness problems

Dallas/Fort Worth’s Facebook reviews comprise of 88,163 words, split into 2,249 comments. 7% of these pertain to cleanliness. Comments about “gross stains,” “sewage smells,” “human excrement,” cries to “CLEAN UP!” (and worse) permeate the data set. “I was embarrassed to be an American in an American airport.” said one reviewer, returning from a vacation in Mexico.”Gray, dingy, dirty, old…an embarrassment…” echoed another. “I have traveled outside our country, in third world airports even, and they were cleaner then [sic] this airport.”

Remember, airports depend on non-aeronautical revenue. This means they depend on the dollars travelers spend while in the airport. Thus, maintaining facilities to attract consumers is key.

DFW is flailing here. As one woman pointed out, “The ladies bathroom by gate 12 was disgusting, there was pee everywhere…  If I can avoid your airport in the future, I will!”

In fact, our data set is replete with similar examples.

“This airport is one of the dirtiest I have passed through,” one said, then continued, “The bathrooms always smell of urine and the seating has crumbs and spills… I will avoid going through this airport in the future.”

Many more flyers swore off DFW after citing its cleanliness.

“Carpet was so dirty your feet stuck to it. Also family restroom was dirty. The terminal was very old and is in need of updating. If I return to Dallas, I will probably try and fly into a different airport.“

Customer experience is key to airport success

The Airport Cooperative Research Program (ACRP) has repeatedly cited customer experience management as key to the success of modern airports. As they point out in their latest report, “Ad hoc brands are formed over time by the many associations customers have made with an airport. These associations shape the customers’ expectations and perceptions of the services, products, and encounters that they expect at the airport and become the airport’s de facto promise. Actual customer experiences, reports in traditional and social media, and hearsay all contribute to these associations, in good ways and bad.” The ACRP continues, “Airports do not have a choice about whether to be involved in social media; the question is how well they do it.”

The ACRP operates under the Transportation Research Board (TRB), itself a division of the National Research Council. These organizations serve to not just benefit the traveler, but also the organizations they support. So, it’s with no uncertain weight that the ACRP dedicates an entire section of their Report to airport cleanliness. “A statistical study of the drivers of airport satisfaction and dissatisfaction based on a content analysis of 1,095 traveler comments on an airport review website concluded that key drivers of customer satisfaction included terminal cleanliness and a pleasant environment.”

What’s worse than a dirty airport? Waiting in one

Now we understand the gravity of facility cleanliness, it merits asking “what could be worse than a dirty airport?” According to travelers, being stuck in one is even worse. 18% of DFW’s Facebook reviews pertain to waiting: waiting for food, waiting for the bathroom, waiting for the shuttle, and – worst of all – waiting for baggage.

While waiting might seem an endurable irritation, the consequences can be meaningful.

“My 80 year old Grandma had to withstand endless hours of waiting in lines that curved around halls…”

Another reviewer was not as patient:

“You won’t be receiving my money again and I will make sure everyone I know knows that you have raised your rates and decided to cut the amount of buses you have in half. There were families waiting with little babies in the heat while we watched many other buses go by that could have easily been re-routed.”

What should Dallas/Fort Worth do?

Addressing cleanliness and the other factors holding customers back is a simple way to protect the DFW brand. A look into the most positive comments offer a suggestion about how airports can salvage the customer experience for inconvenienced travelers. Individual interactions with staff can make all the difference. While it’s not yet appropriate to call this a trend, it’s a theme we’ve recognized in every airport dataset we’ve analyzed.

Customers take notice of how they’re treated by staff, whether they go online and write about it or not. Employees who are curt, disinterested, or impatient exacerbate already stressful situations. The negative sentiment associated with an unavoidable mishap, like a delay or layover, can be alleviated by a positive staff interaction. This not only helps the customer, it also shores up brand loyalty. As one DFW reviewer laconically puts it, “Friendly and helpful staff at airport… Definitely will return.”

Change Region

Selecting a different region will change the language and content of inmoment.com

North America
United States/Canada (English)
Europe
DACH (Deutsch) United Kingdom (English)
Asia Pacific
Australia (English) New Zealand (English) Asia (English)