How to Improve Customer Retention

There is something to be said about how vital it is to leverage market research to understand your non-buyers so you can convert them into customers. But focusing on how to improve customer retention is just as important, if not more. It is more profitable to invest in existing customers, especially since acquiring a new customer is anywhere from five to 25 times more expensive than retaining an existing one.

The market may be vast, but there is a finite number of potential customers, so making a good lasting impression is key to keeping the customers you have already won, regardless of the industry you’re in. That is why your customer retention efforts are so important.

What Is Customer Retention?

The definition of customer retention is pretty simple: it’s your business’s ability to keep your existing customers coming back to you time after time. But with such a crowded market, that is easier said than done.

Did you know that the average business today loses between 10-30% of its customers annually? Additionally, research by CarlsonMarketing shows that U.S. companies lose 50% of their customers every five years. 

The fact of the matter is that today’s customers have more options than ever before when it comes to purchasing products and services. So, if you aren’t working purposefully to keep those customers, it’s likely they will go somewhere else.

How Is Customer Retention Measured?

We’ve already mentioned a few customer retention statistics, so you might be wondering how those are calculated. Well, let’s do some math here.

Assume the following definitions:

  • CE = The total # of customers when the period ends
  • CN = The total # of new customers that you acquired during the period
  • CS = The total # of customers at the beginning of a period

To calculate retention rate, you need to use the following equation:

  • Retention Rate = ((CE-CN)/CS)) X 100

What Is Considered a Good Customer Retention Rate?

It goes without saying that a retention rate of 100% is virtually impossible. But a “good” retention rate is highly varied by the industry you’re in. Here are some industry-average customer retention rates for you to benchmark against:

IndustryAverage Customer Retention Rate (%)
Media84
Professional Services84
Automotive and Transportation83
Insurance83
IT Services81
Construction and Engineering80
Financial Services78
Telecommunications78
Healthcare77
IT and Software77
Banking75
Consumer Services67
Manufacturing67
Retail63
Hospitality, Restaurants, Travel55

Why Is Customer Retention Important?

Regardless of the industry you’re in, retaining your customers should be one of the top four goals of your overall business (alongside acquiring customers, increasing customer lifetime value via cross-sell and upsell efforts, and reducing operating costs). After all, it is your customers that keep you in business.

If you fail to keep track of your customers, their experiences, and how many of them are staying with you versus leaving for a competitor, you could be bleeding customers (and money) without even realizing it. Need some more convincing? Here are some additional facts for you:

  • 68% of sales come from recurring customers
  • Loyal customers are more likely to share their experience with the company and they are also more likely to purchase from the company again in the future
  • Loyal customers who continue to support your brand will increase your profits
  • iLoyal customers will also recommend your brand and give positive reviews to their family and friends”
  • Returning customers tend to spend more on your brand over time.
  • You get a greater return on your investment (ROI) from repeat customers than trying to acquire a first-time customer
  • Even though only 12% to 15% of customers are loyal to a single retailer, they represent between 55% to 70% of the retailer’s sales. 

How to Improve Customer Retention

The most effective way to improve customer retention? You guessed it! By leveraging your customer experience (CX) program. Your CX program gives you direct insight into how satisfied your customers are with their experience, and then identifies the areas in which you need to improve in order to keep those customers.

There are four cornerstones of customer retention that your CX program helps to support. They are:

Understand Why Customers Leave

  • Exit Interviews: Drive true learnings from the people who understand why customers leave the most (ex customers)
  • Market Pulse Programs: Stay ahead of the competition and learn from our competitor’s customers, other industry customers, and identify other opportunities in the market.
  • Invest in the Right Analytics: Predictive models help to extend lifetime value (LTV) by warning you when specific customers are likely to churn

Eliminate Customer Friction

  • Customer Journey Mapping: Understand moments of impact and potential frustration across your customer journey
  • Employee Forums: Access the employee perspective—and socialize that perspective up the chain of command to create effective change
  • Leverage All Information Sources: Look beyond traditional surveys to include other forms of experience data, such as social data, review site data, operational data, and more!
  • Deploy Microsurveys at Key Touchpoints: Get customer feedback in the moments that matter

Recover Customers Effectively

  • Closed Loop Programs: Address concerns when it matters most
  • Multichannel Listening: Fix broken processes before they become retention detractors
  • Empower Employees: Encourage and train your employees to use their best judgment and make things right without layers upon layers of approval

Drive Deep Relationships

  • Support Teams Consistency: Identify fundamental customer needs and create customized value and benefits
  • Formal Relationship Surveys: Create goal-oriented relationship surveys; look for churn warning signs specific to your business
  • Leverage Loyalty Programs: Leverage your best customers to be your most outspoken advocates

Calculating the Value of Customer Retention Using Customer Lifetime Value (CLV)

At InMoment, we frequently sit down with brand executives and look at real-time metrics that show how much revenue has been recovered due to their closed loop program. Here is the equation we use to prove that value.

Begin with the lifetime value (LTV) of your customer— for example, a prominent pizza chain has publicly stated that their LTV of each customer is $10,000. So, let’s use that for our example. Because your CX efforts are listening to the voice of your customer across all channels, you have the ability to report that last week (hypothetically) you had 300 service lapse incidents across your digital and retail journeys. Multiply that 300 by your customer LTV of $10,000 and you now have $3M of at risk revenue. (Yikes!)

Studies tell us that 50% of those customers will continue to do business with your brand, however, 50% will defect—this is where your closed loop program comes into play. If we resolve the issues with half of that 50% that might defect, we know we have recovered $750,000 of revenue across your brand just in the last week!

From these numbers, it’s clear that, although it can be complex, focusing your efforts on improving customer retention is well worth it! And if you’re using your customer experience program to guide you, you’re sure to create the types of experiences that keep customers around for a lifetime!

To learn more about how to improve customer retention, download this whitepaper that teaches you how to use your customer experience program to improve customer retention and become a revenue generating machine!

What Is Sentiment Analysis? Definition, Types, Importance, and More

There is so much more to communication than just the words we say. Take sarcasm, for instance. Sarcastic comments often rely heavily on irony, conveying the opposite meaning from the one being directly expressed. But this irony is hard to convey without the added benefit of voice inflection and bodily cues (which is why it can be so problematic when someone tries to be sarcastic in a text message or email). 

At the same time, non-verbal cues may even go so far as to reveal deeper meaning even beyond what a person intends to express—lack of eye contact during a conversation may indicate that one is uncomfortable with the situation while leaning forward can mean that they are actively engaged and paying attention. In fact, studies suggest that as much as 90% of communication is non-verbal. And while there’s some debate over the accuracy of that number, no one can deny that there’s more in what we say than is carried in the words we speak (or type). 

This can create real problems for your business. Given that most customer feedback is text-based (such as emails, social media posts, surveys, in-app feedback, SMS, live chat, etc.), it can be extremely difficult to discern the actual meaning behind the words. To keep up with expectations and provide a positive customer experience, companies in all industries need a more accurate way to understand and categorize their customer feedback. This is where sentiment analysis comes into play. 

What Is Sentiment Analysis?

Sentiment analysis is a term that describes the tools and strategies designed to help organizations extract unspoken meaning and emotion from text. By using sentiment analysis to contextually mine written communication for subjective information, your business can gain a greater understanding of how your customers view your brand, services, products, and more. 

At its most basic, sentiment analysis can, with reasonable accuracy, determine whether written or spoken feedback should be classified as favorable, unfavorable, or neutral, and how intensely that sentiment is being expressed. 

To make this possible, sentiment analysis is generally supported by sentiment scoring (also called polarity analysis). Often the polarity or overall sentiment is expressed using a numerical score ranging from -100 up to 100, with 0 representing a completely neutral sentiment. This kind of sentiment analysis scoring can be applied to specific phrases or points in the customer feedback or may be calculated for the entire text. Thus, your organization can apply sentiment analysis to create a mathematical data model representing the overall opinions or attitudes of your customers—either as individuals or groups. 

But sentiment analysis can also go beyond the basics, picking out subtle clues in messages to help you better understand what your customers are feeling and how you can help them have a positive experience. 

How Does Sentiment Analysis Work?

The origin of sentiment analysis as a field of study traces itself back to the mid-20th century, when researchers would comb through and compare written documents to better understand the authors’ intent. But it wasn’t until the advent of digital communication and big data mining that sentiment analysis became a viable business tool. Today, technology advancements in AI, deep learning, and natural language processing (NLP) make it possible for organizations to mine massive amounts of customer data to gauge public opinion, conduct market research, monitor reputation, and better understand the customer experience.

At the heart of modern sentiment analysis are algorithms designed to automate the identification of text sentiment based on specific methods and analysis models. And although individual organizations may differ somewhat in their approach, most sentiment analysis processes fall into one of three categories:

Machine-Learning Sentiment Analysis

Using automated techniques, machine-learning sentiment analysis allows computer systems to learn from provided texts and apply those learnings to future evaluations. To do this, companies will provide the sentiment analysis model with a training set of natural language feedback that has already been tagged with labels showcasing which words or phrases demonstrate a positive, neutral, or negative sentiment. The model takes these correlations and then applies them to new natural language sets. 

Over time, the machine-learning sentiment analysis model becomes more effective at automatically identifying emotional sentiment within text. 

Rule-Based Sentiment Analysis

Rule-based sentiment analysis relies more heavily on human-built rules to locate hidden sentiment within a text. In its most simple form, the algorithm is provided with a detailed lexicon of possible words, terms, and expressions, with each assigned a sentiment score ranging from negative to positive. Then the algorithm simply tabulates the total score from each word or phrase within the text to determine the overall sentiment of the data set. Rule-based sentiment analysis may require further refining to account for things like idioms, sarcasm, or other unique verbal cues.

Hybrid Sentiment Analysis

For increased accuracy, organizations will often combine rule-based and machine-learning sentiment analysis models to create a hybrid approach to sentiment analysis. This allows the model to retain the statistical accuracy of machine learning while also incorporating hand-written rules for a more stable sentiment analysis solution. In this approach to sentiment analysis, different types of classifiers back each other up, so that if one fails, the next can step in to ensure that no sentiment is overlooked.

Why Is Sentiment Analysis Important?

As communication technologies continue to improve, today’s customers expect their voices to be heard. As such, sentiment analysis has grown into an essential tool for monitoring and understanding opinions relevant to business.

Using sentiment analysis to mine these opinions from customer feedback, social conversations, service agent interactions, etc. can give your organization key insights into how customers and other stakeholders feel about your business and its offerings. You can then refine your processes, products, and services to better meet these expressed—and unexpressed—needs. The advantages of effective sentiment analysis range from being able to resolve customer concerns more quickly, to tracking and identifying trends and relevant factors in customer satisfaction scores across predefined periods.

Those businesses that offer a multichannel or omnichannel experience gain further benefits. Sentiment analysis empowers teams to automatically categorize feedback by the channel it was received in, and to develop an accurate picture of customer perception across individual platforms. 

Types of Sentiment Analysis

Even within the categories mentioned above, there are different ways to approach sentiment analysis. Some of the most widely used sub-types of sentiment analysis include:

Aspect-Based Sentiment Analysis

Aspect-based sentiment analysis tracks emotional sentiment related to specific aspects of a business or its products/services. For example, an organization that rolls out a new feature as part of its app may employ aspect-based sentiment analysis to better understand how users feel about the upgrade. Aspect-based sentiment analysis would identify feedback, comments, and conversations relevant to the new feature and determine whether customer sentiment is positive, negative, or neutral. 

Clause-Level Analytics

Clause-level sentiment analysis breaks feedback down into clauses rather than sentences. For example, if a customer were to comment that a clothing product they recently purchased “Looks great but isn’t comfortable to wear,” clause-level sentiment analysis could be applied to better understand just how satisfied or dissatisfied the customer is with their purchase. This makes it possible for businesses to correctly categorize responses that may include both positive and negative sentiments in a single sentence. 

Emotion-Detection Sentiment Analysis

Emotion-detection sentiment analysis goes further than tracking negative-to-positive sentiment polarity and instead detects the emotional state of the person originating the feedback. Like other forms of sentiment analysis, emotion detection relies on lexicons of emotionally-charged words, machine-learning algorithms designed to detect emotional cues in text, or a combination of both. 

Intent Analysis

Customers may reach out to your company or provide feedback for many different reasons—a client who wants a refund will naturally be motivated by intentions that are not the same as those who are merely looking for information. Intent-based sentiment analysis analyzes the objective of the customer, categorizing the message so that it can be more accurately addressed. 

Multilingual Sentiment Analysis

Multilingual sentiment analysis applies the same processes to messages and feedback originating from speakers of more than one language. This adds to the complexity of the algorithms and may require additional processing and resources. In many cases, organizations will train an individual sentiment analysis model to address sentiment in a specific language, rather than attempting to create a model that can analyze sentiment in multiple languages. 

Sentiment Detection

Sentiment detection is a form of sentiment analysis used to pick out emotionally-relevant text from neutral or objective information. For example, sentiment detection applied to a movie review would identify “It was exciting” as a positive sentiment while making note that “The run time was 122 minutes” is simply a statement of information with no positive or negative sentiment attached to it. 

Smart Text Analytics

Smart text analytics can help you gain vital insights from unstructured feedback. This approach to sentiment analysis breaks down silos and connects data from various sources, applying an AI-based adaptive sentiment engine capable of closely analyzing customer messages to identify trends and themes over time. Click here to learn more.

Sentiment Analysis Examples

At the end of the day, most forms of sentiment analysis are tied directly to the words and phrases customers use when they discuss your brand, its business policies, and the products or services you offer. With this in mind, let’s take a look at some examples of sentiment analysis, and why some feedback may be easier to classify than others. 

  • “I love how the new menu is arranged!”
    The sentiment here is fairly straightforward; the customer is expressing a positive feeling and providing clear feedback. Most sentiment analysis tools would have an easy time identifying the sentiment.
  • “Oh man, I sure do love how you increased all the prices. Thanks so much for doing your part to drain my wallet.”
    The sentiment in this feedback is more difficult to identify from the text alone, requiring a more in-depth sentiment analysis. Although the customer is using positive terms (“love,” “Thanks”), they are clearly intending to convey a negative response.
  • “I’m not unhappy with how the product looks.”
    The feedback here uses a double negative to indicate that the reviewer is not fully pleased, but also not fully displeased. Poor sentiment analysis of this phrase may incorrectly attribute polarity beyond what is being expressed.
  • “The new slogan made me 😆.”
    Nonstandard characters can present a real challenge for sentiment analysis tools, unless the tools have been trained to recognize the sentiment of these characters.
  • “The service agent was salty about something.”
    Sentiment analysis tools need to be adaptable enough to take into account new slang as it evolves. In this case, the term ‘salty’ may be too new for some sentiment analysis models to accurately identify as a negative.
  • “The ending of the film was horrifying.”
    Often, whether a word or phrase carries positive or negative sentiment depends on the context. In this example, the “horrifying” ending may indicate a positive response, provided that horror was what the viewer was hoping to experience. To identify this, the sentiment analysis tool would need to be capable of taking other factors into account. 

In each case, the best sentiment analysis tools are those that can help you see beyond the words, and grasp the meaning and purpose behind your customers’ feedback. 

Sentiment Analysis with InMoment

Sentiment analysis can help your business more easily quantify your customer’s experience, providing you with unique insights into your reputation, service, and products. But as digital channels open up ever-expanding sources of customers and user feedback, sentiment analysis tools must likewise scale to meet increased demand. Without the right sentiment analysis solutions, you may find that keeping track of what your customers are saying (and how they are saying it) is prohibitively expensive in terms of cost, effort, and time.

If sentiment analysis is a concern for your business, then we have the solution. 

InMoment, the leader in people-oriented text analytics, brings advanced sentiment analysis to businesses in industries around the globe. leveraging industry-recognized metrics and real-time intelligence gathering, combined with powerful survey capabilities across every common digital channel, InMoment sentiment analysis tools give you the power to quickly and easily gather the insights you need to optimize onboarding processes, enhance product experience, improve customer support interactions, and boost customer relationships like never before. 

Don’t let hidden sentiments hamper your success. Learn how InMoment’s CXInsight sentiment analysis tool can help you get the most out of your customers’ feedback.

CX 101: Sampling Methods

When you want to get information from customers, it might seem nice to be able to ask every single customer. To make that happen, you would need every customer to agree to be surveyed, and it would take an extreme amount of time, effort, and money to then ask every customer your survey questions. Even then, you would have an inordinate amount of data to sift through. It’s true that you could definitively make claims about what your customers are saying, but it’s not actually necessary to go through this level of work. In fact, most likely, it’s not possible to survey every single customer.

Instead of surveying every single person you want feedback from, most people use a concept called sampling instead and rely on sampling methods to research a group. Sampling allows you to get information from a group of people, and when done correctly, the information is also generalizable and usable. We’ll walk you through sampling, types of sampling methods, and how to begin using some of these techniques. 

What Is Sampling?

Sampling is using a group of your population to understand the population as a whole. Think of sampling as you would with sampling a cake. To see if a whole cake is delicious, you can usually tell by eating a slice of the cake. That slice of the cake can tell you a lot about the taste, texture, consistency, and overall balance of the cake—and it’s much easier to eat just a slice instead of an entire cake. Sampling for surveys works much the same way. 

You take a group of your population and survey just them. It’s typically much more manageable and affordable to do so when you’re doing large scale research. From there, your data team will be able to analyze the data from the sample—which is typically a smaller amount that’s easier to glean important insights from. The insights from sampling—if your sampling is done correctly—can then tell you about the whole group you’re researching. And it can help you gather these insights at a fraction of the cost and much less effort than it would take to survey the entire group. 

Difference Between Population and Sample

To better understand sampling methods, it’s important to distinguish between the population and the sample. The population is the entire group of people you want to learn about and to be able to draw conclusions about. For example, if you wanted to determine how your customers felt about a new product, your population would be every single customer that’s purchased the new product from you. If you wanted to research the grocery shopping habits of single mothers, your population would be every single mother. 

The sample is a representative group of your population that will be participating in your research or survey. The key is that the sample has to be an accurate representation of your population. For example, if you were researching the grocery shopping habits of single mothers, you couldn’t go to a local grocery store and survey every person who walked in. You would get data, but it wouldn’t be data about the population you’re trying to study. As with the cake analogy, the sample or slice has to accurately represent the entire cake. 

It’s important to remember that population doesn’t necessarily mean “big” and sample means “small.” Populations can be defined by so many factors: geography, age, gender, income, and so many more factors. You can have a tiny population of just a particular set of customers or a large population like the entire adult population of North America. The larger, more dispersed, or more diverse your population is, the harder it will be to sample. 

What Are Sampling Methods?

When you want to do a survey or perform research, you’ll need to use sampling methods to determine who will be a part of your sample and how it will be related to your population. Carefully consider how you will select a sample that is as representative of your population as possible. In general, there are two categories of sampling methods: probability sampling and non-probability sampling. 

Probability sampling is when each member of the population has an equal chance of being selected to be included in the sample. The sample participants are chosen randomly, and the results from the survey are generalizable to the population as a whole. Probability sampling methods are typically more accurate than others, but they are also more time consuming and expensive to make possible. 

On the other hand, non-probability sampling is when each member of the population does not have a chance of being selected. With these sampling methods, you could choose your sample based on convenience or other limiting criteria that make it so that every person isn’t eligible to be selected.

For example, if you wanted to study all of your customers, it would be a non-probability approach to then just select a sample of customers who have subscribed to an email list. In this situation, you would be limiting who could be selected to those on a list, which may or may not be accurate to your entire population. With non-probability sampling, it’s generally much more affordable and easier to do research, but you do run the risk of accumulating higher amounts of sampling error and reducing the likelihood of having a generalizable sample. 

Probability Sampling Methods

To perform a probability sampling survey, there are several methods that are commonly used. These are some of the most commonly used probability sampling methods: 

Simple Random Sampling

Simple random sampling is the simplest way to get a sample where every member of the population had an equal chance of being selected. To do a simple random sample, you will choose a way to randomly select a certain number of people from your population to survey. Some common methods include using a random number generator, drawing a name out of a hat or bowl, or any other type of chance. 

For example, you could number each customer you’ve had and use a random number generator to determine who will be a part of your sample. You could use a list generator to select certain customers from a list of names or emails. However you do it, the key is that it’s random. 

Systematic Sampling

Using simple random sampling can be extremely time consuming with a large population, so many will instead use systematic sampling. Systematic sampling is using some sort of designated system to choose randomly. For example, you could number all of your customers and choose the tenth individual. Choosing systematically saves you time and effort but still provides you with a random sample. 

Stratified Sampling

Stratified sampling is most useful when you have groups of people who should be sampled from equally. First, you divide your population into groups that don’t overlap (i.e. people from one group can’t be in another group). From there, you’ll randomly select a sample from each group. 

For example, if you were looking at your customers, you might want to break them up by annual income to see if that affects what you’re researching. Your stratified groups would then be done by income, and you would select a small sample from within each group. 

Cluster Sampling

Cluster sampling also involves splitting your population into groups, but these groups should be split randomly if possible. Then, instead of selecting from each group, you will randomly select groups and sample everyone in the group. For example, an airline might randomly select a certain number of flights each day and survey every passenger on those flights. 

Non-Probability Sampling Methods

Since probability sampling can be time consuming, some people will use non-probability sampling methods instead. These methods are generally not generalizable to the whole population as they may or may not be an accurate representation of the population. 

Convenience Sampling

Convenience sampling is choosing a sample based on ease of access. Instead of choosing from a population randomly, you choose from a population based on who is easy to communicate with. For example, standing in front of a grocery store and surveying everyone who walks past is convenience sampling. Not every member of your population has an equal chance to be chosen, and your data will only represent one day at one grocery store.

Choosing customers based on being subscribed to newsletters or who follow your company on Instagram could also be convenience sampling (if your population is larger than just “those who follow us on Instagram”) because it’s all about ease of access. 

Voluntary Response Sampling

Voluntary response sampling is when you select a sample based on who wants to be a part of the sample. The individuals can voluntarily choose to respond or not respond based on a general call for responses. For example, you could send out an email to every customer and ask them to join the study. Those with strong opinions or interest would be the most likely to join, which could mean your population isn’t representative. 

Purposive sampling

Purposive sampling selects a sample based on what a researcher decides. Essentially a researcher will be the one to determine if someone is in the sample or not. For example, you could put out a survey, and the researcher would then only look at the surveys for people who they decided met a certain criteria: like having purchased the most recent product. 

Snowball Sampling

Snowball sampling is used when a population is hard to reach. For example, if your research requires data from shelterless people, you may have a hard time reaching them for a survey. Snowball sampling is when you use just a few individuals you can find from this group or even choose participants based on whose family or associates you can contact. While snowball sampling isn’t random, it can be useful for certain populations that you may not be able to survey in another way. 

The Bottom Line

Overall, there are many sampling methods to choose from when planning your surveys. The end goal is to try to get your sample to be as representative as possible of your overall population, so you can use the results to generalize about the population and make conclusions. Poor sampling will give poor results. After all, as we all know, if we put crappy data in, we get crappy results, which don’t benefit anyone. Choose a representative sample instead for beneficial results
See how InMoment can help you with your sampling and survey efforts to help you choose the right sampling methods to get a representative sample.

4 Ways a Quick Service Restaurant Chain Refreshed a Stale Customer Experience Program

When you think of going to get a quick bite to eat, you’re probably thinking of getting a burger. With so many quick-service restaurant chains to compete with, how can one chain expect to stand out above the rest? One family decided to perfect freshly sliced sandwiches, custom menu items, and a never before seen “light” menu that features low calorie salads and sandwiches. Their revolutionary blend of quick-service speed and made-for-you care helped them create as many smiles as they did sandwiches. 

Despite their global and loyal fanbase, the quick service restaurant chain experienced a period of stalled sales and mixed reception to marketing messages. It was this period of confusion that caused them to revamp their menu. But, as the restaurant underwent a massive change, they realized that their current customer experience platform was ineffective. Therefore, along with the refreshed brand, came a refreshed customer experience program. Here are the 4 ways they refreshed a stale customer experience program: 

  1. Going from Measuring to Improving
  2. Getting the Right Insights to the Right People
  3. Turning Intelligence into Action
  4. Proving ROI Using Purpose-Driven Results

These four strategies helped this chain go from behind the times to a trailblazing leader in their field by partnering with InMoment. Let’s dive in to see how they did it!

Strategy #1: Going from Measuring to Improving

Before partnering with InMoment, this brand was relying heavily on a cloud-based analytics platform to track store performance. However, what this platform did not measure was the customer experience. This brand was able to tell how many meals were ordered in a day, but not how their customers felt about their meals—and if they had a good experience eating their food in the restaurant. 

The brand decided to partner with InMoment based on their ability to implement the quantitative data with customer experience data. InMoment offered them a chance to see a holistic view of individual location performance, automated intelligence informed by data, and employee commitment to enhance the guest experience and drive sales. 

Strategy #2: Getting the Right Insights to the Right People

The quick-service restaurant’s InMoment team was able to take advantage of performance data and customer experience data to offer this brand a monthly granular, location-level report. 

Using these reports, area supervisors could now conduct quarterly, on-site performance evaluations. Then, InMoment would correlate the audit results with customer experience data in an easy-to-review report that gave actionable coaching insights and suggestions for improvement. 

Strategy #3: Turning Intelligence into Action

By sending pertinent data to decision makers, InMoment was able to help the QSR chain foster an environment of growth within the organization. InMoment’s reports—that integrate performance audits and guest experience data—created priorities tied to the greatest return on investment. 

But, priorities aren’t chosen solely from data. InMoment also measures brand loyalty drivers such as friendliness, food quality, and cleanliness. 

Based on the platform-identified priorities and the data received, the brand was able to leverage InMoment’s tech to empower general managers and area supervisors to select quarterly action steps from a pre-populated library. 

Strategy #4: Proving ROI Using Purpose-Driven Results

After implementing these data-driven improvements using the InMoment correlated system, the brand saw a significant increase in key metrics in just eight months; the most notable being a 34% increase in their overall satisfaction (OSAT) score and a 22% increase in product quality. 

Through its re-energized approach, this brand understands that every experience matters, and it’s important to get it right the first time. If there’s a problem, it’s acknowledged and fixed. 

With the combined incremental value derived from its partnership with InMoment—and 

commitment to service excellence—the restaurant continues to inspire smiles through delicious experiences. 

To learn more about how InMoment can transform your customer experience, and to learn more about this brand’s journey, read the full client story here!

How Quick Service Restaurants Can Leverage Customer Feedback in Every Department

In our last blog about creating an excellent food service customer experience (CX), we talked about how vital customer reviews are to growing your business (and how your customer experience plays a pivotal role in making sure your reviews are positive). 

It’s clear the customer experience is vital for any food services business, and in our decades of experience working with the world’s best brands, we’ve noticed a common challenge: food service customer experience data is often very siloed from department to department, and team to team. Too often customer experience data isn’t being shared or leveraged across departments, even though there is tremendous value for all departments to make business decisions that either cut costs, help to acquire new customers, retain existing ones, and grow the lifetime value of your loyalists. 

In order to win in a competitive market, all departments need to have a sense of ownership in the customer experience. Every team should be able to explain how their role connects to the customer and to the customer feedback, from the front line to operations. We are going to walk through how different departments can benefit from customer feedback and some examples of how it can be used. 

How Five Different Departments Can Leverage Customer Feedback in Food Services Brands

#1: Leveraging Customer Feedback in Operations

In food services, operations managers are typically concerned with hiring and training employees, coordinating work and schedules, developing working relationships with front and back of house staff, and more. Where customer feedback can help with these responsibilities is by promoting an internal culture that puts the customer at the center. Your employees need to be on board with what you are trying to accomplish with your customer experience efforts from day one, and giving them a window into the end customer is one way to do that! 

Building employee buy-in comes from rallying around the employees. This can be done in a variety of ways. One example of this comes from an InMoment quick service restaurant (QSR) customer who has had great success by building an employee Facebook group to share success stories. This keeps employees engaged and aware of what is happening within the company, and helps to inspire them to create great experiences. 

Another example of how to rally employees around the customer experience is by using a solution like Moments. Moments from InMoment helps you to build a meaningful experience culture and inspire employee advocates for your program. Moments is available in an app, allowing you to surface valuable comments in an Instagram-like feed, so your teams have access to customer feedback anywhere they go! 

Additionally, customer feedback also helps food services brands to ensure quality customer experiences at scale and across locations. For example, a globally popular restaurant chain and InMoment customer previously used mystery shopping techniques to gather data before partnering with InMoment. Mystery shopping gave this business very limited data that they only had access to once a month. With InMoment, they are able to show stores how they rank on key metrics such as friendliness and value. And, as this program has progressed, they are able to draw correlations between stores that are performing well in the system and their sales. 

#2: Leveraging Customer Feedback in H.R. 

The best way to use customer feedback in human resources is to highlight employee success. Research shows that 79% of employees who quit their jobs say that they didn’t feel appreciated. Knowing this, an InMoment QSR customer built an employee recognition page on their company intranet to recognize employees! This page quickly became the most-read page on their website. 

By highlighting employee success, you will be able to reduce turnover, which means not having to spend the money on training new employees. Our QSR clients say training a new employee can cost them an average of $1900! By reducing turnover, you’ll not only experience significant cost savings, but you’ll also have more tenured employees that create the best customer experiences. And we don’t know about you, but lower costs and better experiences sounds like a whole lot of value to us!

#3: Leveraging Customer Feedback in Finance

Using customer feedback in finance may sound obscure, but it may be one of the best ways to help your business succeed. By listening and digesting customer feedback, you’ll be able to recover at-risk revenue. You can identify where you may be losing customers and reach out to recover them. 

It will also help you build a high sales potential. Forrester research shows that customers who receive positive experiences are 2.7xs more likely to spend more with a brand. By curating a positive experience, customers will be more inclined to revisit and spend more with your business. 

Furthermore, if customers receive a positive experience, they are more likely to talk about it. Research shows that 3% of CX-fueled revenue is from word of mouth. 

#4: Leveraging Customer Feedback in Development

It is important to be aware of where your customers are coming from in order to promote the growth of your business. As a QSR owner, you should be able to look at a map and point to where your customers are coming from. If not, you need to be leveraging customer surveys to answer those questions.

Once you are able to pinpoint where your customers are coming from, you can use it to inform your business decisions. Are you planning on expanding and opening new locations? Your customer feedback will help you decide where to put your stores. 

Leveraging customer feedback not only helps you sustain your current business, but also helps you grow and build your business. 

#5: Leveraging Customer Feedback in Marketing

Any time you unveil a new item, promotion, or special, the customer needs to be at the heart of that campaign. 

A globally popular restaurant chain and InMoment customer recently tested new menu items out in their stores. The company thought it was time for a change, and ended up replacing two items that had been on the menu for years. After taking these older items off the menu, they quickly received heaps of customer complaints asking them to bring those items back. 

For marketers, customer feedback helps you to bridge the gap between what you perceive customers want from your brand, and what they actually need from you to keep coming back for more.

Everyone Owns the Customer Experience—And Everyone Can Benefit

In order to deliver on customer expectations, every department needs to have a line of sight into the customer experience. The information you receive from customers needs to be shared with all other departments and teams, not siloed in different departments, otherwise, you could be sitting on insights that could make a huge difference in your bottomline. When you break down those silos and create channels of communication across departments, your business will see more success in the areas that matter most!

For more information on using feedback throughout your organization, read our ebook here! 

How a Global Grocer Turns CX Feedback Into Realized Customer Spend Targets

The Context

A global grocery retailer was facing the uncertainties of COVID-19 and through their struggle, they found a perspective
that helped them focus on forwarding progression throughout the pandemic. The grocery chain is known for its simple and
continuous efforts to always improve, and that consistent effort through the decades has helped to expand its market position.
The ongoing and steady growth is proof that the brand’s intention where quality is concerned has greatly paid off.

The Opportunity

COVID brought a heightened sensitivity and sense of uncertainty to most of the global grocer’s guests and staff. Along with the
rest of the world, the retailer hadn’t experienced a disruptor of this magnitude, which left most scrambling to understand how to
best serve their guests and help them feel safe while keeping store doors open.

And while they faced an immense challenge, the retail leader also saw an opportunity to emerge into a post-COVID world equipped with reliable data that would revitalize its customer experience, improve customer retention, and solidify brand loyalty. Moreover, the chain decided to challenge locations to optimize customer experience and increase customer spending.The chain looked at its customer experience through the lens of its business goals. They analyzed key business metrics related to
location eciency, staff measures, and stock availability. The big question was, how do customer experience metrics relate to
other KPIs, and which customer metric should they focus on to drive customer spending? That’s when they turned to their team
at InMoment.

The Impact

By linking current store survey data to financial data, InMoment helped the brand pinpoint areas in specific locations that could
increase customer spending. The analysis uncovered that locations with the highest percentages of customer spend had,
higher CX scores, lower employee churn, and on average, 34.41% higher rate of positive first impression scores.

The data showed that 64% of customers left a positive in-store survey response, which correlated to an average of 11% higher
spending. With this, the retailer knew if it could improve the number of positive in-store customer survey responses by 5%,
spending had the potential to increase by +€35m* in as little as six months. The brand leveraged InMoment’s Explore and Coach tools to sort feedback at the highest-performing locations. Ultimately, the chain worked with its InMoment team to identify struggling locations and create an action plan to build opportunities for positive in-store customer experiences moving forward.

The retailer has implemented these measures as a store target in struggling locations, resulting in the proportion of customers
leaving positive in-store survey responses increasing by 3% in the first quarter of the push to meet the 5% goal equating to €21m*.

What’s Next

This global grocer continues to see significant growth as it listens and responds to customer feedback. By consistently aiming to put the customer at the heart of the business, the retailer continues forward progression through its insightful approach despite the
challenges of a pandemic.

Summary

  • 11% Spend Increase Tied to Positive In-Store Survey Metrics
  • 3% Increase in Positive In-Store Survey Score in the First Quarter
  • +€35m* Opportunity in as Little as Six Months


5 Ways to Leverage Net Promoter Score to Boost Customer Retention

You don’t just want to appeal to new customers—you also want to keep your current ones coming back again and again. Not only do returning customers require less introduction to your products and services, but they also tend to spend more than first-time customers, too. 

One user engagement strategy you can use to boost your customer retention is to make use of the Net Promoter Score (NPS) system. Simple to understand, this powerful metric can give you a wealth of information that you can use to improve your brand. 

What Is Net Promoter Score?

NPS is a metric designed to measure customer experience. First, you ask your customers a simple question:

“On a scale of 0-10, how likely is it that you would recommend my brand/product/service to a friend or colleague?”

Then, customers are asked to explain in their own words why they chose the score they did.

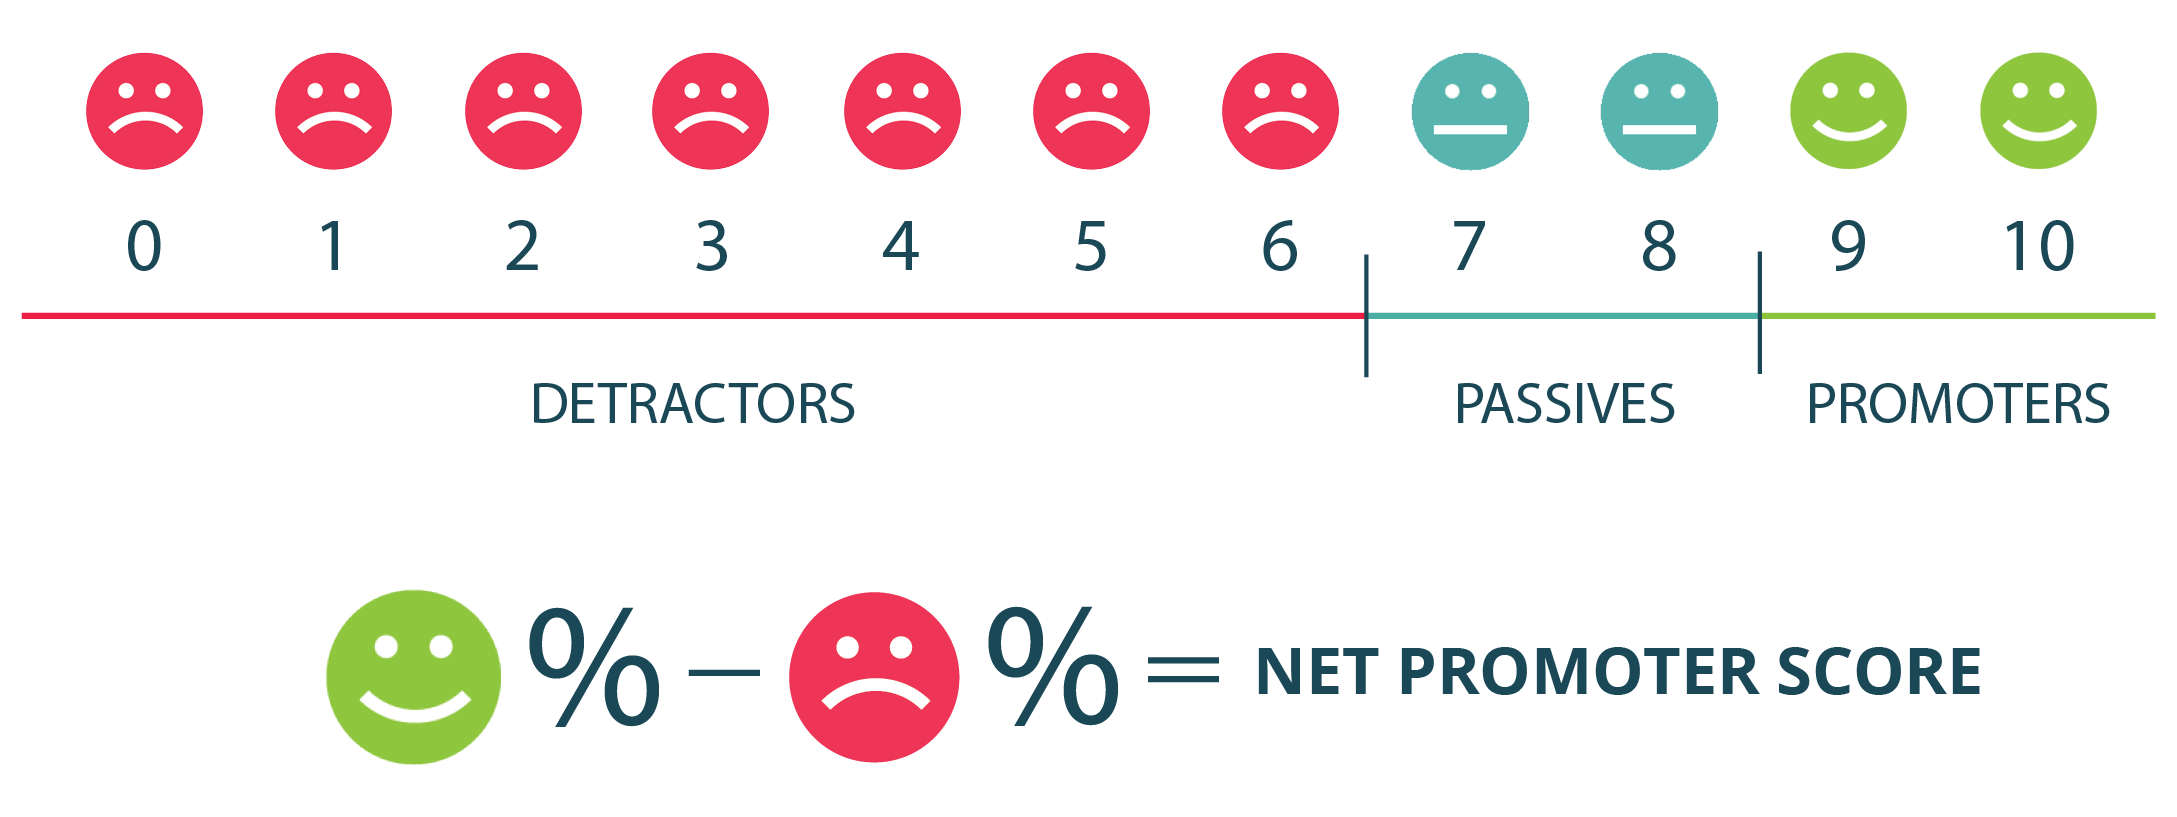
From this, you can place your customers on a scale, where anyone who answered between 0-6 is a detractor, 7-8 is passive, and 9-10 are promoters. 

Net Promoter Score (NPS) calculation

In order to get your Net Promoter Score, you take the detractors away from the promoters.

Let’s say you’ve surveyed 100 people. Of these 100 people, 30 are detractors, 40 are promoters, and 30 are passive. That leaves you with:

40 – 30 = 10

Promoters – Detractors = NPS

Determining your NPS is important, of course, but analyzing the open-ended responses to the follow-up question is what will help you understand the “why” behind your score and make NPS feedback actionable.

What Do These Categories Mean?

Promoters

This category (people who selected 9 and 10) are your loyal fans. They’re likely to be repeat customers, often spending more on subsequent purchases. They generally have a positive view of your brand (meaning if they do contact you with a complaints, they’re often more forgiving). 

As well as this, they tend to refer new customers to you – accounting for more than 80% of referrals for many businesses – and talk about you on social media/in person. You may see effusive praise, with descriptions like ‘we’ve been able to achieve our goals’ or ‘this is the only software I’ll use’, along with thoughtful suggestions for improvement.

Passives

This group (people who chose 7 or 8) tends to be satisfied, but not in the same way as promoters. They’re happy with their purchase, and they might buy from you again, though not nearly as reliably. 

They are unlikely to complain about you to colleagues, but won’t necessarily spend their time singing your praises or talking about you on social media either. They’re also likely to evaluate competitors if they see an interesting advertisement or offer, rather than being wholly loyal to your brand.

Detractors

You might think that a 6 is a high score to count as a detractor, but generally, this group are unhappy customers. Encompassing everyone who chose between 0 and 6, they’re likely to talk badly about you. At the higher end, there might be some positives mentioned, but they’re still going to have complaints. This is where a lot of customer churn and defection comes in.

Sometimes these customers may seem profitable, as many of them may be spending a lot of money with you. However, an NPS program isn’t about the initial revenue generated by a customer or account, it’s about customer lifetime value. Detractors are at risk of leaving your business and can even give your brand a bad reputation (and the lower scorers are likely to be difficult for your staff to deal with at times).

Image Source

What Is a Good Net Promoter Score?

Bain & Company, the originators of the score, consider between +30 and +40 to be a favorable score. (Why are we using +30, not just 30? Because it’s possible to have a negative score if you have more detractors than promoters). As you head up to +50, you’re looking at an outstanding result. If you’re at +80? That’s world class.

However, this will vary based on your industry and your location. Europe and Asia generally mark things more conservatively than the US. So, if you’re comparing your scores to your competitors, make sure you’re looking in the same place rather than at a global average. If your industry is one generally viewed negatively – think debt collection, or property management – then you’re generally going to have lower scores, too.

For this reason, it’s worth investigating NPS benchmarks for your industry, and your location, rather than relying on a general global average. It’s also worth focusing on improving your own score per quarter. If you go from 5 to 15, you may still be below the average, but a jump of 10 points is respectable and means you’re doing the right things.

5 Ways to Use NPS to Boost Customer Retention

Now you know what NPS is, it’s time to take a look at how you can use it to improve your customer retention. 

#1: Make Sure It’s Accurate

Firstly, you need to make sure you’re starting off with an accurate assessment. There are a few common mistakes companies make, including:

  • Asking leading questions on the survey
  • Promising rewards for higher scores
  • Using methods that increase bias (like face-to-face rather than anonymous online surveys)
  • Only surveying happy customers
  • Asking too many questions at once

Using “set and forget” NPS microsurveys can help you avoid these pitfalls.  By starting with an accurate assessment, you can take the right steps. Having a false image of customer success can be harmful, as issues will go unrecognized and unresolved. 

#2: Reach Out to Detractors

Responding to the customers who gave you lower marks is beneficial – both for finding out why they gave lower marks, and saving their business. 

Contact detractors right away.  If you can address their issue right away, you have a shot at keeping them as a customer.  

Even if you can’t meet their needs, it is important that their feedback be acknowledged.

If you lack the time to personally reach out to each detractor, you can still mitigate negative feelings by automating your survey response. Send an email right away to thank them for their response, and ask for more feedback.

Reading through detractor feedback, you’ll gain insights into why they wouldn’t recommend you and be able to adjust accordingly. For example, if half of the detractors respond with ‘processing time is far too long’, then you have something to work toward. 

Sometimes negative reviews are based on service factors, like the delivery company you used or customer support that is slow to respond. Sometimes, complaints won’t be directly about your business. For instance, if you provide companies with a virtual phone number, you might get complaints about it not working. Changing this can instantly boost results. Create the experience consumers expect by prioritizing improvements, drawn from their direct feedback.

Feed this data back into your product roadmap and to your sales team. Designing new products with these criticisms in mind can avoid the same issues in the future. Meanwhile, it also gives your sales team some leeway on what they can offer in response to these criticisms to overcome them at the point of sale or renewal. It’s an extra handy thing to add to their sales playbook

For instance, if a customer is concerned about delivery times, give your customer success managers permission to upgrade them to expedited shipping at no extra cost. If they’ve had issues with subscription software, offer them a feature upgrade. All of these solutions can turn your detractors into passive customers – and potentially even promoters.

Reaching out to Net Promoter Score detractors to boost customer retention

#3: Learn from Passives 

Don’t ignore this group of customers. While detractors are clearly telling you their business is at risk, passives are more likely to silently churn.  It is your job to find out why and whether you should focus attention on this group. 

Segmenting your NPS feedback by business size or other factors will help you decide how important passive feedback is. If passives reside in important accounts or user groups, you may want to understand the “why” behind their lack of enthusiasm. 

One way to do this is to customize the NPS follow-up question. If a customer scores you a 5 or a 6, ask them “What’s one thing we could do better?”   

#4: Engage Your Promoters

Not all of your effort should focus on your unhappy customers, however. You know that this category of people has positive things to say about you – so why not turn that into something official? 

Reach out to them and ask for reviews or personal testimonials you can use on your website.  You might want to automate asking for a review. That way you ask at the right time — moments after a promoter scores you a 9 or a 10!

If you don’t already have referral marketing in place, it’s time to implement it. Roll it out by targeting these promoters, who you know are likely to make use of it. 

This encourages customer retention by giving them special offers, but it also boosts acquisition at the same time. For B2B companies, this is especially helpful if some of your customers are well-known in their field, as businesses are likely to respect their opinion.

Referral and loyalty schemes aren’t always well suited to B2B brands, but customer marketing or a VIP program can work instead. Customer marketing seeks to deepen relationships by providing customers with multiple benefits. One such example might be providing access to your product roadmap as part of an advisory council. Alternatively, you could create a VIP ‘space’, where exclusive content and in-person events are offered.

#5: Thank Respondents

Reach out to your loyal customers, and thank them for being so. 

Getting an email that says ‘thank you!’ is a great boost and encourages them to remain loyal. Video can improve customer experience, so having a thank you video may be worth the investment – especially if it is personalized or includes some behind the scenes content.

While most of these efforts should target your promoters, some of them can be sent out to your passive base, too – potentially converting those 7 or 8 scores into 9s and 10s. Add value to your initial product through a higher tier service, exclusive access to industry information, or trade-in offers. These methods can tempt passive customers into a deeper relationship with you.

Keep Going 

Net Promoter Score shouldn’t be used as a one-off metric, but a regular measurement. To retain more customers, continue to listen to them, learn from their feedback, and take action. NPS is especially helpful for tracking if your tactics are working. You should see an improvement in retention as you begin to implement those suggestions above. 

Equally, you might see a drop if something changes, like an operating system update or switching to an IVR system to route customer service calls.  By regularly tracking NPS, you’ll spot improvements and problems quickly. You’ll know if something is working or not, and be able to mitigate negative effects as soon as possible.

NPS will help you improve the customer experience you’re providing and that’s the best route to customer loyalty

Retain more customers with InMoment, the #1 Net Promoter Score platform for SaaS

The Best Way to Identify (and Share) the Moments that Matter with Frontline Employees

Metrics, metrics, metrics. It’s common for frontline employees like contact center agents to be inundated with them—schedule adherence, efficiency, handle time, and hopefully, amid all of that and more, customer experience (CX) metrics. Ostensibly, the goal with this information is to give contact center agents the guidance needed to create Experience Improvement (XI) for customers, but do they have the time and wherewithal to actually sort through comments and data? Should that even BE an organizational expectation?

Having plenty of data and feedback is certainly important, but inundating your contact center agents with it won’t make them better at their jobs. Today’s conversation briefly covers how to actually leverage data by being tactical and thoughtful with what you share with your frontline employees. We’ll also discuss how best to use data to recognize employees for excelling at the executing moments that matter to customers. Let’s get started!

Sharing What Matters with Frontline Employees

There’s no one specific type of information, insight, or data that supports frontline employees across all industries, but there are several high-level principles that brands can bear in mind when determining what those employees need to know. The first north star to aim for with sharing insights to frontline employees is to consider which of those insights will make your employees not just efficient, but actually better at their jobs and at creating Experience Improvement.

Organizations that make compliance and efficiency the high water mark for contact center excellence will not see remarkable agent performance, let alone the Experience Improvement that you need to acquire and retain customers. Finding the insights, data, and comments that will make employees better at their jobs begins with using an Experience Improvement platform to ingest data (especially customer comments) for actionable insights. Many brands end up wasting time by either trying to manually mine insights out of data mountains, or by gathering metrics and then quitting at that point because they think numbers alone can drive success.

The platform approach can help you avoid both of these pitfalls and make the most of all your data—both qualitative and quantitative. Finding relevant and actionable insights in your data will motivate your employees to act upon Experience Improvement opportunities. Enacting this approach will also enable your frontline employees to provide a far superior experience to customers. This strengthens brand connection and creates a customer-centric culture.

The Next Step

Giving your employees the tools to create Experience Improvement is one thing—demonstrating your appreciation for them successfully doing so is another. All of us—frontline agents, supervisors, and business leaders—can take advantage of data and insights that allow us to simply “be better.” However, there’s one more step on that road that is specifically applicable to driving to top-level frontline work: recognition. 

This is another area in which brands and experience program vendors underutilize  data, unstructured and otherwise. Data is great for strengthening experiences and the bottom line, but with the right plan and structure, it can drive another factor just as if not more fundamental: an employee-centric culture.

Many brands use data to measure employee performance as a matter of course, but  tracking something only accomplishes so much. Brands need to go beyond tracking—they must use data to celebrate success, continually create a positive culture, and recognize a job well done.

This is a fundamental component of being human in all of your experiences, and employees who feel both recognized and a part of the company’s success will be all the more effective in their roles. That is the heart of Experience Improvement, creating a customer-centric and employee-centric workplace, and identifying the moments that matter.

The Frontline Insights Universe

While we’ve covered a lot of ground in discussing how to improve and recognize frontline employee performance, there’s a lot more you can find by checking out my full-length point of view article here. I take a deeper dive into communicating insights to frontline employees, as well as additional strategies you can use to improve experiences for customers, employees, and your wider organization!

What is Brand Equity? The Benefits and How to Build It

When customers are looking for a solution to a problem, they will often turn to a company they trust. Sometimes, they will choose that company even if the product is slightly more expensive because they recognize and trust the name. For example, if a customer is looking for a quick OTC pain reliever, they may turn to Tylenol over a drugstore generic alternative because they know the brand and trust it. That is the essence of brand equity. 

What is Brand Equity?

Brand equity is the measure of the perceived worth of a brand’s product, especially when compared to a generic equivalent product. Essentially, brand equity is a measurement of how much customers trust your brand’s product over another similar product, which can indicate how much more likely a customer is to pick your product over others. The better your brand equity, theoretically the better your company will perform in sales and public perception in relation to other brands. If your brand consistently impresses customers and reaches their expectations, your brand equity will be positively affected. If your brand fails to satisfy your customers because of negative experiences or perceptions, your brand equity will be negatively affected. 

It can be difficult to definitively measure your brand equity, but there are a few ways to gain further insight into how your brand is doing. These are some of the quantitative methods that reflect your brand equity: 

  • Profit margins
  • Price sensitivity 
  • Profitability
  • Growth rate
  • Market share percentage
  • Purchasing frequency

Interviews, social media presence, and customer feedback surveys are another way to gauge how your brand equity is performing. 

Brand equity can help increase your profit margins and how customers view your brand, so it’s an important aspect of your business to nurture. We’ll walk you through the important aspects of brand equity, how to build good brand equity, and why it matters to help you get started nurturing your brand equity. 

Elements of Brand Equity

What is brand equity made up of? Good brand equity comprises several elements. Nurturing each of these elements will help create a full and balanced brand equity that can reach customers and improve public perception of your brand. 

Brand Perception

Brand perception is how customers view and regard a product or service. This is separate from what a company is saying about its own product. Essentially, brand perception is what a customer believes your product or service does—not what a marketing department publishes about the product. While it’s completely possible that brand perception of a product lines up with how a company discusses its own product, it’s not a given. 

There are two sub-stages of brand perception can happen in: brand recognition and brand awareness. Brand recognition is when products are identifiable as belonging to a particular brand. Basically, if a customer sees a product from your company, they would easily be able to identify that it belongs to your brand. Logos and jingles can all be a part of brand recognition. Brand recognition can help your brand become a household name and improve your brand equity. 

Brand awareness is knowing what a brand stands for. While brand recognition means customers recognize your brand, brand awareness shows they understand your brand. Brand awareness is about knowledge, values, and beliefs. A way to think about brand awareness is to think about a customer choosing which brand of laptop to buy. If a customer has a lot of knowledge about how a company crafts their laptops, they have brand awareness for that company. That brand awareness may sway their choice of which laptop to buy, potentially over something like price. Because while one laptop may be cheaper, the customer may be more likely to buy the laptop they feel they understand better and can trust. 

Customer Experience

Customers that have a positive experience with your company are more likely to trust your brand, which can increase your brand equity. Any time a customer comes into contact with your brand is an opportunity to improve their experience and ultimately their perception of your brand. That quality experience with your brand can create a positive impression of your company—and hopefully improve brand equity. The reverse can also be true. Bad experiences with a company can create a negative association with the brand. Doing what you can to improve your customer experience can go a long way with brand equity. 

Quality

Your brand is associated with more than just a product. Brands are also associated with the supply chain, reputation, and trust. Quality across all of these parts of your brand can affect your brand equity. For example, a company that is effective at shipping quickly, restocking, and supplying vendors could increase the quality of its brand equity. In addition, a company with strong leadership, good financial performance, and excellent innovation will also have brand quality—ultimately creating more brand equity. 

Customer Preference

Customers have preferences of brands they buy from, and that can come into play with your brand equity. For example, customers that grew up on a certain brand of cereal are more likely to choose that brand of cereal even as an adult. They simply have a preference for it—as well as more trust and experience with the brand. The same can be said for any brand in any industry. Working with customer preferences as part of your brand equity can help draw and keep customers in the long run. 

How to Build Good Brand Equity

Actively investing in each component of brand equity can improve your brand equity. Refining customer experience, improving quality, and working with customer preferences can help build good brand equity. In addition, building brand awareness, emphasizing positive associations, and forming good relationships with customers are also important to building good brand equity. 

Build Brand Awareness

It’s hard to have positive brand equity when potential customers aren’t sure what your brand is or what it stands for. When customers understand your brand and your products, they are more likely to consider buying them—even when there’s a price difference. You can build brand awareness with strong advertising and marketing, as well as making your brand’s values very clear and visible. 

Emphasize Positive Associations 

Making sure your brand is associated with positive things is an important part of improving your brand equity. To do this, ensure that your business is using responsible and ethical business practices. Those go a long way in giving your company a positive association for customers. In addition, emphasize any time your brand comes into contact with something positive or makes a positive connection or collaboration with an influential organization or person. 

Form Good Relationships

In the end, good relationships with customers are what will truly strengthen your brand equity. Stay in touch with your customers on social media and through any other viable channels. In addition, provide them with excellent customer service through every step of the customer journey. Keep track of negative feedback and use it to smooth out problems in your customers’ experiences with your brand. Ultimately, be authentic with your customers and foster those relationships. 

Benefits of Brand Equity

Brand equity can have a meaningful impact on your company. While it’s obvious that brand equity improves public perception and recognition, there are several other benefits of nurturing brand equity that can really help your company. 

Dedicated Customers

One great benefit of improved brand equity is that you have the opportunity to develop a strong base of dedicated customers. At the end of the day, dedicated customers who support your brand are one of the most important factors for your business future. Loyal customers tend to spend more on average than new customers, and they become advocates for your brand and products. Strong positive experiences with your brand and products through brand equity can help your company reach this. 

Loyal Customer Base: Brand Equity Example

So many brands have been use brand equity to cultivate this passionate customer base. For example, Coca-Cola has actively used brand equity to create a strong sense of brand recognition which keeps drawing customers to its company time and time again. With unique marketing campaigns and recognition as one of the top soda companies, Coca-Cola has developed a loyal customer base that understands what the brand stands for and will continue to purchase its products.  

Extending Product Lines

Positive customer experiences with current products not only improve brand equity, but can also give your company the opportunity to extend its product lines. Once customers trust your brand and know what it stands for, they often more likely to trust future products and services your company offers. That gives your company the opportunity to expand product offerings. A good brand equity will win you lifelong customers that are more willing to purchase new products—ultimately making product line expansion beneficial and profitable. 

Product Line Extension – Brand Equity Example

Many brands have used their brand equity to their advantage in extending product lines. One example is Tiffany & Co, famous for high-end jewelry and engagement rings. Because of the success the company has in jewelry, they have expanded its brand to encompass games, home decor, watches, perfumes, and more. Not only does Tiffany & Co have numerous brand extensions because of its brand equity, but they can also charge a premium for every product sold.

More Impact for Good: Brand Equity Example

One example of a company that has used brand equity to increase their influence for good is Foot Locker. Foot Locker, famous for athletic footwear, has collaborated with NBA stars to award scholarships to student athletes and students in need. They have also worked to be inclusive and diversify their customer base through projects and grants aimed at helping people impacted by discrimination. It comes to show that the more brand equity you can create, the more good your company can do.

Great Impact as a Company

When your company has good brand equity, it is able to make better connections that increase your impact as a company. For example, more success as a brand can lead to brand collaborations that benefit your company and bring more recognition. Your company can also find new investment opportunities or supplier rates that allow you to have greater impact. 

Increased ROI

When customers trust your brand, they are more likely to make future purchases from your companies. If customers are continuing to purchase from your company, you are going to see a return on investment for what you put into improving your brand equity. Brand equity isn’t something that will leave your company without visible results. The ROI for your efforts can be seen in product lines. 

Overall, brand equity is an important measurement of the perceived worth of your company’s products and services over generic alternatives. Brand equity can be cultivated through many aspects of your business, including awareness and building relationships. When your company is nurturing brand equity, your brand can extend product lines and see ROI on investments made in brand equity. 

Here at InMoment, we want to help your company build its brand equity and CX reputation. It’s time to start nurturing your brand equity with InMoment.

Request a demo of our CX solution to see how InMoment can help you improve your brand equity.

4 Keys to Transforming Your CX Program to an ROI-Focused, Revenue Generating Machine

2022 is being branded as “The Year of the Squeeze.” Challenging economic conditions that are bordering on a recession have forced businesses to either raise prices, cut costs, or a combination of both. And due to these conditions, businesses need to justify the return on investment (ROI) for every initiative—including their customer experience (CX) program.

CX Network, an online CX organization sponsored by InMoment, recently asked a panel of over 250 customer experience experts across the globe what the top obstacles complicating customer experience investments were and compiled them into a report. Unsurprisingly, the answers were return on investment, finding budget space, and enabling stakeholder buy-in. 

The key to facing these challenges is to build an ROI-focused customer experience from the ground up (and not as an afterthought). Customer experience strategist Simon Fraser has developed a list of four tools, tips, and techniques to help do just that!

4 Keys to an ROI-Focused CX Program

  1. C-Suite Buy-In
  2. Design with the End in Mind
  3. Holistic View
  4. Don’t Stop

#1: C-Suite Buy-In

Before you can further invest in your CX program, you’ll need the approval of your board or c-suite. In order to do this, you need to talk about the situation and possible complications, as well as answer any questions they are going to ask. 

The situation refers to the environment or sector that your business is operating in. Then, it is important you state the complication. What is giving your c-suite headaches? What problems are they facing? What are they worried about in regards to a customer experience program? Lastly, what questions are they asking that you need to be able to answer through your customer experience program? 

One common question is, ”How can I hold on to my happy, loyal customers who prefer the way things have been, and are opposed to change?” Your customer experience program needs to be able to provide those answers. 

You also need to be able to prove the value of what you are doing in regards to your customer experience program in the terms that matter most to the c-suite. At InMoment, we focus on four economic pillars that most businesses are trying to focus on. 

  • Customer Acquisition: This comes from supporting the brand positioning and positive word of mouth.
  • Customer Retention: Forrester research shows that a customer who receives a positive experience is 2.7x’s likely to remain with your brand as opposed to a customer who has had a negative experience. 
  • Increasing Customer Lifetime Value: Additionally, Forrester research also proves that a customer who receives great experiences is 2.7x’s more likely to purchase additional products.
  • Minimize Costs: This can take many different forms. It might be how you focus to try and move customers to a digital experience or how you can improve to receive less complaints. 

You need to ask yourself: What is it that my business is looking to solve and how am I designing a customer experience program that supports each of these pillars? That is what the c-suite is hungry to understand.

#2: Design with the End in Mind

Have you ever undergone a major home renovation? If you have, you’ll know that during the first meeting with the architect, you don’t discuss where the power outlets are going to be. Instead, the architect asks why you are doing this renovation, what lifestyle you hope to achieve with it, and what will that look like in five years? 

The same train of thought can be used for CX programs and CX strategy. Everything should be tied into your vision as a business. While designing surveys and preparing email marketing campaigns are important, you need to make sure the designs are in line with your customer vision and brand promise, and that your customer experience program can support the changes that you need to deliver. 

#3: Holistic View

A fully functioning CX program cannot rely on transactional surveys alone. You need to be measuring and managing customer journeys, not just transactional data, so that you can improve on the customer experience as a whole. 

There are four categories of data to be examining to accurately run your CX program:

  • Customer Surveys: Aside from transactional surveys, you need to be measuring journeys from a customer perspective and being able to access those points
  • Other Feedback: To build on customer surveys, you need to be managing complaints, social media, and creating a space where your employees feel comfortable providing feedback. 
  • Internal Data: Most businesses will have a strong customer relationship management system (CRM) that will store all customer and behavioral data. Along with that, it will also store financial and operational data from within your business. Integrating this data against your CX metrics is essential to the success of your business. 
  • Market Data: You need to know what your competitors are offering so that you can continue to improve your customer experience and keep delivering on your brand promises. It is also important to know how your potential customers are feeling and what changes you can make to convert them. 

You need to be listening to social media, complaints, and your employees who are likely to understand where your paint points are. By measuring data from transactions, along with internal data, market data, and miscellaneous data, you’ll be able to complete the picture of your customer’s experience. 

#4: Don’t Stop

It is vital that you maintain momentum in your CX program transformation. Remember, customer experience is not a linear piece. Rather, it is a continuous improvement journey. 

You need to ensure that you have the governance around your customer experience program to drive change. Most businesses are looking at experience data that has happened in the past. What you need to be doing, is measuring and managing your CX program and making sure it is continuously evolving with your business. Furthermore, it’s important to develop a “Culture of Commitment” where every employee across every department is focused on continuous Experience Improvement (XI) and understands (and is dedicated to) that mission. Only then will your CX program be truly ROI-focused—and achieve all the success it’s capable of.

For more in depth information on these four steps to building an ROI focused customer experience program, watch the full webinar here!

How to Use CX Metrics to Find Bottlenecks to Product Led Growth

We are all competing in the End User Era now.

Investor Blake Bartlett coined the term “End User Era” to capture an important shift that is happening on an organizational level across industries: “Today, software just shows up in the workplace unannounced. End users are finding products on their own and telling their bosses which ones to buy. And it’s all happening at lightning speed.”

Companies like DocuSign, Slack, Zoom, and Hubspot are examples of SaaS companies that are thriving in the End User Era. Their success is rooted in products that end-users love. Product Led Growth codifies this end user-focused growth model. PLG relies on the product itself as the primary driver of customer acquisition, conversion and expansion. This approach goes all-in on end user ease and productivity to drive growth, and is a radical shift away from the acquisition growth model so familiar in the software industry.

Customer experience (CX) metrics have an important role to play in this strategy—something we explored in-depth in a previous post: Customer Experience in the Era of Product Led Growth.

Customers Will Tell You Where Your Product Led Growth Bottlenecks Are

Metrics are essential to understanding progress on the product led growth curve. Typically the PLG model evaluates business and pipeline health based on user actions (clicks) and subscription revenue.

This is where CX metrics are so valuable. Voice of customer data illuminates the “why” behind the clicks and the cash. Classic CX surveys like NPS, PSAT, CSAT, and Customer Effort Score(CES) monitor customer sentiment—providing critical insight into behavioral and revenue metrics.

By analyzing the open-ended comments that accompany the rating-scale questions you can identify positive and negative themes in what customers are saying. Based on what you learn, you can confidently prioritize improvements to your product that will remove bottlenecks, the enemy of PLG success.

At the core, product led growth is about taking tasks that would traditionally be done manually and putting them into the product to create efficiency and a better customer experience. Step back and map out all of the steps in your funnel from acquiring an initial lead all the way through to turning that lead into a paying customer who sees value in the product. Where are the bottlenecks?

How do you know where your bottlenecks are, and whether you are eliminating them?

Let’s explore each metric to understand how it can help you identify and address bottlenecks, with real-world examples from our customers.

Net Promoter Score (NPS): Loyalty and More

Net Promoter Score (NPS) surveys ask customers to evaluate how likely they are to recommend your product or company to a friend or colleague, this “propensity to refer” is an excellent predictor of future growth.

Unlike the other metrics covered here, which are flexible and easily customizable, true NPS surveys follow a very specific format when it comes to asking the first (of two) questions. By asking that first question in a specific way, using a standard scale, companies can compare their NPS scores to industry benchmarks. The second question, which gathers qualitative data regarding improvement opportunities, can (and often should) be customized.

NPS Surveys ask two questions…

  • Question #1: “How likely are you to recommend this product or company to a friend or colleague on a scale of 0-10?”
  • Question #2: “What can we improve about this experience?” (if they rated you 0-8) or “What did you love about this experience” (if they rated you a 9 or 10).

The first question allows you to calculate your Net Promoter Score, which is a number between -100 and +100 and serves as a benchmark for progress. For detailed information on how to calculate NPS, and what the number really means, take a look at our Net Promoter Score post.

The second NPS survey question is just as important, if not more so, than the score itself because this qualitative data tells you what you need to do to improve end user experience.

Why is NPS key to Product Led Growth? Traditionally viewed as an indicator of growth (as mentioned above), NPS is also a crystal ball when it comes to retention. NPS gives you a glimpse into the minds and hearts of your end users. It can provide a constant stream of feedback about bottlenecks and that will help you create products that enable the ease and productivity you are going for.

In short, NPS captures what’s most important to users, whether it’s documentation, training, or aspects of the product itself. NPS is typically the foundation of any CX program, and since you don’t want to get overwhelmed in the beginning, there’s nothing wrong with making NPS your sole CX metric at this stage.

NPS Example: DocuSign

Docusign logo
DocuSign uses NPS to gather feedback on product features and pinpoint any bottlenecks in the experience. They achieve this by customizing their NPS follow-up question (the one that asks users to explain their score). In the in-app survey pictured below, Docusign asks “Tell us about your experience sending an envelope.”

Wootric NPS Survey in DocuSign

Guneet Singh, Director of CX at DocuSign, believes that regardless of which metric you use, it’s vital to understand how customers feel about your product at key points in their journey. In other words, don’t wait to conduct an annual survey—gather continuous data and refine your product based on that feedback.

Customer Satisfaction (CSAT): Because Support Is a Bottleneck

Customer Satisfaction (CSAT), like NPS, is another metric you can use at various points in the customer journey. The classic use case for CSAT is following up on a support interaction, where you can ask customers about their experience:

  • Solving their specific problem
  • Working with a particular CS agent
  • Working with your company in general

CSAT surveys can use a scale ranging from “very satisfied” or “very dissatisfied,” often followed by a question that asks the user to share the reason behind their score.

What makes this touchpoint so vital from a PLG perspective? Support calls, by definition, are a point of friction—nobody contacts customer support when things are going right.

Product Led Growth endeavors to eliminate support interactions altogether. When was the last time you reached out to customer support at Slack or DocuSign? Chances are, it’s never happened. That’s the seamlessness you’re going for.

This touchpoint is a rich source of insight into frustrations that customers face. Product teams that prioritize end user experience pay close attention to feedback from support as they improve product and design new features.

CSAT Example: Glassdoor
glassdoor logo
Glassdoor, the popular site for job listings and anonymous employer reviews, uses Customer Satisfaction surveys to gather feedback on support interactions. When a support case is closed in Salesforce, end users receive a personalized CSAT survey via email.

Carmen Woo, Salesforce Solution Architect and Senior Application Engineer, holds the cross-functional CX technology vision at Glassdoor. “What is intriguing about our use case is that we use machine learning to analyze feedback. Comments are tagged by topic themes and are assigned sentiment to capture the emotion behind the user’s words.

“The [InMoment] platform allows our Support team to segment feedback by agent and other relevant business drivers to uncover insights that contribute to optimizing our support function, and it can also reveal bottlenecks that are best addressed by improving product features or design,” says Carmen.

Product Satisfaction (PSAT): Adoption and Engagement Bottlenecks

PSAT surveys are highly flexible, and they can be structured the same way you structure Customer Satisfaction survey questions—asking customers to rate their level of satisfaction with a product using a scale from “very satisfied” to “very dissatisfied” (e.g., 1-3 or 1-5) or through a binary response (e.g., “happy face” or “sad face”).

PSAT surveys are best delivered within an app, when customers are using your product and can give you fresh, timely feedback. The customer sentiment derived from PSAT surveys is the necessary complement to behavioral metrics. Sure, you can see in the clicks that users are not adopting a feature, but why? PSAT helps to answer that question and guides optimization efforts.

PSAT Example: HubSpot

Marketers that use HubSpot, the popular CRM software, may recall responding to a Product Satisfaction survey when using a new feature for the first time. PSAT gives Hubspot immediate feedback on whether a new feature is delivering value to the end-user.

Even if you’ve done extensive user testing, getting feedback on a feature within the context of a user’s experience of the whole product is valuable. Is there friction? Should the feature be tweaked in some way?

This approach, which is a key aspect of lean UX design, ensures you don’t go too far down the rabbit hole with a product feature that sounded great in theory but didn’t serve your end-users in the real world. New features can bring complexity — the bain of end user ease. By continually asking for feedback in-product, you can better calibrate that balance and maintain a frictionless, easeful end-user experience.

Mobile CSAT survey for banking app
Example InMoment PSAT survey in a mobile app.

Customer Effort Score (CES): Identify Bottlenecks in Onboarding

A seamless onboarding experience is key to widespread adoption. If end-users have to work too hard to get up and running, they’ll give up and try a competitor’s product. Even if you have an enthusiastic champion within a company, if they have to prod others to adopt or spend time convincing them of your value, their own enthusiasm will wane. As such, it’s important to evaluate how much effort end users must put into getting started.

Customer Effort Score (CES) asks how difficult it was to accomplish a given task using a predefined scale (e.g., 1-7 or 1-5). Here is an example of a CES survey:

Customer Effort Score Survey in Intercom Messenger
Example InMoment CES Survey in Intercom

CES surveys are frequently used to follow up on support calls, but they’re also extremely valuable when evaluating the onboarding experience. Success teams know that the seeds of churn can be sown in the onboarding phase. They have been using feedback from CES surveys to both (1) follow up with that customer to fix the problem and (2) develop tasks and processes that will prevent future customers from experiencing the same bottlenecks.

However, in the context of PLG, addressing onboarding feedback isn’t just the domain of the Success or Support team. It is vital input to UX teams that seek to eliminate tasks that would traditionally be done manually and put them into the product to create efficiency and a better customer experience.

CES Example: Watermark

Watermark is in the EdTech space, and they’ve taken a comprehensive approach to optimizing user experience. Here’s how they do it, starting with Customer Effort Score surveys.

Watermark has a complex onboarding and training process, so they gather data at the end of each of three phases of training using CES surveys. The feedback goes to the implementation and training teams to both (1) improve the process and (2) identify customers who may need extra support. Then, of course, they look for larger trends and modify their onboarding experience accordingly.

Watermark also measures NPS & CSAT.  NPS is measured across six product lines, and Watermark studies the correlation between NPS and renewals. Higher NPS scores predict a greater likelihood for renewal, and improving products based on NPS survey results is key to Watermark’s customer retention strategy. CSAT surveys, triggered from Salesforce Service Cloud when a case is closed, help to evaluate and improve Customer Support.

And as Dave Hansen, the CX champion at Watermark, points out, they dig into the data to identify points of friction. “The feedback we’re getting tells us that there isn’t necessarily an issue with our overall solutions,” says Dave. “You may have issues running a certain report, or you may have issues with the way you have to click through to something.”

Product Led Growth Strategy Is About End User Experience

The four CX metrics covered in this post (NPS, CSAT, PSAT, and CES) offer insight into end user experience and augment behavioral data with the voice of your customer.

Remember, don’t allow scores to be your sole focus. There is gold in the open-ended feedback you receive. Without analyzing the open-ended feedback you receive, the metrics are just benchmarks that you’ll aimlessly try to identify bottlenecks through guesswork. In the end, that won’t get you very far.

Product Led Growth is all about creating a smoother experience in the moments that matter. CX metrics and voice of the customer comments help technology companies do just that.

Get the ebook, “CX FOR EVERY STAGE: How to Scale Your Voice of Customer Program from Startup to Enterprise.’ Learn how to improve user experience for product led growth and loyalty.

How Two Companies Leveraged a Customized Social Listening Solution to Gain Game-Changing Insights

Many organizations are drowning in pools of untapped social data. Why? Because options to structure and analyze that data can be limited and even if businesses are able to compile that data, it often remains siloed from other data, such as voice of customer (VoC), call center, and more. That’s where InMoment’s game-changing customer social listening solution comes into play.

InMoment’s solution not only allows brands to access that data, but also to integrate that with other data sources, providing scalability and the deep, data-driven understanding that teams need to achieve their goals. 

But don’t just take our word for it! Check out the  three benefits real companies have realized leveraging InMoment’s customized social listening solution.

3 Benefits of Leveraging a Customized Social Listening Solution 

Benefit #1: Greater Access to and Value from Social Data

Benefit #2: Structure Massive Amounts of Natural Language Feedback

Benefit #3: Effectively Filter Social Content to Only Extract Relevant Data

Benefit #1: Greater Access to and Value from Social Data

A consumer electronics brand who partnered with InMoment previously approached Voice of Customer by designing, distributing, and analyzing a wide range of surveys. The brand knew they needed to diversify and optimize their approach to customer experience (CX) to continue to improve, so they partnered with InMoment! Their new partnership allowed the company to integrate social media content with their VoC data. This push allowed them to: 

  • Reduce survey spend by substituting social signals where possible
  • “True up” social data with survey responses to explore the feasibility of reducing their survey spend
  • Identify common themes and correlations in the social data to use as a reliable, immediately-actionable proxy for customer survey responses

Benefit #2: Structure Massive Amounts of Natural Language Feedback

A leading architect firm has leveraged the InMoment platform to structure and analyze massive amounts of natural language feedback. The firm now has the ability to achieve a deep, data-driven understanding of customer experience in airports by mining omnichannel social media data from dozens of America’s airports. The result?

  • A data-driven voice of customer program that can help win contracts and build airports that better serve stakeholders and travelers alike
  • More meaningful and accessible analysis of social data via the platform’s intuitive functionality 

And to top it all off? The customized social listening solution had a one week integration time, encompassing three data sources, 869,973 words, 30,000 travelers, and the top ten airports!

Benefit #3: Effectively Filter Social Content to Only Extract Relevant Data

Both brands we mentioned before had what many companies think they need: large amounts of data. But the problem with so much data is that it is difficult to find the signal through the noise and filter out the insights that will really make a difference.  But with InMoment’s social listening solution’s ability to effectively filter out actionale, relevant data, these two companies were able to see incredible return on investment.

Here’s what the benefits look like:

  • Run better surveys by identifying insight gaps
  • Easily configure flexible one-off analyses while also establishing and validating long-term trends
  • Help leadership teams make better-informed decisions around marketing and product strategy

When it comes to mining social data, working smarter, not harder is always the best route to take. Many companies struggle to grasp a true understanding of their client experience, thinking they have an ear to the ground because the data is rolling in. But all data is not created equal! That’s why it’s essential to have  a customized social listening solution to unlock  structured data, analyze for key insights, and capitalize on the most relevant opportunities. 

Learn more about InMoment’s customized social listening solutions here!

Change Region

Selecting a different region will change the language and content of inmoment.com

North America
United States/Canada (English)
Europe
DACH (Deutsch) United Kingdom (English)
Asia Pacific
Australia (English) New Zealand (English) Asia (English)