Shot of a group of young business people having a brainstorming session in a modern office

The success of your CX effort is determined not only by where it lives within your organization, but also by who’s heading up the program and driving its goals, actions, and direction within your company.

This job isn’t easy and not for the faint-of-heart; frankly, CX leaders often end up working against what is natural for an organization. Most businesses are organized into silos: marketing, sales, operations, customer care, HR, IT, finance, etc. These silos all have their own priorities, goals, and KPIs. But customer experience is a ribbon that cuts across these silos, and an effective CX program ensures that hand-offs between silos are clean and that no facet of the customer experience falls into the cracks.

More specifically, marketing drives awareness of your products and solutions, and sets the expectations for how they work and what to expect. Sales sells the vision and aligns the products and services against customer needs. Product development and operations have to deliver against those expectations. IT and the digital team have to provide the tools to keep employees and customers informed and educated, while HR has to get the right people in the right roles to deliver the customer experience.

What to Look for in a CX Bus Driver

A CX leader needs to drive cross-functional alignment, build relationships that elicit cooperation, and break down organizational silos to create coordination across the entire customer journey. They must accomplish this task despite not owning most, if not all, of the departments that ultimately deliver that desired experience.

Again; not for the faint-of-heart.

After decades of leading and guiding CX at multiple companies across multiple industries—and learning our fair share of hard-knock lessons along the way—we’ve landed on eight requirements for successful CX leaders:

  • Willingness to be a change agent
  • Executive presence and sensibility
  • Ability to build cross-functional relationships
  • Lead by influence and persuasion
  • Strong communication skills
  • Analytical and data-driven
  • Financial acumen
  • Results-oriented problem solver

Clearly, these skills are all heavily intertwined, as a CX leader must have strong communication skills to build relationships and influence executive leaders. They must be data-driven with strong financial instinct to convince leadership to change behaviors or to take new actions (building a strong relationship with the CFO and their team is a smart early move).

Looking At The Road Ahead

The success or failure of a CX program depends on many factors: the strategy and goals defined at the onset, the internal commitment to improvements, the executives, the employees, and the foundational and organizational elements that are in place. CX success also hinges upon appointing a leader who is an effective communicator and can sell a vision, create alignment based
on shared business goals, and curate a shared understanding of customer needs, expectations, and journeys.

CX leaders must have the will and influence to drive demonstrable culture change, improvement, and ROI no matter where they report within the company.

Customer experience is a team sport that requires the participation, alignment, and coordination of the entire organization. But the skills and personality of the CX leader and their ability to sell a vision, as well as use data and storytelling to persuade others to change is critical as well. It’s not easy, but nothing worth doing ever is.

Look for the next article on the other organizational elements that need to be present beyond the CX leader and core team. We’ll come full circle on what all you need to ensure Experience Improvement (XI) for your customers, your employees, and your greater marketplace presence.

XI Café Podcast

Welcome back to the XI Café Podcast! The XI Café Podcast was created so that CX program owners around the world could join the conversation and learn from global businesses and industry experts about the latest experience improvement innovations in technology and research services, industry and market expertise, and customer (CX) and employee (EX) engagement best practices.

In this episode, Melanie Disse from Auckland-based CX firm—Melanie Disse Consulting answers questions such as:

  • How mature are Voice of the Customer (VoC) programs in New Zealand compared to other countries?
  • How does your organisation’s VoC program compare?
  • What can you do to elevate the level of VoC program maturity at your organisation?

Melanie is an experienced Voice of Customer strategist with over a decade of experience in CX, insights, research, and data-driven intelligence for some of the world’s leading brands. Melanie explains what drives VoC program maturity and how leaders can increase the reach and effectiveness of their programs to improve customer experience and drive better business results.

Where to Find the XI Café Podcast

You can listen to the podcast on Spotify and Amazon Music, but if you are eager to jump right in then you can click the play button below to start listening to this week’s episode!

More of a visual person? No worries. You can also find the video recordings off the XI Café Podcast on our YouTube channel!

XI Café Podcast

Welcome back to the XI Café Podcast! The XI Café Podcast was created so that CX program owners around the world could join the conversation and learn from global businesses and industry experts about the latest experience improvement innovations in technology and research services, industry and market expertise, and customer (CX) and employee (EX) engagement best practices.

In this episode of the XI Café Podcast we’re talking to Commonwealth Super Corporation‘s (CSC) Katie Bogg. Katie shares how CSC relaunched its CX program to transform the business from the inside out—this includes growing the CX team and launching a series of external and internal initiatives to increase member engagement, leading to a tangible uplift for the entire organisation and its members.

Where to Find the XI Café Podcast

You can listen to the podcast on Spotify and Amazon Music, but if you are eager to jump right in then you can click the play button below to start listening to this week’s episode!

More of a visual person? No worries. You can also find the video recordings off the XI Café Podcast on our YouTube channel!

Expert Survey Builder

What do expert survey builders know that makes them so successful? Well, they’re always designing with the end in mind. From the very beginning, they’re thinking about outcomes such as: 

  • Why does this matter to my customers? 
  • How will I act on this feedback? 
  • What will my business gain? 

Strong and insightful surveys help businesses understand what they are getting right and where they need improvement. However, if your survey isn’t set up to ask the right questions at the right time, the data becomes irrelevant. 

Meaningful Experiences Start With Meaningful Data

To understand your customers and to get the most out of what they’re telling you, your survey design strategy needs to be spot on. Customers are often put off by long survey forms with irrelevant questions, which hinders their overall experience and can contribute to:

  • Declining Response Rates: Respondents fail to complete the survey and others may refuse to participate based on previous unpleasant experiences. 
  • Poor Quality Data: Respondents rush to get through surveys filled with questions that are irrelevant to them, or are forced into selecting answers which do not represent their true or complete feelings.
  • Missing Information: Respondents don’t have the opportunity to leave feedback in their own words on what went well and what could be improved.

Customers who decide to leave feedback through a survey which is built without consideration are becoming disengaged with the very feedback process designed to improve their experiences. But don’t worry, we will walk you through how to be the type of survey builder that takes into account the feedback experience, so that you can understand what actions need to be taken to improve customer experiences and even address your customers future needs!

Build Better Surveys to Improve Customer Experience 

A well designed survey gives your business access to a fountain of knowledge directly from your customers, detailing how you can better improve your product and service offerings to entice customers to do business with you time and time again. And who wouldn’t want access to that information?!

Better surveys means better customer information for your organization to act on, but it also means giving the customer a more consistent, relevant feedback experience. One that doesn’t interrupt, but is a mere continuation of their experience with your brand. 

If the survey questions are sent to the customer two months after their experience and the questions aren’t allowing that customer to express what they want to say, then it’s completely pointless. You will be receiving irrelevant, outdated information and the customer will also be frustrated and put off from leaving feedback. 

To get the most out of your surveys you should:

  1. Listen to your customers in real-time, when the experience is still fresh in their minds so you can capture the most information.
  2. Ask the right questions about the main touchpoints of their journey, not just the start and end. 
  3. Follow up on negative feedback to resolve issues before the customer churns and spreads the word. Negative experiences can often turn into positive ones if resolved in the right way. 
  4. Show the customer you are listening to them by following up with actions you have taken based on the feedback they have taken the time to leave. 

Design Your Survey to Gather Feedback at Every Touchpoint

Customer journeys can change on a dime and the only guarantee is that today’s journey looks nothing like yesterday’s—and tomorrow’s will certainly be something new. That’s why survey builders need to consider how to gather feedback at every touchpoint in real time.

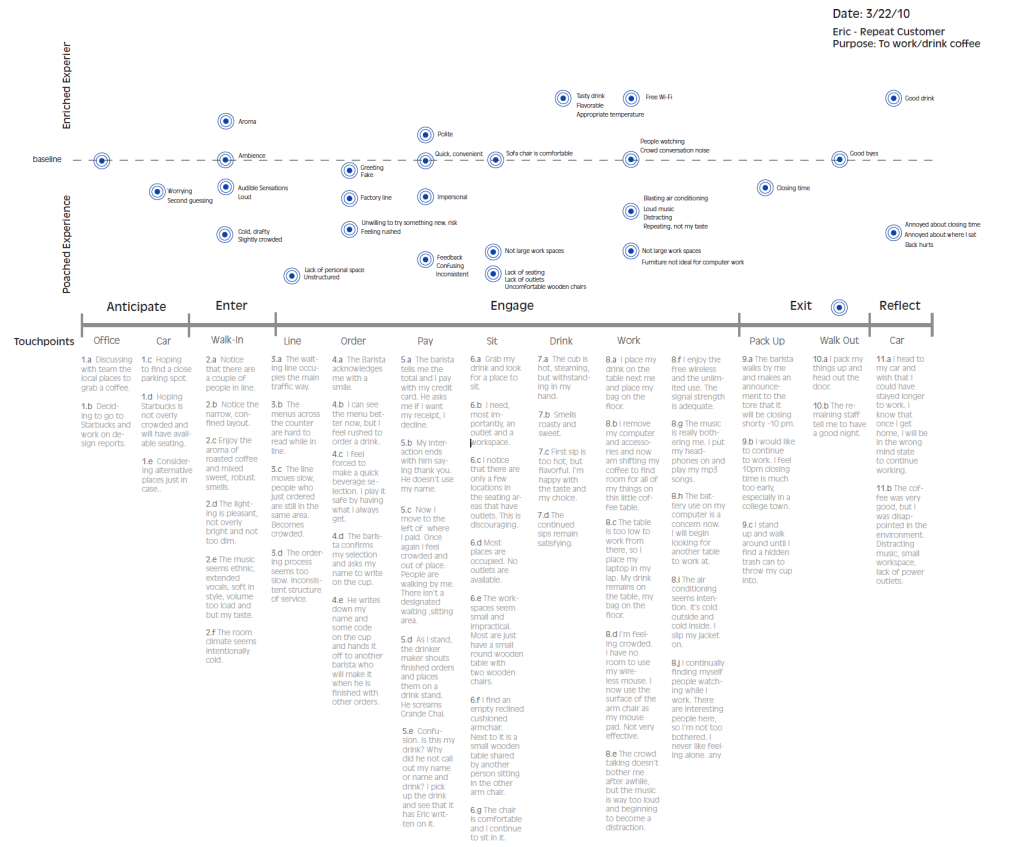
Journey mapping workshops help you predict and plan for changes in customer behavior, so while your competitors are scrambling to adapt, you’re prepared to meet the evolving needs of the market. This approach has strong grounding in behavioral science and promotes a focus on the memorable moments within an experience that drive perception and behaviors.

InMoment’s Touchpoint Impact Mapping is an innovative way of understanding the moments that matter to customers. It is unique because it is based entirely on comment data drawn from customer feedback, ensuring a more accurate view of the customer’s memory of their experience. This creates an emotional picture of the journey that highlights what is most important to customers and also allows our clients to prioritize those moments that matter most to their customers.

Watch the video below to learn how banking giant Virgin Money leverages Touchpoint Impact Mapping to optimize the customer journey at key points:

How InMoment’s Active Listening Studio Can Help You Become an Expert Survey Builder

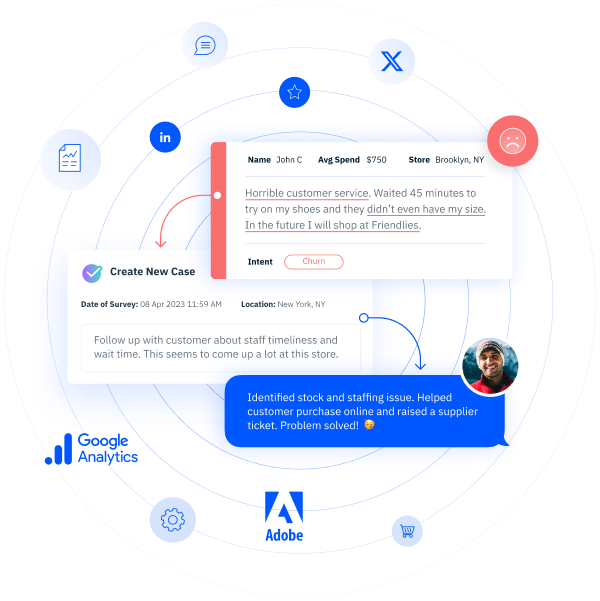
InMoment’s Active Listening Studio is a one of a kind listening suite that gives survey builders the control to gather feedback at every touchpoint, allowing customers to tell you what matters most to them without bombarding them with survey after survey. Active Listening Studio includes:

  • DIY Survey Creation
  • Our AI-powered Engagement Engine™
  • The Rapid Resolution Engine™
  • Our Eligibility Engine™
  • Social Monitoring
  • Multimedia Feedback

Leveraging these tools allows you to create a more effective targeted survey, optimize your listening strategy, and ultimately prove that you’ve improved experiences and your business. One of our global retail clients was even able to increase survey response rates by 37% and response length by 38%!

With an intuitive interface, InMoment’s DIY Survey Creation allows you to actively listen to what your customers, employees, markets, and users are saying. Paired with InMoment’s patented, AI-powered Engagement Engine™, rich conversations are encouraged by listening and responding to customers in real time, eliciting not only more, but more valuable responses.

DIY Surveys are a great way for brands to create and design unique surveys that engage targeted audiences through a multichannel approach. With InMoment’s survey builder tools, you are able to choose from best practice templates or create your own custom survey to match your particular brand standard needs. Plus, you can leverage in-app reporting where you can analyze response and completion rates and review survey performance seamlessly and with ease. 

Engage your audience at the right time to gain critical insights that will help you move your organization from experience monitoring to experience transformation. Whether you’re deploying your survey through multiple channels of distribution (like URL links, QR Codes or email), using our Invitation Management tool ensures the right surveys reach your desired target audience to collect feedback that drives Experience Improvement efforts in the moments that matter.

Want to learn more about how InMoment can help you conduct a better targeted survey—and improve your customer experiences, employee experiences, and beyond? Contact our team today and we’d be happy to explore the right options for your business!

Failure Demand

My name is Ton Luijten, Customer Success Director + Data Science Lead in APAC—and in this post I’ll help you unlock a new take on ROI—through failure demand.

When we manage client programs at InMoment, return on investment (ROI) is always top of mind. We strongly believe this should be a top priority for any team trying to improve customer or employee experiences to show that they are positively contributing to the financial outcomes of their business. 

Most people will instinctively believe that by improving experiences we will improve retention, reduce customer churn, and lower business costs, but proving this is the hardest and most important part of proving your experience program is actually moving the needle at your organization. 

Let’s take a look at how considering failure demand can help you prove ROI.

First Up, What Is Failure Demand?

Failure demand is when an organization falls short of servicing customers on the channels they are seeking, which then causes demand for services in other channels. 

A classic example is a customer that wants to find information on a brand’s website, but they fail to find the information they need—this usually ends up with a call to the call center. 

Why Is Failure Demand Such a Fail? 

Failure demand is problematic for brands as it means the customer experience is not optimized and the customer cannot get the service where and when they want it—not to mention, there’s a cost to the organization to service this additional demand. 

By reducing failure demand, brands have an opportunity to both improve the customer experience, but also create positive financial outcomes for the organization. 

Where Do We Start When Reducing Failure Demand? 

To reduce failure demand, we first need to measure it. Ideally you would be able to use operational data for this, but there are a few problems with this method. If we revisit the earlier example—how does the organization measure that the customer visited the website before they called into the call center? If the customer mentioned this on the call, the agent could take a note of this for their file, but we know these notes are typically inconsistent and hard to analyze at scale. 

When I work with clients at InMoment, we’ve built custom text analytics sets to analyze call center notes—all with the hopes of understanding what customers are calling about. Then, brands can identify topics that attract large call volumes and work out which ones have the potential to be moved to cheaper channels (most likely online). While this is really exciting work, it does take an investment of time and money.

Another option for monitoring failure demand is to use web intercept technology with session recording to understand which journeys across the website cause the most dissatisfaction. 

However, with this option we’re already going into the space of asking customers for their feedback and not just relying on operational data. It also doesn’t allow us to find out what customers did after the failed journey, so limits our visibility on the impact on other channels.

So, What Can We Do To Reduce Failure Demand? 

I’m proposing an alternative option that’s simpler and leverages a solution that most organizations already have in place—post interaction surveys. These four questions will give you the information you need to measure failure demand and prioritize areas for improvement. 

Here are the questions to ask in your post-interaction survey: 

Question #1: Was Your Issue Resolved?


Most CX professionals won’t be surprised by this question as post interaction surveys typically include something of this nature. It’s particularly important for measuring failure demand because you don’t want to cause repeat calls. Of course, it’s also a poor experience for the customer.

Question #2: How Many Times Have You Contacted Us to Resolve That Issue?


It’s important to ask this when measuring failure demand because we want to avoid repeat calls and try to close out issues as quickly as we can.

Question #3:  What Channels Did You Use to Resolve This Issue?


This is a multiple choice question, so customers can select all the channels they have used. This is really important as it allows us to understand which channels they used and how many they used. The latter is critical for failure demand.

Question #4: What Is Your Preferred Channel to Resolve This Issue?

The list of answer options is dependent on the selection made at the previous question. By combining this question with the previous one, you can figure out which channels the customer has actually used and which one they would have preferred to use. This insight allows you to prioritise which improvements you need to implement for the different channels and reduce failure demand, as you will be able to resolve customers’ issues via their preferred channel, which means they no longer need to use multiple channels.

Wrapping Up

Of course, these four questions are contingent on the organization understanding what the original issue is. If we don’t have that information, we should also work that question into the post-interaction survey.

By combining all this information, your brand will have the magic formula—you’ll be able to understand the current state of failure demand, identify key areas for improvement to take action, and measure progress over time. 

Analysis of variance

After you do a study or research, you will probably want to know if the results you got mean anything. More specifically, you want to know if there are statistically significant differences between the groups you studied. After all, statistically significant results help you know that what you studied—the variables you chose—are having an impact on the results. 

For example, let’s say you did research on your customer base, and you wanted to determine if certain age groups bought your product more than others. Once you have your data, you need to determine if there’s any statistically significant difference between the age groups. How do you do that? 

One way to determine if there are statistical differences between groups is to do an analysis of variance also called ANOVA. What is analysis of variance? Read on to learn more about ANOVA tests and how to use them for your own analyses. 

What Is Analysis of Variance? 

Analysis of variance or ANOVA is a statistical test developed by Ronald Fisher in 1918, and it’s been used by statisticians and researchers ever since. The analysis of variance test is a way to compare means from different groups and determine if the differences in those means are statistically significant. If they’re statistically significant, that means the variable for that group is having an impact on what you’re researching. If they’re not statistically significant, then your variables aren’t affecting what you’re studying. 

Let’s revisit the example from earlier. You wanted to determine whether 18–24 years old, 25–35 years old, or 36–45 years old buy your products more. You gather all of your data about how much people are buying based on a random sampling. You determine the mean for each age group on product purchases. ANOVA is then how you can determine if there’s a statistically significant difference between those means. 

An analysis of variance test will take into account the sample size and differences between means to give you an F value. The F value can then be analyzed to give you a probability or P value—or the probability that there’s a statistically significant difference. Let’s say you get a P value of 0.03. That would mean your results are statistically significant, and you can reject the null hypothesis. Most likely, that would mean you can determine that age is a significant variable in who buys your product, and you could consider making marketing decisions based on that. That’s the power of ANOVA. 

How Does ANOVA Help? 

At the core of it all, ANOVA helps you determine what variables have statistical differences and what variables are important to look at in more depth. Even more importantly, ANOVA can give you a glimpse into the motivation behind behavior. What’s driving customers to click on a link? ANOVA might help you determine that. Essentially, ANOVA helps by giving meaning to numbers, direction to actions. 

Types of ANOVA

ANOVA is a broad category for several types of tests. The big two to discuss are one-way and two-way ANOVA tests. A one-way ANOVA test is the simplest form of ANOVA. For this test, you’ll need one independent variable and two or more levels. For example, you could use the months of the year as levels but still only test one variable. Two-way ANOVA or full factorial ANOVA is when you have two or more independent variables to test. Two-way ANOVA measures independent variables against each other and if independent variables affect each other. 

There are a couple of other types of ANOVA to consider: 

  • Welch’s F Test ANOVA. The Welch’s F Test doesn’t assume the variances between groups are equal, which can be beneficial for some data sets.  This type of unranked ANOVA test works when there are two assumptions that are true about the data: 
    • The sample size is 10 times greater than the calculation group (satisfying the Central Limit Theorem)
    • There are few or not outliers in the data distribution
  • Ranked ANOVA. If these assumptions above don’t hold, you can instead use a ranked ANOVA test. Ranked ANOVA tests can hold up against outliers and non-normal distributions because the values are replaced with a rank ordering. 
  • Games-Howell Pairwise Test. This ANOVA test doesn’t work with the assumption that variations between distributions are equal, and it’s a test when there’s a higher likelihood of finding statistically significant results. 

ANOVA Terms to Know

There are some important terms to be familiar with to work with an analysis of variance test. Here’s ANOVA terminology that may be important for you: 

  • Independent variable. This is the variable that you choose to change, and you’re studying how it will affect the dependent variable. 
  • Dependent variable. Variables that don’t change and are instead affected by the independent variable. 
  • The null hypothesis. When you do an analysis of variance, you will have a pair of hypotheses. The null hypothesis will be the one that says there is no difference between the groups you’re looking at. If your p value is less than 0.05, you can reject the null. If not, you fail to reject the null hypothesis. 
  • The alternative hypothesis. Your other hypothesis is that there is a difference between the groups. 

The Formula for Analysis of Variance

The formula for ANOVA is F = MST/MSE. That may look simple, but it involves a few more numbers. The MST is your total sum of squares (all of your means put through a formula) divided by the population total minus one. That gives you the top value for the ANOVA formula. MSE is your sum of squares with error divided by the number of observations minus one. Once you have both variables, you divide the MST by the MSE, and that gives you the F value. With your F value, you can use an ANOVA chart to determine the p value, which will tell you if you can reject the null hypothesis or if you fail to reject the null hypothesis. 

How to Run an ANOVA

That formula can get tricky when a lot of numbers are involved, so not every statistician, researcher, or analyst does ANOVA by hand—though it can be calculated by hand, thanks to creation before computer programs. Instead, most researchers use computer software and programming to perform the test. R, Stata, SPSS, and Minitab are great choices for running an ANOVA test accurately and quickly. 

Drawbacks to an Analysis of Variance Test

An ANOVA test will tell you that there is a difference between means and if that’s statistically significant. But ANOVA won’t tell you where that difference lies. For example, let’s return to our earlier example. You’re testing three age groups for your product purchases. The ANOVA test will tell you that age is statistically significant, but it won’t tell you which group is the one with the biggest difference. You’ll need to do additional statistical tests to determine which age group is most interested in your product. 

Analysis Is Easy with InMoment

Statistical tests can be overwhelming, including ANOVA. While it’s always possible to do an analysis of variance on your own, it’s usually easier and more accurate with some support. InMoment is here to help. Whether you’re conducting a survey, research, or analysis of variance, the process just got a lot easier with InMoment. Book your demo today and see how you can simplify your processes.
Experience Improvement is InMoment's Mission

Just discovered InMoment? Curious to know a little more about us and our differentiated Experience Improvement (XI)? Well allow us to introduce ourselves! 

Own the Moments That Matter

At InMoment, we have this saying: “Own the Moments That Matter.” This is fundamental to our mission, because those moments—packed full of emotions, judgements, learnings, and more—shape the world we live in. And with every moment, there is an opportunity to make a positive impact; to leave a mark.

But when it comes to your business, there are simply some moments that matter more, to your customer, employees, and beyond. 

Our goal is to empower you with the data, technology, and human expertise necessary to identify the moments that matter, understand what’s working (and what might need improvement), take informed action to solve business problems, and ultimately provide a truly differentiated experience for your business. 

Our CEO John Lewis said it best: “InMoment’s unique combination of world-class technology and expert service enables clients to integrate growing and disparate customer signals and separate predictive understanding from the noise.” 

What Is Experience Improvement (XI)?

Despite increased investment, experience management programs have plateaued. Why? 

Because experiences don’t need to be managed or measured, they need to be improved.

The truth is that monitoring services and D.I.Y. approaches aren’t enough for today’s businesses; they cause program stagnation and make meaningful return on investment (ROI) impossible. Instead, what’s required for success is a new approach: an Experience Improvement (XI) initiative that solves the biggest business challenges, like retention, growth, and cost savings

The Moments That Matter

Improving experiences begins with sifting out the noise from experience data and identifying the moments that matter: where customer, employee, and business needs meet. This allows businesses to prioritize their focus on high-emotion, high-impact areas and connect with their most valued customers. Additionally, businesses can empower their employees to recognize and take action in these moments, ultimately culminating in organization-wide transformation from the boardroom to the break room. 

Data, Technology, and Human Expertise

Experience Improvement is made possible through our industry-leading Experience Intelligence XI technology and our in-house Experience Improvement (XI) services teams. With our ability to collect and gather data from anywhere and in any form with our Integrated CX approach, industry-leading technology, and decades of experience in key industries, InMoment can help you craft an experience initiative that truly meets the unique needs of your business. We are dedicated to being more than just a vendor to our clients—instead we take the role of a dedicated partner committed to a businesses’ short- and long-term success.

The Intersection of Value

Our mission is to help our clients improve experiences at the intersection of value—where customer, employee, and business needs come together.  Ultimately, our clients are able to move the needle and go beyond managing their experience to actually improving it. With the right intelligence, businesses can empower the right people to take transformative, informed action in the most effective ways and drive value across four key areas: acquisition, retention, cross-sell & upsell, and cost reduction. In other words, better results for the business and better experiences for their customers and employees.

The Continuous Improvement Framework

The key to taking an experience program beyond metrics is to move beyond monitoring customer feedback and stories and focus on the formation of actionable plans for changes informed by them. Customer narratives contain meaning that companies can use to diagnose both superficial and deep-seated problems, define remedies to those problems, positively impact the bottom line, and create more meaningful experiences. We help our clients  achieve all of this by sticking to a simple, five-step framework that we call the Continuous Improvement Framework: define, listen, understand, transform, realize. (You can read all about it here!)

What Third Party Analysts & Customers Say About InMoment

And don’t just take it from us—InMoment has received third-party validation from multiple third-party research firms. We have been named Leaders in the Forrester Text Analytics Wave, Forrester Customer Feedback Wave, the Gartner Magic Quadrant for Voice of the Customer, and more! 

Forrester Text Analytics Wave

InMoment received the highest possible score and was named Leader in the Text Analytics Wave report. The Forrester Wave says, “InMoment XI is a solid choice for customers who want a platform with a well-balanced mix of knowledge and ML-based AI, the ability to deploy OOTB solutions quickly, and deep custom application development capabilities.” As mentioned in the report, “InMoment’s people-oriented text analytics capabilities…enable it to address all relevant use cases beyond just VOC or CX analytics.” 

Forrester Customer Feedback Wave

InMoment was also named a Leader in Forrester’s Customer Feedback Wave Report. The Forrester Wave  says, “InMoment is a good fit for organizations looking for a ROI-focused technology and services partner.” As mentioned in the report, “reference customers say they selected InMoment for its technology capabilities and value citing the vendor’s pricing as reasonable and transparent. They also praise the vendor’s partnership and focus on delivering outcomes. References appreciate that not everything is “tool driven;” instead, the vendor  provides strategic guidance, helping them innovate their approach to surveys or embrace new forms of feedback. 

Gartner Magic Quadrant for Voice of the Customer

Furthermore, InMoment was named a Leader in the Gartner Magic Quadrant for Voice of the Customer. The report says,  “InMoment is a Leader in this Magic Quadrant. The company’s Experience Improvement (XI) Platform combines a broad set of VoC technologies as part of an  integrated offering that focuses on blending services and  software to help fulfill its clients’ evolving CX ambitions.  The company has established operations around the world,  with a notable presence in Asia/Pacific.” Continuously, the report mentions,”InMoment is investing in intelligent self-service and workflow automation to help simplify the user experience (UX), while  furthering its vision to support four tailored XI clouds for  CX, employee experience (EX), product product experience  (PX) and market experience (MX).”  

“InMoment has an impressive ability to deliver business value through its consulting-led methods and programs.” – Gartner Magic Quadrant for Voice of the Customer

Industry Dominance

Not only have we been recognized by multiple market research firms, but our success is also shown in our reach across multiple industries. InMoment is currently improving experiences with: 

  • 90% of the world’s leading automotive brands
  • 8/10 of leading banks
  • 4/5 of the top insurers

And one more thing. 100% of our clients would recommend us. 

Recognized as a leader and innovator in our sector, we collaborate with the world’s leading brands to attract, engage and retain their customers. We are fiercely proud that our clients continually tell us they love the experience of working with our company, as we constantly stretch to exceed their expectations. 

Our Experience Improvement (not management) approach provides context to feedback at the intersection of value—identifying what’s important to customers, employees, and the business. Our expertise enables brands to align their CX and EX programs with business goals, prioritize actions, determine and monitor impact of change, address issues, and celebrate successes—all leading to true Experience Improvement.

Does this Experience Improvement (XI) mission align with your vision? You can learn more here!

Sample Size Formula

There’s a lot that goes into creating statistically sound research, but few elements are as important as getting the right sample size. This is because the size of your sample can have a direct impact on your findings. If your chosen sample is too small, your results will likely be inconclusive. On the other hand, overly large samples can make minor differences appear statistically significant while also increasing the time and resource demands of collecting and cleaning the data.

Unfortunately, understanding the need for correct sample sizes and understanding how to select the right sample sizes are two different issues. For effective sample size determination, many researchers rely on the sample size formula. 

Here, we’ll walk you through the sample size formula and how to apply it. But first, let’s take a look at what “sample size” means.

What Is a Sample Size? 

Sample size is a term used in research and statistics that defines the total number of subjects, samples, or observations included in a survey or experiment. 

For example, if you were to interview 50 travelers about their air-travel experience, then your sample size would be 50. Similarly, an experiment that makes daily observations regarding soil content over the space of one full year would have a sample size of 365. And if an online survey were to return 11,328 completed questionnaire forms, then that’s a sample size of 11,328. Simply put, the sample size is the number of samples you’re interacting with.

Sampling allows researchers to select a representative portion of an entire population; to expand on one of the examples provided above, an airline that chooses the right sample group can hopefully draw meaningful and accurate conclusions from interviewing 50 travelers, instead of having to interview every traveler who flies on a plane. 

As previously addressed, sample size plays a key role in any statistical setting—from lab experiments to employee surveys—and is a vital factor in any research project.

What Is the Sample Size Formula?

The sample size formula is a calculation for determining what sample size is appropriate to ensure that the test has a specified power. To do this, we must first calculate the sample size for an infinite (or unknown) population, after which we will adjust our sample size to fit the required finite (or known) population. 

Sample Size Formula: Infinite Population

S = Z² x P x (1 – P)M²

Adjusted Sample Size Formula: Finite Population

Adjusted sample size = (S)1 + (S – 1)Population

In these formulas, the variables are expressed as follows:

  • S = The sample size for an infinite population
  • Z = The Z-score (determined based on the confidence level)
  • P = The population proportion (assumed as 50%)
  • M = The margin of error (typically taken as 5%)

Applying the Sample Size Formula

The formulas presented above may be used to correctly determine viable sample sizes, but before that can be put to work, the values of the various variables need to be defined. 

To correctly apply the formula, follow these steps:

  1. Determine Your Key Values
    The primary key value in this equation is the total population size within your target demographic. Where possible, be as accurate as you can in determining the population number—this will allow for greater statistical impact, particularly when dealing with a small population size. That said, larger populations may allow for some approximation (such as rounding to the nearest hundred or thousand).
  2. Determine Your Margin for Error/Confidence Interval
    Although you want your study to be as precise as possible, it will never be completely accurate. Understanding how much error can be allowed in the study is essential to correctly presenting your findings. This is called the margin for error and is usually represented as a percentage detailing how close the sample results should be to the true value. Smaller margins of error produce more accurate results, but also require larger sample sizes. The margin for error is typically expressed in results as a +/- followed by the percentage.
  3. Set Your Confidence Level
    Similar to the margin of error, the confidence level describes and measures how certain the study is about the accuracy of the sample’s representation of the total population. This is expressed as a percentage, with a higher percentage indicating greater confidence; most studies try to operate within the 95%–99% confidence range—less than that could cast doubt on the validity of the results.
  4. Specify the Standard of Deviation
    The standard of deviation details how much variation you can expect from the results of your study. Will the results be very similar, or are they likely to be spread out? Extreme answers where there is a high deviation are often more accurate. It’s generally accepted that a standard deviation of 50% will help ensure a large enough sample size to correctly represent the population within the margin for error and confidence level.
  5. Determine Your Z-Score
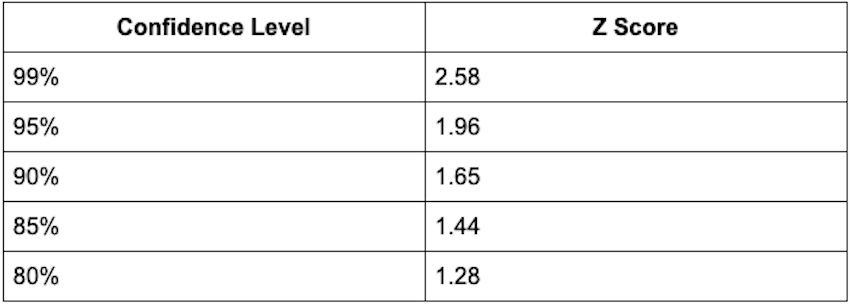
    Finally, the Z-score is a constant value showing the number of standard deviations between the average/mean of the population and any specific value. The Z-score corresponds directly to the confidence level, with the most common confidence levels corresponding to the following Z-scores:
Systematic Sampling confidence level to Z score conversion.

Conclusion

Determining your sample size is the first step in any market research project. Whether you decide to use systematic sampling, simple random sampling, or are looking to alleviate voluntary response bias, you’ll need to identify your sample size before you can take those actions—and improve experiences!

CSAT Score

A CSAT score is a commonly used customer experience (CX) metric that helps a company build a relationship of trust and understanding with its customers. A successful organization knows that a key element of success is a loyal foundation built within its customer base.

On paper, it may seem simple, but in reality, many companies struggle with building a customer-centric foundation within loyal customer relationships. One way to build and maintain solid relationships is to establish a channel for customers to communicate experience feedback to the company. 

The goal of a successful organization is to fully grasp what customers value—as well as dislike—regarding their experience with a business. A proven channel to understand customer sentiment is by implementing customer satisfaction surveys.

What Is a Customer Satisfaction or CSAT Score?

CSAT is short for customer satisfaction score. It’s a commonly used measurement tool that acts as a key performance indicator for customer service and product quality. CSAT is a general term understood, recognized by, and beneficial to a wide variety of industries. 

While customer satisfaction as an idea is a general one, CSAT is a more defined and specific metric that is expressed as a percentage. These more defined metrics can present as any of the four types of CSAT surveys:

#1: Customer Satisfaction Score (CSAT)

#2:  Net Promoter Score (NPS®)

#3:  Customer Effort Score (CES)

#4:  Milestone Surveys

In this blog, the spotlight stays on what CSAT is, but it’s beneficial to have at least a brief understanding of the three other types of CSAT surveys to have a full grasp of the entire concept and how customer satisfaction can play a major role in organizational decision-making processes.  

Net Promoter Score:

Net Promoter Score, or NPS, is a metric that indicates the willingness of customers to promote a company’s product or services and separates customers into promoters, detractors, and passives. While NPS is a valuable indicator of customer satisfaction, it also can surface pain points that can lead a company to revise, shift or fix friction points in the customer journey to encourage positive customer experience that leads to customer promotion. 

Customer Effort Score:

Customer Effort Score, or CES, is a specific customer experience survey metric that enables companies to track the ease of or effort required within the customer interaction with a product or service within the duration of the customer relationship with the company. In measuring CES, organizations gain insights and data that enable business improvements in and around the customer experience to uncover laborious friction points that act as roadblocks to customer interactions.

A Milestone Survey: 

A Milestone Survey is a questionnaire sent out at specific moments throughout the customer journey to help organizations better understand the customer experience over time. A milestone can either be triggered by time (after 30 days) or by experience (after onboarding).

What Types of Questions Would a Customer Satisfaction Survey Include?

When drafting a CSAT survey, it is wise to consider including a variety of questions that explore the different aspects and relationships surrounding the customer’s journey with a product or service. 

The five most beneficial and key question types that provide a wide and valuable range of insight that will likely benefit any organization are:

  • Product Usage Questions
  • Demographics Questions
  • Psychographics Questions
  • Satisfaction Scale Questions
  • Open Ended Text Questions

Product Usage Questions:

Product Usage Questions explore when and how, and why customers are interacting with your product; they will be critical in identifying customer expectations and needs that lead to product engagement. Product usage questions point to the value or lack thereof that a product provides. Listening to the voice of the customer regarding our product will provide clarity and insight beyond what controlled studies can provide. With product usage data, companies can get a more complete picture regarding functionality and value its product provides. 

Demographic Questions:

Demographic Questions can help you determine a variety of components within a population’s characteristics that may influence a customer’s decisions surrounding your product. It’s common within demographic questions to gather information about customers’ income level, marital status, gender,  identity, and geographical location. With product usage segmented data, companies are better informed to make wise business decisions on how to target a specific demographic by utilizing the data from their customer feedback. This data-based information may help you develop products and or services that relate more specifically to customers.

Psychographic Questions: 

Psychographic Questions will give valuable insight into the customer lifecycle by providing you with information about unique customer specifics. Psychographics describe human traits that could include: hobbies, interests, likes and dislikes, goals, values, lifestyle, or physiological tendencies. Psychographic survey questions may help measure the personality traits and tendencies of a customer’s preferences regarding a company’s products and services.

Satisfaction Scale Questions:

Satisfaction Scale Questions may promote feedback and curb survey fatigue as the structure of the question can be an easy way for customers to give an overall sentiment of their experience with the company or product using a single click. The satisfaction scale asks, on a scale of 1-5, or 1-10, how satisfied a customer is. This scale can be as general or specific as the feedback a company would like to receive and can provide companies direction on who their promoter and detractor customers are and allow them to target them according to their overall satisfaction sentiments. 

Open-Text Questions:

Open-Text Questions allow customers more freedom to share and expound upon unique experiences and assist in gathering highly valuable responses not available in other forms of questioning. Open-text questions are relatively harder to analyze as data sets and require text analysis, but they help capture subjective and individualized experiences regarding the customer journey better than other forms of questioning. 

How Do You Calculate and Measure a CSAT Score?

CSAT score is a customer feedback metric measured via one or more variations of this question: “How would you rate your overall satisfaction with the products or service you received?” Respondents use the following or similar 1 to 5 scale:

  1. Very Unsatisfied: ( Where a customer would be considered a detractor)
  2. Unsatisfied: (Where a customer would be considered at risk of churn)
  3. Neutral: (Where a customer would be considered a slight risk of churn)
  4. Satisfied: ( Where a customer would be considered a promoter)
  5. Very Satisfied: ( Where a customer would be considered a promoter)

CSAT scores are usually developed into a percentage scale, with 100 percent representing complete customer satisfaction. The results of a CSAT survey can be averaged out to give a Composite Customer Satisfaction Score by taking the number of satisfied customers and dividing them by the number of surveys received. CSAT Surveys remain the most successful way to elicit customer feedback and come in a variety of forms and templates. Customers may be accustomed to a traditional questionnaire or website form, but more and more, the less traditional format, such as a popup, an app, via text message, or other unconventional methods, are being adopted as users can easily navigate these methods within the comfort of their touchscreen devices.  

Why Are Customer Satisfaction Surveys Important?

When customers feel their voice is being heard, they are more likely to communicate their unique and personal experiences with a product or service. In the event of negative experience feedback, customers are more likely to stay if they can see their experience remedied. Unsatisfied customers have the potential to become loyal promoters after being retained from negative feedback, and a well-timed customer satisfaction survey can hone the customer journey and improve satisfaction, retention, loyalty, and likelihood to repurchase.

Moving Forward with CSAT Surveys

Occasionally customer satisfaction feedback will provide a descriptive experience, especially if open-ended questions are included, but most customer feedback will be brief, concise, and to the point. Whatever form the feedback takes, the notion that any feedback is better than none remains, and the CSAT score is the best way to receive,  sort, and take data-based action to improve. 

Utilizing CSAT scores and insights wisely can lead to a positive influx of new customers and contribute to well-maintained relationships with existing ones. 

Sign up for a demo today with InMoment!

competitor analysis

As business professionals, our lives often involve one or more reports packed with market research data every week, if not every day, providing an onslaught of facts and insights. Most of us have experienced the fatigue and boredom brought about by too many facts and too little learning.

So, how can we deliver effective market research data reporting and communication of information and insights in a way that captures the imagination and garners interest and, more importantly, inspires action? Storytelling.

The Importance of Storytelling

The most critical ingredient of effective market research reporting comes in the shape of stories. Storytelling is rarely given the attention it deserves. If research is both art and science, we need to blow the dust off the art elements including writing, presenting, persuading, visual arts, theatrical arts, and the art of storytelling.

For the last few decades, with the dramatic increase of data and information availability, the users of information frequently find themselves in a tough place to make any meaningful conclusions. Especially in the marketing research industry, the research buyers have been identifying the lack of “a story” in the delivered reports by research suppliers. The users of research cry that they do not want just scores and statistics, rather they want a story that tells “what happened” or “why is that important” based on those scores and statistics.

4 Steps to Telling a Story with Market Research Data:

It is necessary to use a set of principles to find insights and then outline steps to successful communication of market research data and insights to business end-users. Consider this method:

Step #1: Understanding

Context is everything. Before designing a research study, it is critical to understand the business’s objectives, current environment and situation, pain points, the stakeholders’ interests, and the use of information. Researchers gather context about the business and the research needs through the clients, their organization, and other outside sources before planning and designing the study.

Step #2: Planning

Design a research study with the “end in mind” and look at the process from the end to the beginning. First, focus on the business objectives, then design the way to deliver the information to meet those objectives, then design the analytic plan to provide this information, and finally design the survey instrument and the sampling frame to collect the data to be analyzed.

Step #3: Discovery

When the data is collected, an essential step is to review the data and discover the story hidden in it. It is a common failure of many market research studies that the researchers deliver a long report of results from the study, basically a dump of information, question by question, without focusing on a story to answer the specific research and business objectives. Instead, a discovery phase needs to occur, where the data is reduced to a coherent story that will answer businesses’ research questions.

Step #4: Communication

Finally, now that the data is reduced to a story, how do you tell that story in the most effective way? This is the last and most important element of delivering research results, as only effective communication of results will accomplish the goal of meeting the business’s research objectives.

There are many ways of making the communication of research story effective, but we will focus on three of those ways here to share some best practices we implement for effective business reporting: Use of visuals, colors, and dashboards.

Use Graphics and Charts

When reporting on market research data, visual components are the centerpiece. A busy reader will often flip through and look at the main diagrams and charts in a report, much the same way that someone flips through a magazine or newspaper and looks at the pictures (and maybe reads the captions). To get your point across in a report, make sure that the visuals are conveying the point—don’t hide your conclusions in the accompanying text. Moreover, neuroscience tells us that recall is also better when accompanied by visual elements—something to which the reader can attach ideas.

Visuals in research reporting are generally either “graphics” or “charts.” Generally, charts visually plot the size of market research data, while graphics show the relationship between concepts/objects or the ow in a process. This distinction matters because graphics are useful for helping show the structure of the story we are telling, while charts are useful for clearly showing the evidence that backs our story. We utilize these graphics to tell a clear and concise story.

Graphics “show” in one complete picture these connections, whether it is a chronological order, a cause-and- effect relationship, or an organizational structure, in a simple pictorial way, making it easier to comprehend and recall. While graphics narrate the story and provide a way to visualize the market research data, charts fill in the details and support the points we are making.

The traditional style of research reporting often fails to engage the attention and therefore the brain of the reader, resulting
in a lack of processing, memory and recall. There are ways to combat this problem, using editing and data density.

  • Editing refers to the process of cutting distracting content. Review the chart for repetition, for non-results, for unnecessary text that does not provide additional information, and for relevance to the main objectives. The editing step reduces long, repetitive charts.
  • Data Density refers to the quantity of market research data points that are shown in a given space. Instead of using repetitive charts to display multiple data series, we can use the idea of data density by combining multiple series on the same chart to improve the flow and interpretive richness of the report. When data elements are far apart in the report, insights can be missed. The human eye and mind are more adept at noticing patterns than we give it credit for, so dense data displays play to this strength of the brain and keeps it engaged.

An important step in creating better charts is focusing on the key elements and deleting the rest so as not to clutter the charts. Another way to increase data density is through interactivity. Interactivity means allowing the user (either a reader or a presenter) to interact with the data by making choices about what they want to see.

Convey the Story Quickly and Accurately

With increased amount of information available through various sources, it has become a major challenge for marketing research professionals to reduce the vast amount of data into meaningful messages for audiences. Many audiences find themselves flooded with just ‘data’ and ‘information’, overwhelmed with statistics and facts, and left without true insights that should inform marketing and strategic decisions.

To overcome this challenge, the key is to tell a story from the data. A coherent and clear story that is relatable to the audience will be more successful in capturing the audience’s attention, and will succeed in communicating the message by creating curiosity in the audience’s mind and engaging them in thinking.

Use of visuals is critical in presenting a successful story, but visuals need to be selected and constructed carefully to create the best effect on the audience. Editing and data density are key ways to improve the readability and effectiveness of reports. Interactivity uses the reader’s working memory to help them see localized patterns in the data.

These tools together make the evidence provided by the charts more powerful and relevant to the story. Understanding how people perceive and compare shapes in charts allows us to construct visuals that accurately and quickly convey the story.

Seamless Retail Experiences

It is no secret that today’s retailers are faced with unique challenges. The rapidly-changing, ever-evolving retail landscape continues to present questions, roadblocks, and pain points that retailers need to address. These tribulations can take many forms; defining customer loyalty in emerging consumers, creating seamless retail experiences across channels, tracking a customer base that seems to be in multiple places at once, and keeping up with a digital landscape that changes as frequently as the Cleveland Browns change quarterbacks. 

In such a fast-paced environment, how are retail brands expected to succeed? The keys lie in your customer data—and how you leverage it. 

3 Necessities for Stand-Out, Seamless Customer Experiences in Retail

  1. Integrate Data From Everywhere Into Your CX Platform
  2. Increase Experience Awareness
  3. Encourage a Culture of Commitment 

#1: Integrate Data From Everywhere Into Your CX Platform

One of the most important keys to deliver seamless customer experiences is to have seamless data integration from everywhere into your CX platform. In order to form a holistic view of your customer’s experience, you need to be able to analyze every data point you can. 

Your customer’s data comes in many different forms (you can learn more about customer data in this article from InMoment Customer Insights Expert Jessica Petrie). Whether it be surveys, review sites, or social media. If you only look at one or two of those data sources, your view of the customer is incomplete, and it may cause you to make decisions for a customer base that you don’t fully understand. 

To continue to provide stand-out experiences, you need to view the customer experience from every angle, and across every channel. This is done by making sure your CX platform is capable of ingesting all of your data and displaying it in an easily accessible, centralized location so that you can access holistic customer insights whenever you need. 

#2: Increase Experience Awareness

Across the hundreds of brands and partners we’ve worked with here at InMoment, we have learned what works, formed a cohesive and proven approach, and can now guide our clients toward a successful CX governance strategy. This strategy will look different depending on the size and structure of your organization. 

Regardless of what you call it or where it lives, you need to have a plan for how you will make your CX program an organization-wide, customer-centric initiative—and keep it that way. It has to be more than just saying you are customer-centric, or having the word “customer” in your mission statement. 

Every department should have a window into the insights you gain from your CX program—and be able to leverage them in their decision making. The information you receive from customers needs to be shared with all other departments and teams, not siloed in different departments, otherwise, you could be sitting on insights that could make a huge difference in your bottomline. When you break down those silos and create channels of communication across departments, your business will see more success in the areas that matter most!

The first step to creating that kind of organizational support and buy-in for your CX program is to create a cross-functional council. This council, made up of representatives from every part of the organization, should be chaired by the CEO or a high-level CX champion. 

This council should aim to manage the activities of the tactical working teams that are striving to improve the customer experience as well as communicate expectations throughout the company and particularly to the customer-facing associates. 

For example, many large organizations have a Chief Customer Officer, an executive professional in charge of the company’s relationship with the customer, who reports to the CEO.   

Truly best in class CX companies will often have what we call CX Champions, Ambassadors or Champions scattered throughout the company that are championing or spearheading efforts within each of the silos we discussed.

#3: Encourage a Culture of Commitment 

A “Culture of Commitment” is the ultimate goal of any customer experience program. In a company with a true Culture of Commitment, every single employee is invested in making experiences better for customers. Whether it be in store, over the phone, or online, these employees are the face of your CX program, and they understand the impact they are making on customer experiences every day. 

When your employees are engaged in the experience, your organization will benefit. Did you know that 70% of the time, a person will become a repeat customer when their complaint is resolved? And that engaged employees can increase an organization’s sales by up to 20%? 

By having engaged, customer-centric employees, you will see an increase in the frontline metrics that matter to your organization. Frontline employees are the biggest customer facing assets your organization has. While executive sponsorship is important, your CX program needs buy-in from everyone in the organization in order to be successful. 

How a Global Footwear Retailer & InMoment Client Started with Customer Data, Fostered CX Governance, and Inspired a Culture of Customer Commitment

One of our clients, a global footwear retailer, leveraged all three of these strategies to move toward a fully customer-centric approach to business. 

It started a few years ago, when an operations team leader, who was passionate about his team being customer-centric, started using customer data points as supporting points in conversations with his team. 

These conversations would look like “Did you know that when our associates offer additional merchandise at the point of purchase, there is a 17% average transaction size uplift.” or “Did you know when our associates are successful helping a customer try on a shoe, they are 3x more likely to make a purchase.”  

This CX champion was able to leverage these customer insights to socialize this information, and make other departments and employees aware of how they could improve the customer experience. Through these actions, a small cross-functional CX governance committee was formed. 

This team was able to get the attention of the executives with their data-driven decision making and were therefore able to help the c-suite realize that factors such as employee behavior, customer behavior, and customer insights are all important factors that drive sales and increase the bottom line. 

After the C-suite executives realized the importance of a CX program, they invested more into it. The CX program adapted and started to utilize an integrated approach to customer experience, where they combined insights from different areas of the organization. And with that approach, they are set to set off the same cycle of success over and over again!

So What? 

Based on our expertise and the lessons we have learned from all the CX programs we have helped grow, we have formulated a list of next steps that will help you make progress towards integrated CX!

Step #1: Go Beyond Surveys

Integrated CX isn’t just about surveys. Find other signals in your organization, and integrate them into your program. 

Step #2: Understand Emerging Customers

Continue to understand your customers. But, you also need to listen to the non-purchaser. Having a deep understanding of your future or potential customers will help you make business decisions. 

Step #3: Get Ahead, Stay Ahead

Having a plan in place is key to your CX success. At InMoment, we often talk about designing with the end in mind. Knowing where you want your CX program to go and what you want to accomplish is key for starting out in a CX program. 

Step #4: Action, Action, Action

Go to work. Identify the initiatives that will have an economic impact. All action taken should be tied back to a specific outcome. 

If you want to learn more about leveraging customer data to craft seamless, differentiated experiences in store & online, watch the full webinar here!

Survey Methodology

Survey Methodology

When it comes to collecting data, one of the best ways to do so is a survey. Most companies put out surveys of some kind for customers and employees at different points. But there’s more to a survey than just a series of questions. In fact, surveys typically have a method behind them to gather specific types of data and to make them as effective as possible. But what is a survey method? What is survey methodology? Read on to learn about survey methodology and why that matters.  

What Is Survey Methodology? 

What is survey methodology? To begin, it’s important to distinguish between a survey methodology and a survey method. A survey method is the process or tool you use to gather information via a survey. For example, you might create an online survey with multiple choice questions, and that would be your survey method. A survey method can be qualitative or quantitative. We’ll talk more about survey method options and their pros and cons later on. 

Survey methodology, on the other hand, is the study of survey methods. It’s looking at all of the survey methods available and using applied statistical information to determine what methods give certain errors and where accuracy can be improved. Essentially, survey methodology studies sampling techniques and practices and determines the accuracy, so researchers of all kinds can improve their methods and get more accurate results. 

What Is the Purpose of Survey Methodology? 

So what is the purpose of survey methodology? Why do we have an entire field of applied statistics working on surveys? It’s important to understand why survey methods matter first. Survey methods are designed to help researchers and companies get information as accurately as possible. After all, the data you gather isn’t worth much if it’s completely inaccurate or riddled with errors that make it difficult to use. Survey methods are how you get data. 

Survey methodology exists to support survey methods. Survey methodology is all about studying the ways to improve the accuracy of survey methods, so researchers and companies can get the most accurate results from their surveys. It’s a field that exists to minimize errors—any deviations from your desired outcome—and help create data that’s as accurate to a population as possible. 

Think about it this way. The common stats phrase for setting up a survey is, “Garbage in, garbage out.” That means that if your method gathers bad data, you’re going to get bad results. The bad data can come from a variety of sources, but one major source is that your tool for gathering the data isn’t very accurate. Survey methodology’s purpose is to make those tools as accurate as possible. It’s what helps researchers and companies get great tools or methods to gather reliable data and get accurate results. 

Types of Survey Methods

Now that it’s clear what the difference between survey methods and survey methodology are, we can look at common types of survey methods available. 

Quantitative and Qualitative

Methods can include both qualitative and quantitative data, but what’s the difference? Qualitative data is descriptive data and more conceptual data. For example, if your survey is gathering qualitative data, you would want to collect quotes from respondents and try to look at the emotions and sentiments of your potential customers, rather than performing a statistical analysis. Qualitative data is the heart of data. 

Quantitative data is data that’s numerical—or quantifiable. When you perform a quantitative survey, you’re gathering information you can do a statistical analysis on; you want to know numbers. While qualitative data is the heart of your data, quantitative data is the bones and muscles; it’s what gives your data structure and support. 

Both quantitative and qualitative data are incredibly important. When you’re choosing to collect data, think about what you hope to accomplish with your data and whether you’re collecting qualitative data or quantitative data. That’s an important part of your survey methods. 

Structured and Unstructured

Another important part of your methods is the structure you choose. Some surveys are very particularly structured while some or more unstructured and allow respondents more liberty with how they answer and where the conversation goes. To determine how much structure you want, think about what kind of data you want at the end. If you want very specific types of data and quantitative data, you would probably choose a structured method that has people responding to exactly what you’re exploring. 

If you’re looking more at qualitative data, you might find it beneficial to take either route. On paper, a structured survey might be easier and get you the information you need. In an interview survey, you could go either way—or even strike a balance between the two—depending on if you’re interested in seeing where the conversation ends up going or in gathering data on something specific. 

Open Ended or Closed Ended Questions

Now it’s time to think of the methods for questions. In general, you can gather information from open ended or closed ended questions. Open ended questions are ones without answer options, a yes or no response, or a true and false response. These kinds of questions are typically geared toward qualitative data (but can be flexible, of course). Closed ended questions typically have respondents choose from some kind of option or require a one-word or one-number kind of answer. These questions are common for quantitative methods. 

Ultimately, a great survey may combine both open ended and closed ended questions to get a variety of data. 

Survey Collection Methods

The final aspect of your survey methods is the method of collection. There are many ways to collect data, but these are a few common ways with their advantages and disadvantages: 

  • Face-to-face
    • Pros: very personal, allows you to see non-verbal nuance, flexible for both structured and unstructured questions
    • Cons: can be time consuming to set up and takes resources to make happen
  • Online
    • Pros: easy to organize, can be easy to get large amounts of data at once, digital responses that are easy to analyze
    • Cons: could be subject to survey response bias, respondents may not complete the entire survey
  • Observations
    • Pros: simple to do and doesn’t require expert design, great for testing hypotheses
    • Cons: could affect the accuracy, no controlled variables
  • Focus groups
    • Pros: easy for qualitative and unstructured data gathering, get a variety of perspectives, may lead to salient ideas you haven’t considered
    • Cons: participants might not reveal their true thoughts, opinions of the respondents could be influenced by other participants

As you can see, there are so many survey methods to choose from to consider. And survey methodology is all about how to make these methods more effective. 

How to Write a Survey Methodology

When you’re going to use a survey, you can write out your methodology—or all the components of your methods and how effective they may be. Here are the steps to writing a survey methodology: 

  • Define your sample group and size (evaluate for accuracy against the population)
  • Decide on your methods and data collection method (while evaluating the effectiveness of those choices)
  • Design your survey questions and remember to keep in mind: 
    • The approach
    • Your time frame
    • Your method of collection
    • The wording of questions
    • Biases
    • (Evaluating each of these helps determine the accuracy of your methods)
  • Collect data
  • Organize and analyze your results

At the end of it, your methodology is all about thinking about and evaluating your accuracy with your chosen survey methods. 

The Bottom Line

Surveying can be a lot—especially when you not only have to consider your methods but also your methodology. There’s a lot to consider for data collection and analysis. But you don’t have to do it alone. InMoment—a leader in survey creation, collection, and analysis—is here to support you. Contact us today to see how we can help you with your survey methodology. 

Change Region

Selecting a different region will change the language and content of inmoment.com

North America
United States/Canada (English)
Europe
DACH (Deutsch) United Kingdom (English)
Asia Pacific
Australia (English) New Zealand (English) Asia (English)